Visualize
Opens an intuitive interphase to create and save visual widgets.
Navigate to the Data Stores list page.
Select a Data Store from the Data Stores list.
Click the Visualize icon for it.
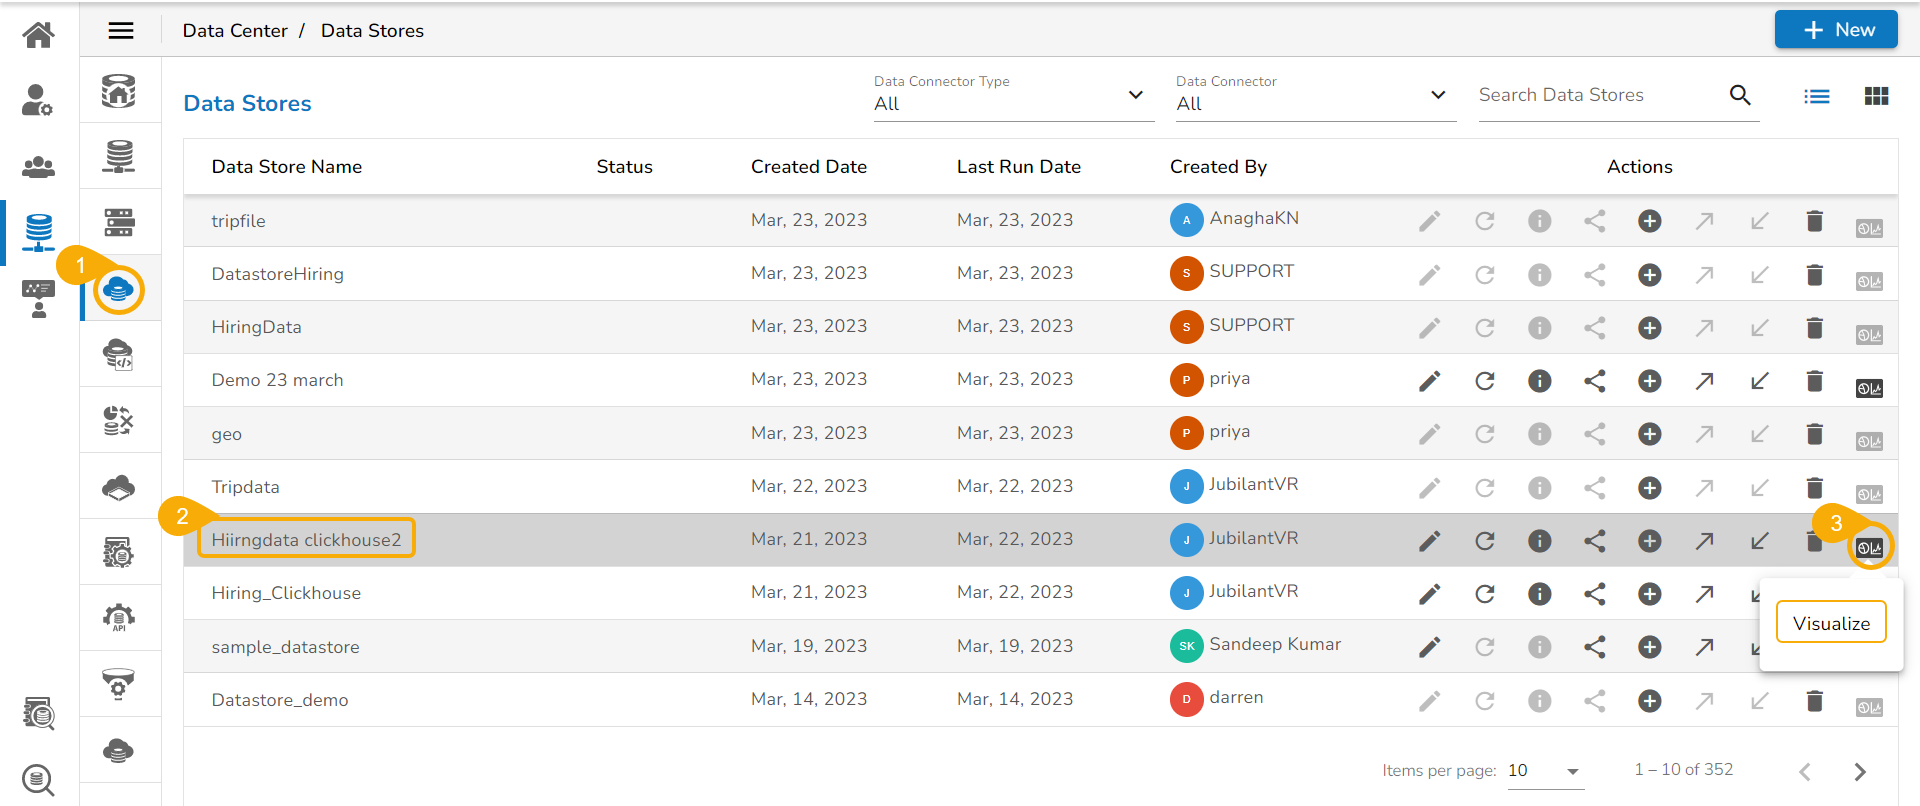
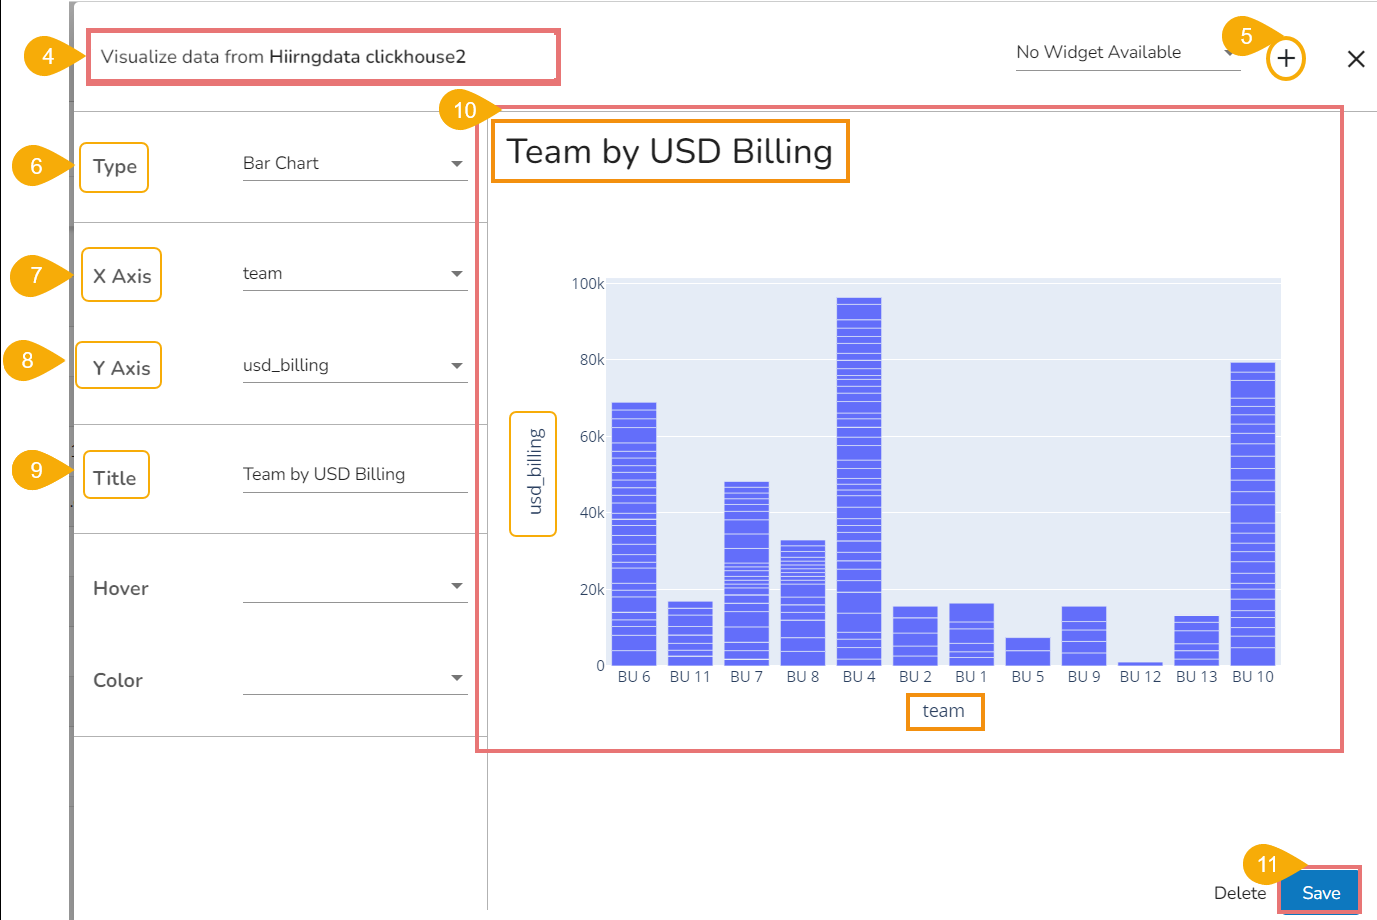
The Widget Visualizer page opens for the selected Data Store.
Click the Create New Widget icon.
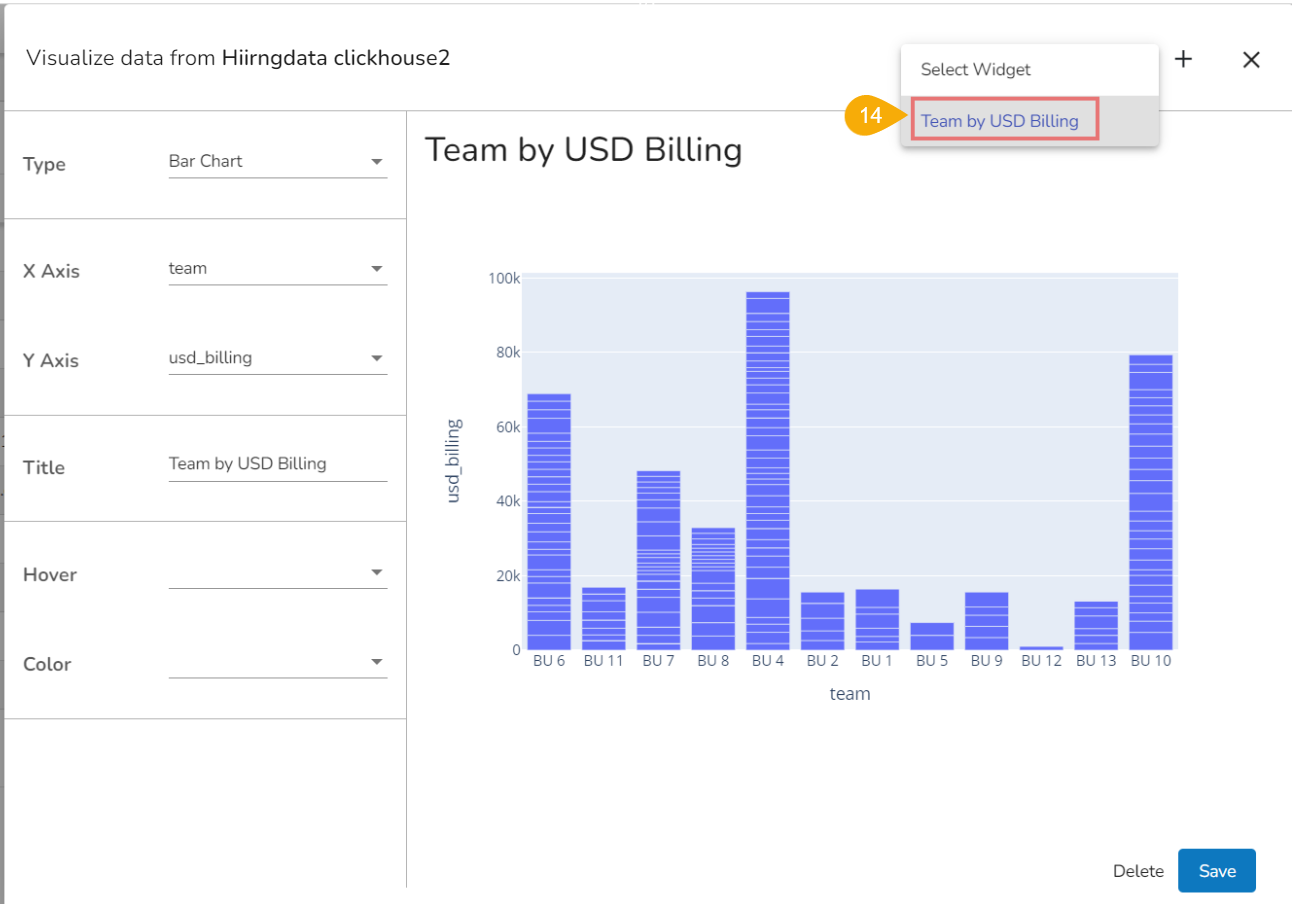
Select a chart type from the drop-down menu.
Select a data field for the X-Axis.
Select a data field for the Y-Axis.
Provide a Title for the Widget.
A View/widget gets created based on the selected X and Y axis data values.
Click the Save option.
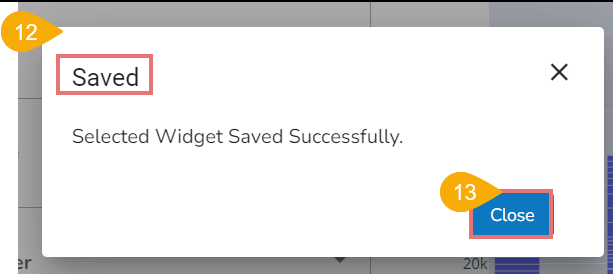
The View/widget gets saved and the same gets notified by a message.
Click the Close option to close the notification.
The saved widget can be seen in the drop-down while opening the Widget Visualizer next time for the same Data Store.
Please Note:
The Widget Visualizer will not process the View until you provide a Title to the View.
The user generate and save multiple widget by using the same set of steps.
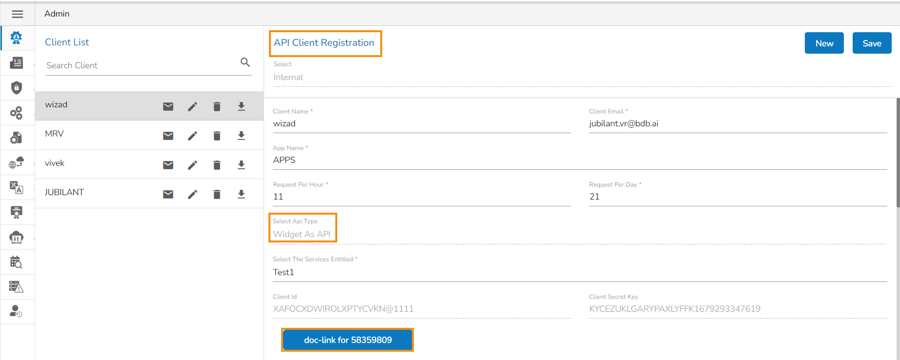
The saved Widget can be also shared as APIs. The saved widgets will appear under the API Client Registration as Widget as API under the Select API Type drop-down option.