
Functions
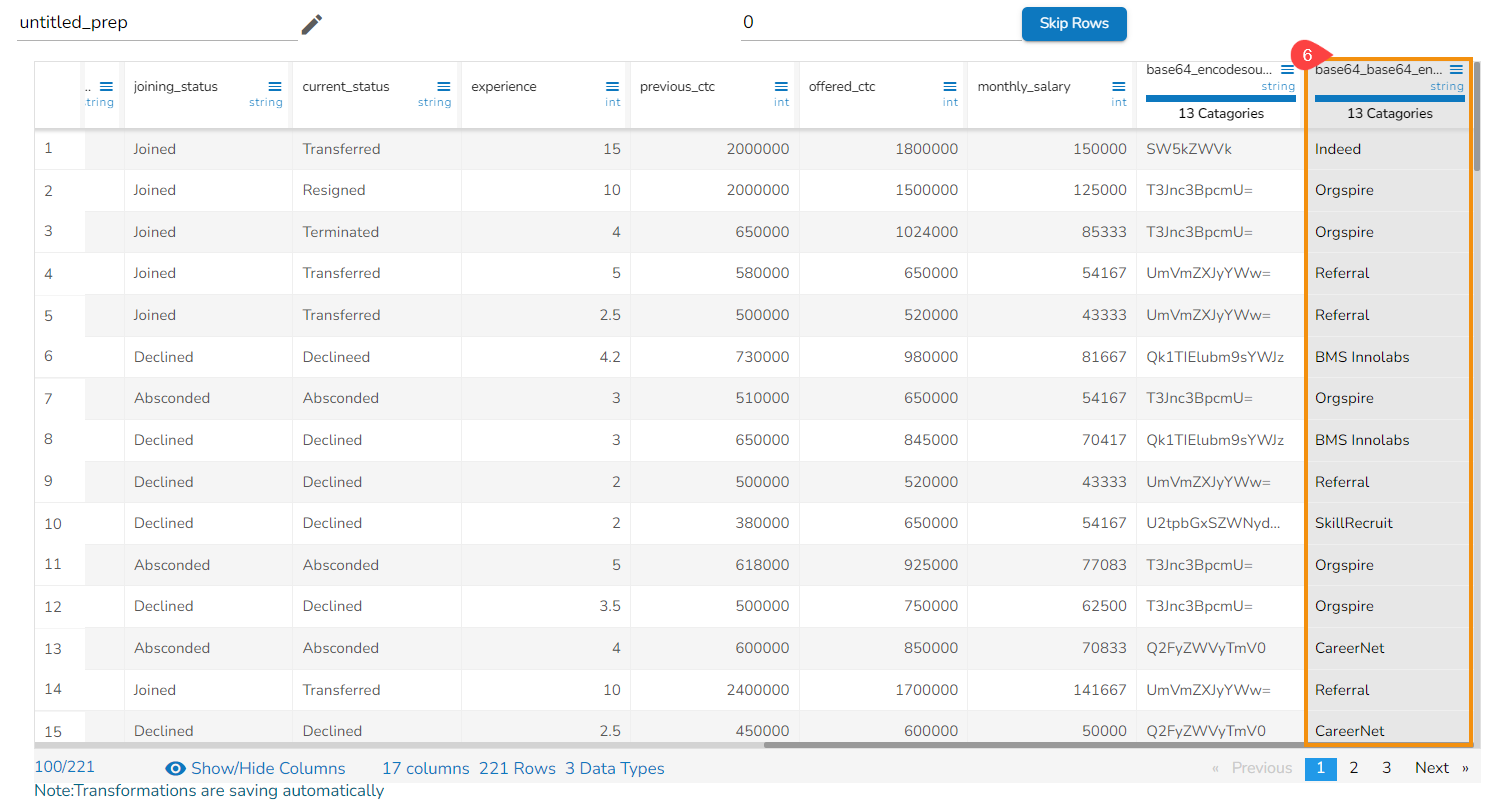
Base 64 Decode
The Base64 is a method of representing data in a binary format over text protocols. Text values are converted to binary values 0-63. This transformation helps the user to convert an input Base64 value to the text. The output type is String.
Check out the given walk-through on how to apply the Base64 Decode transform.
Steps to perform the Base 64 Decode transformation:
Select a String-based column in which the data is in the Base64 encrypted format.
Open the Transforms tab.
Select the Base64 Decode transform from the Functions category.
Enable the Create new Column option.
Click the Submit option.
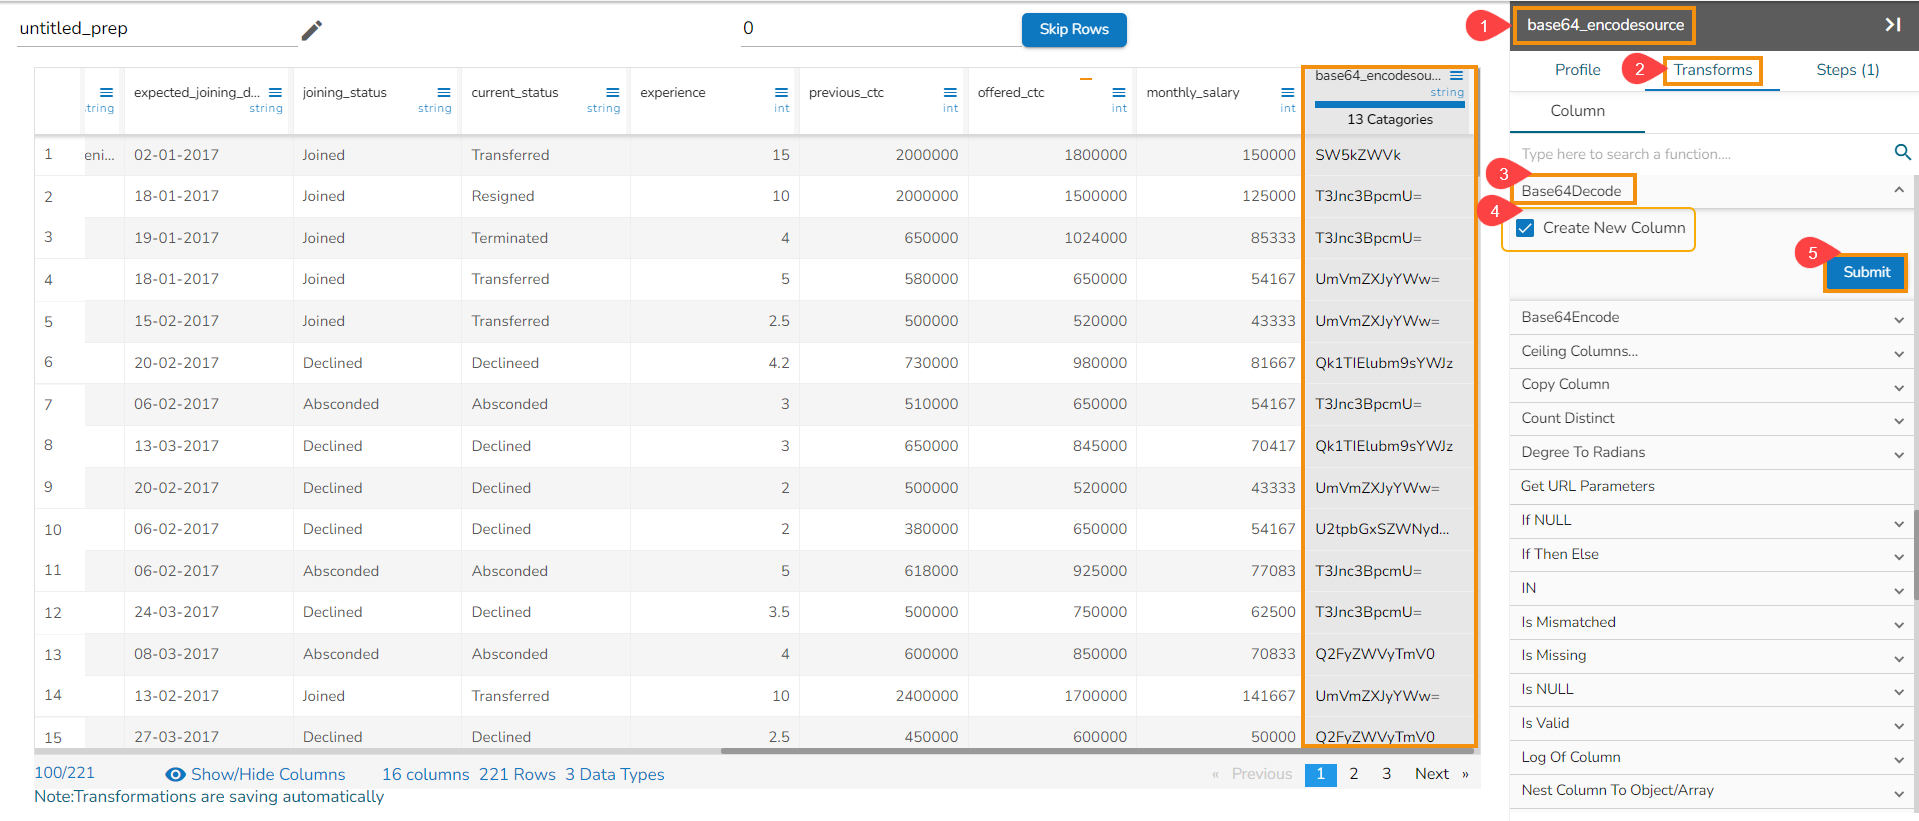
The decoded data will be returned in a new column.
Base 64 Encode
This transformation helps to convert an input value to base64 encoding with optional padding with an equal sign (=). Input can be of any type. The output type is String.
Check out the given walk-through on how to apply the Base64 Encode transform.
Steps to perform the Base 64 Encode transformation:
Select a String based column.
Open the Transforms tab.
Select the Base64 Encode transform from the Functions category.
Enable the Create new Column option.
Click the Submit option.
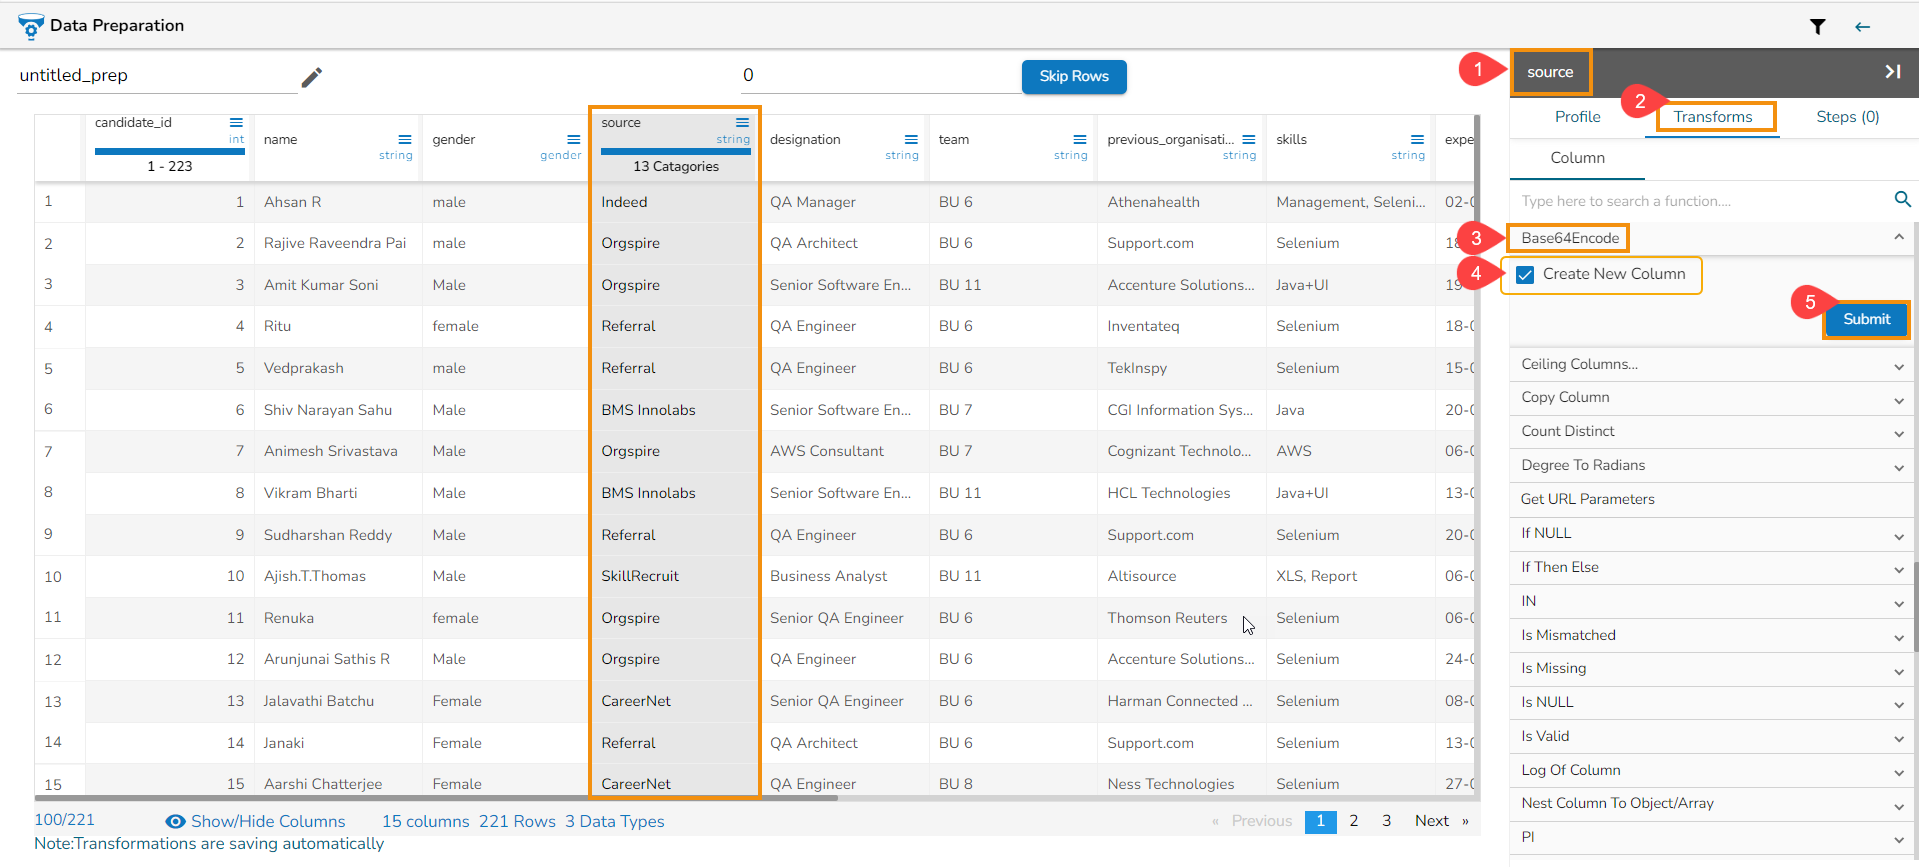
The encoded data will be returned in a new column.
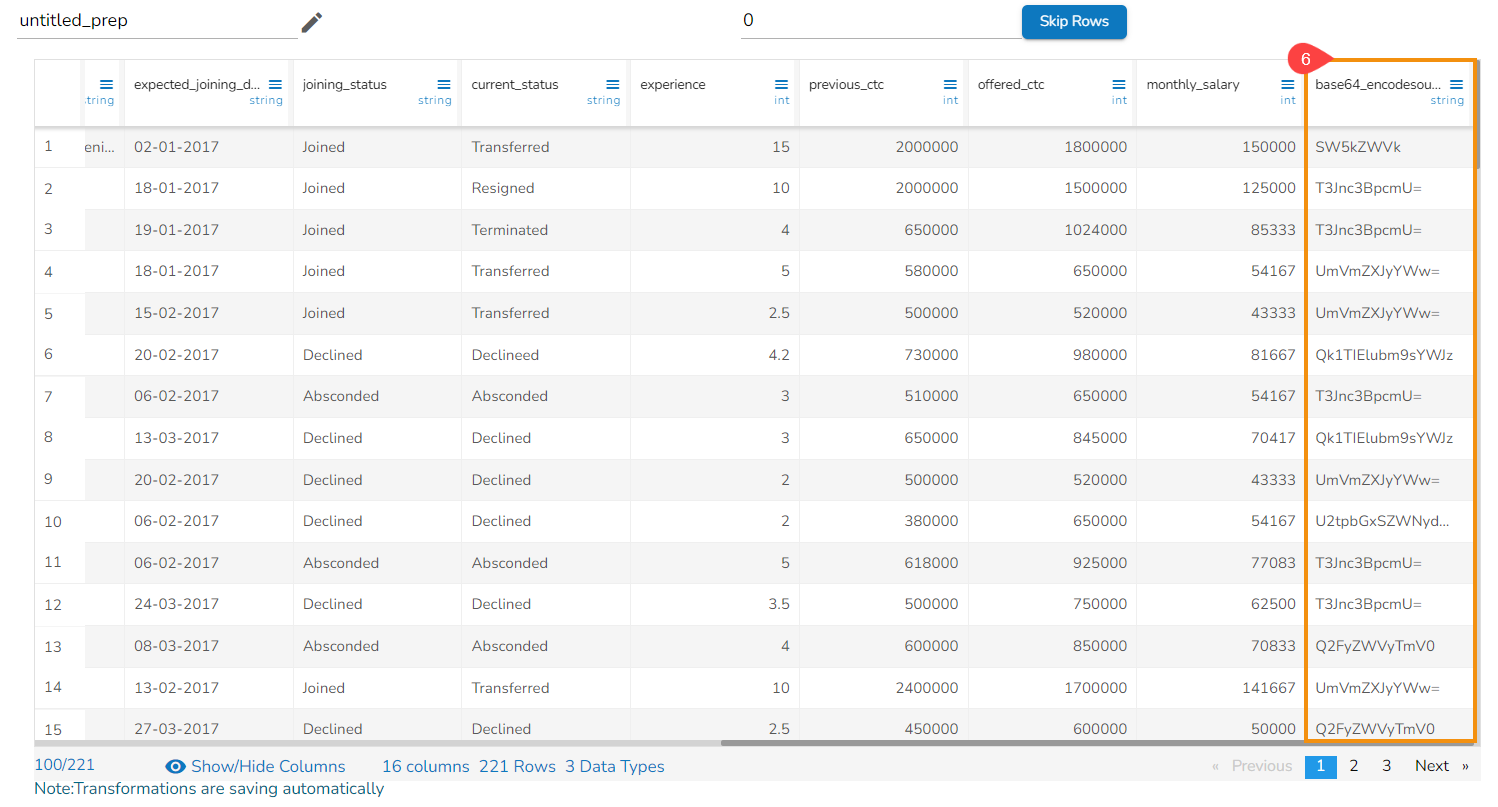
Please Note: The column with the encoded data gets added at the end of the dataset by default.
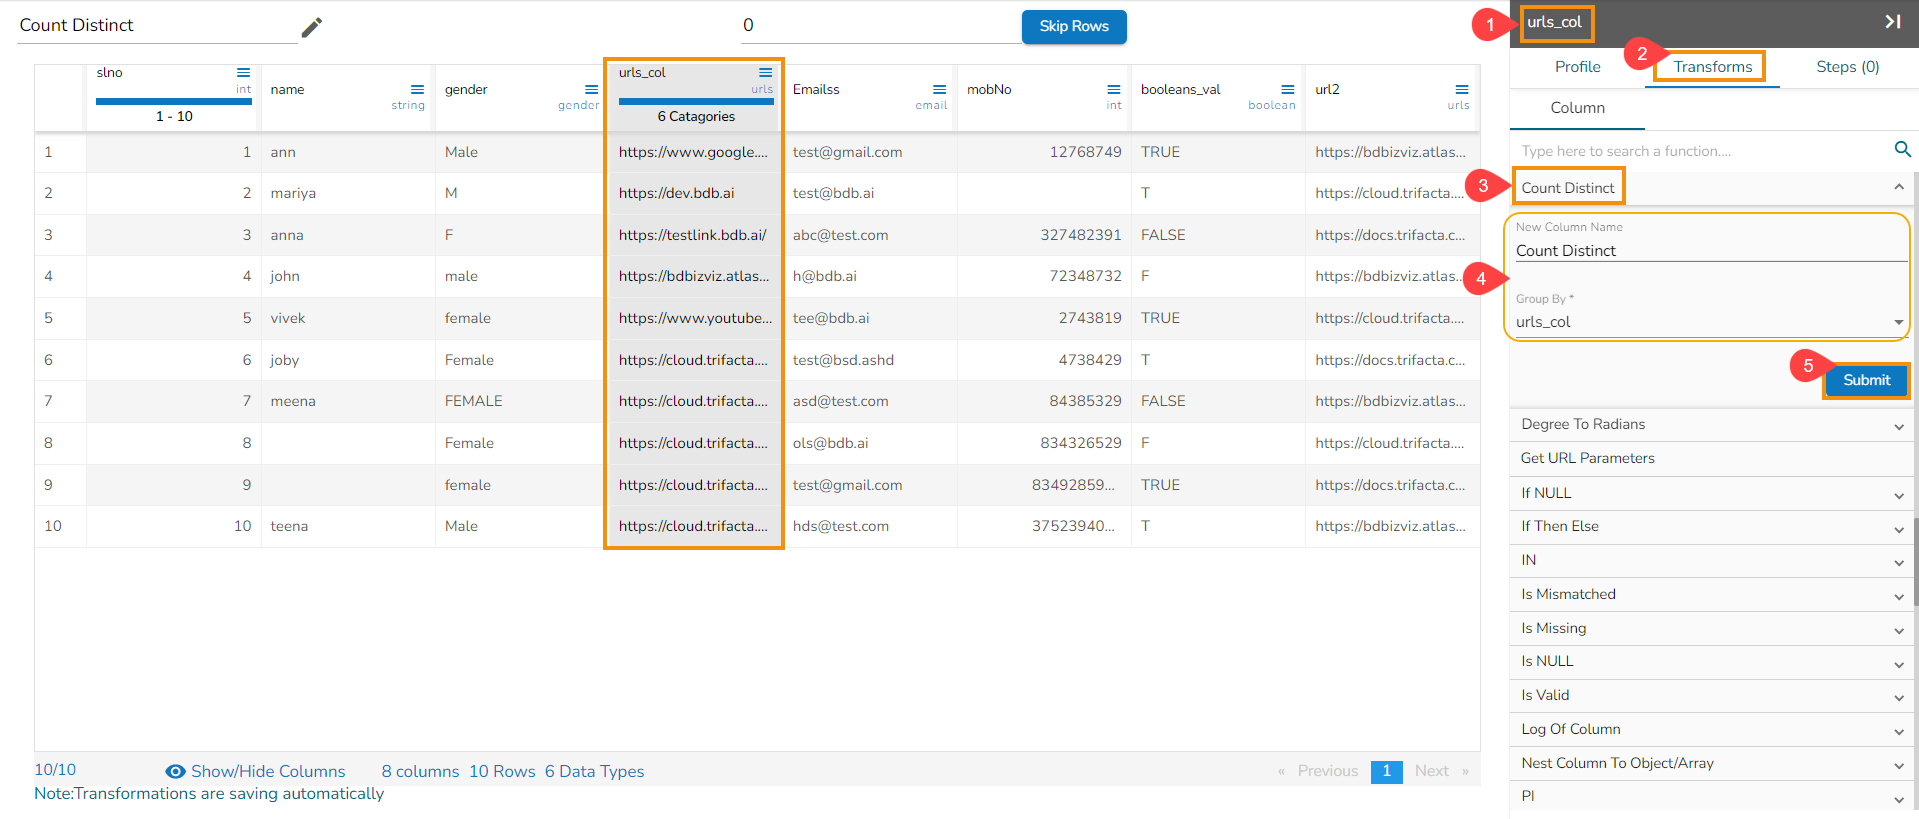
Count Distinct
This transformation helps to generate the count of distinct values in a specified column, optionally counted by the group.
Check out the given illustration on how to use the Count Distinct transform.
Steps to perform the Count Distinct transformation:
Select a Source column from the dataset.
Select the Count Distinct transform from the FUNCTIONS category.
Provide a New Column name.
Select the Group by Columns.
Click the Submit option.
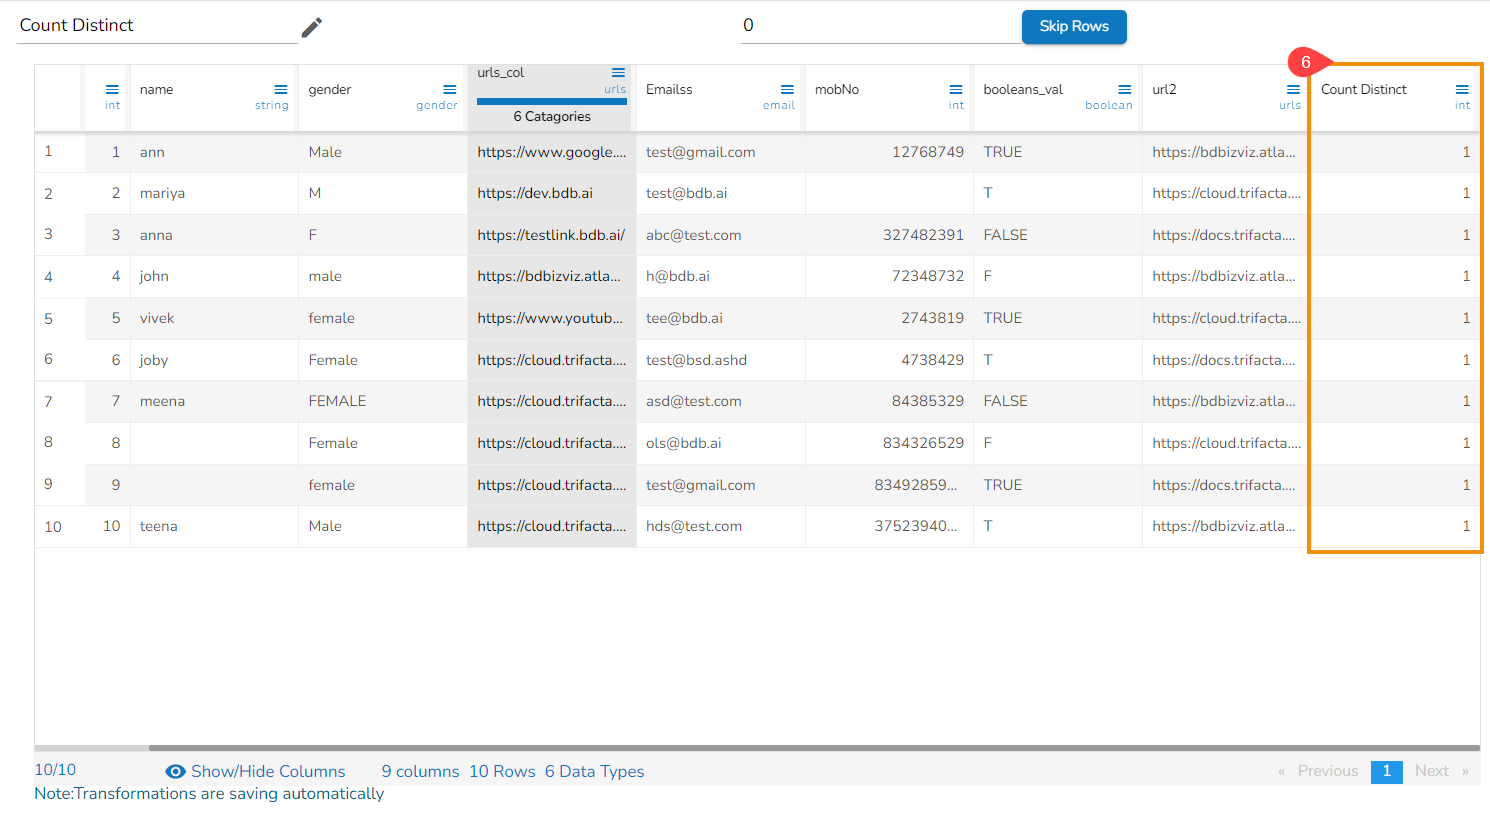
The result will appear in a new column for the selected group by column(s).
Check out the given illustration to understand how to apply the Count Distinct transform.

Please Note: The users can select multiple columns as Group By column while applying the Count Distinct transform.
Count Occurrences
Count Occurrences is to check the count of occurrence of a word/letter/ digit in a sentence
E.g., “In traditional grammar, it is typically defined as a string of words that expresses a complete thought, or as a unit consisting of a subject and predicate. “
The above sentence contains count of occurrences of the word “as” two times in it.
Check out the given walk-through on how to use Count Occurrences.
Create a Geopoint from Latitude and Longitude
The Create a Geopoint from Latitude and Longitude helps to create a column in a geo point format from two columns containing latitude and longitude.
A geo point (or geographical point) is a specific point on the Earth's surface that is identified by its latitude and longitude coordinates. Latitude measures how far north or south a location is from the equator, which is designated as 0 degrees latitude. Longitude measures how far east or west a location is from the Prime Meridian, which is designated as 0 degrees longitude.
Check out the given walk-through on how to create Geo points column based on the Longitude and Latitude data.
Steps to perform the transform:
Select a dataset that contains Latitude and Longitude data in it.
Open the Transforms tab.
Select the transform.
Select the Latitude & Longitude fields using the drop-down option provided for the respective fields.
Provide a name for the New Column.
Click the Submit icon.
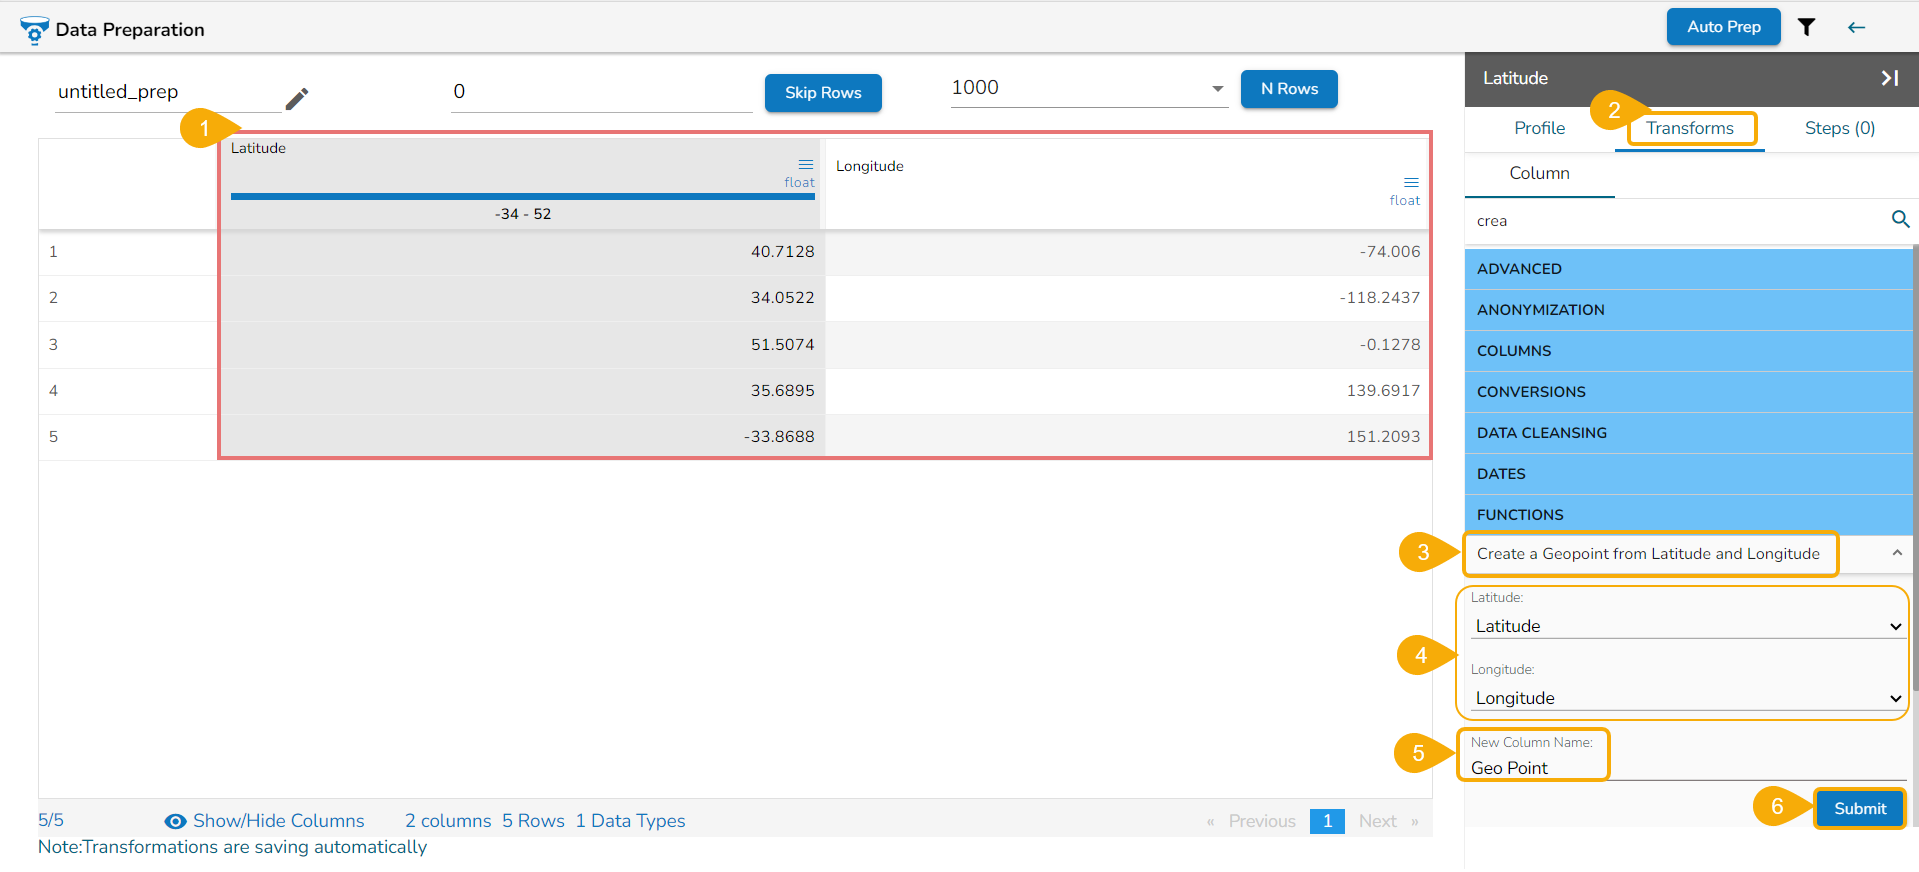
The result will be shown in a new column with the same name as provided by the user.
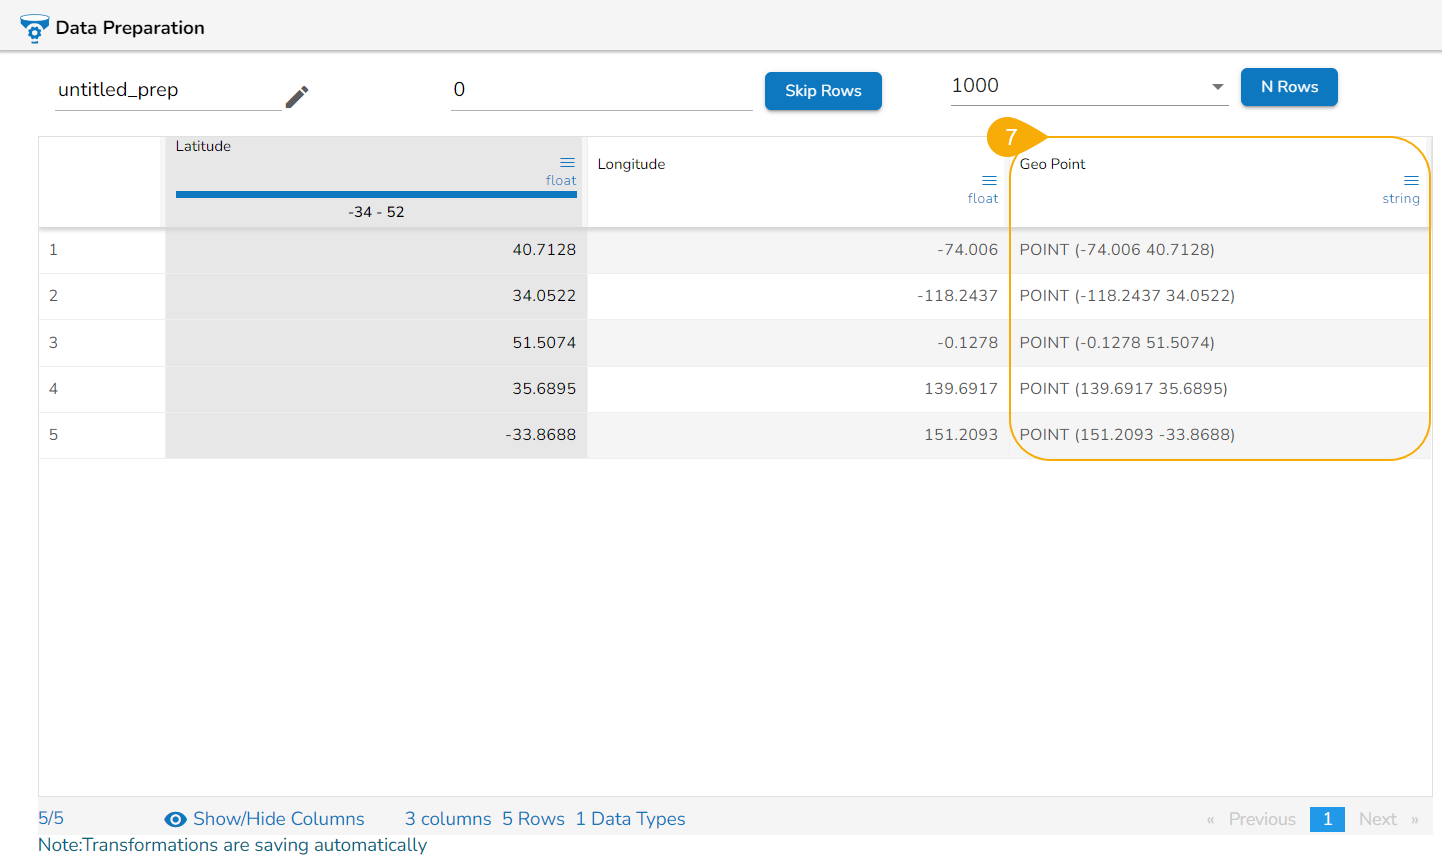
Please Note: The format to create a geo point column is: POINT (Longitude Latitude).
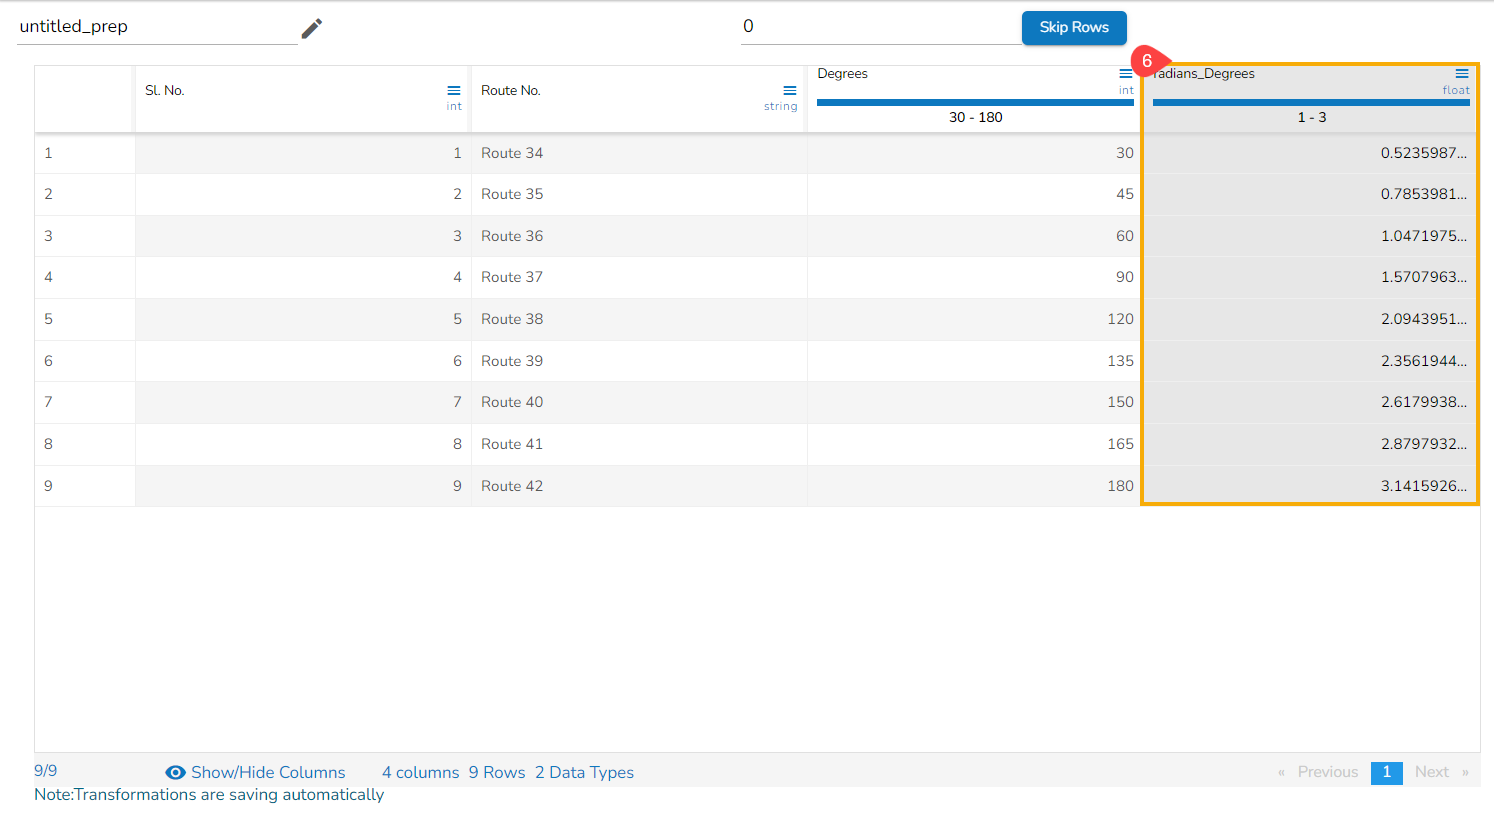
Degree To Radians
The degree to radian data transformation is a simple mathematical conversion that allows you to convert angles from degrees to radians. Radians are another unit of measuring angles, and they are commonly used in advanced mathematics and physics because they have some convenient properties when working with circles and trigonometric functions.
The value can be a Decimal or Integer.
Please Note: Input units are considered in degree dividing the value by 57.2957795
Check out the given illustration on how to use the Degree to Radians transform.
Steps to perform the transformation:
Select a column from the dataset within the Data Preparation framework.
Navigate to the Transforms tab.
Open the Degree to Radians transform from the Functions category.
Select Create a New Column to create a new column with the transformed values.
Select one or multiple columns that need to get converted (Use Numerical Columns like int, float, decimal, etc.).
Click the Submit option.
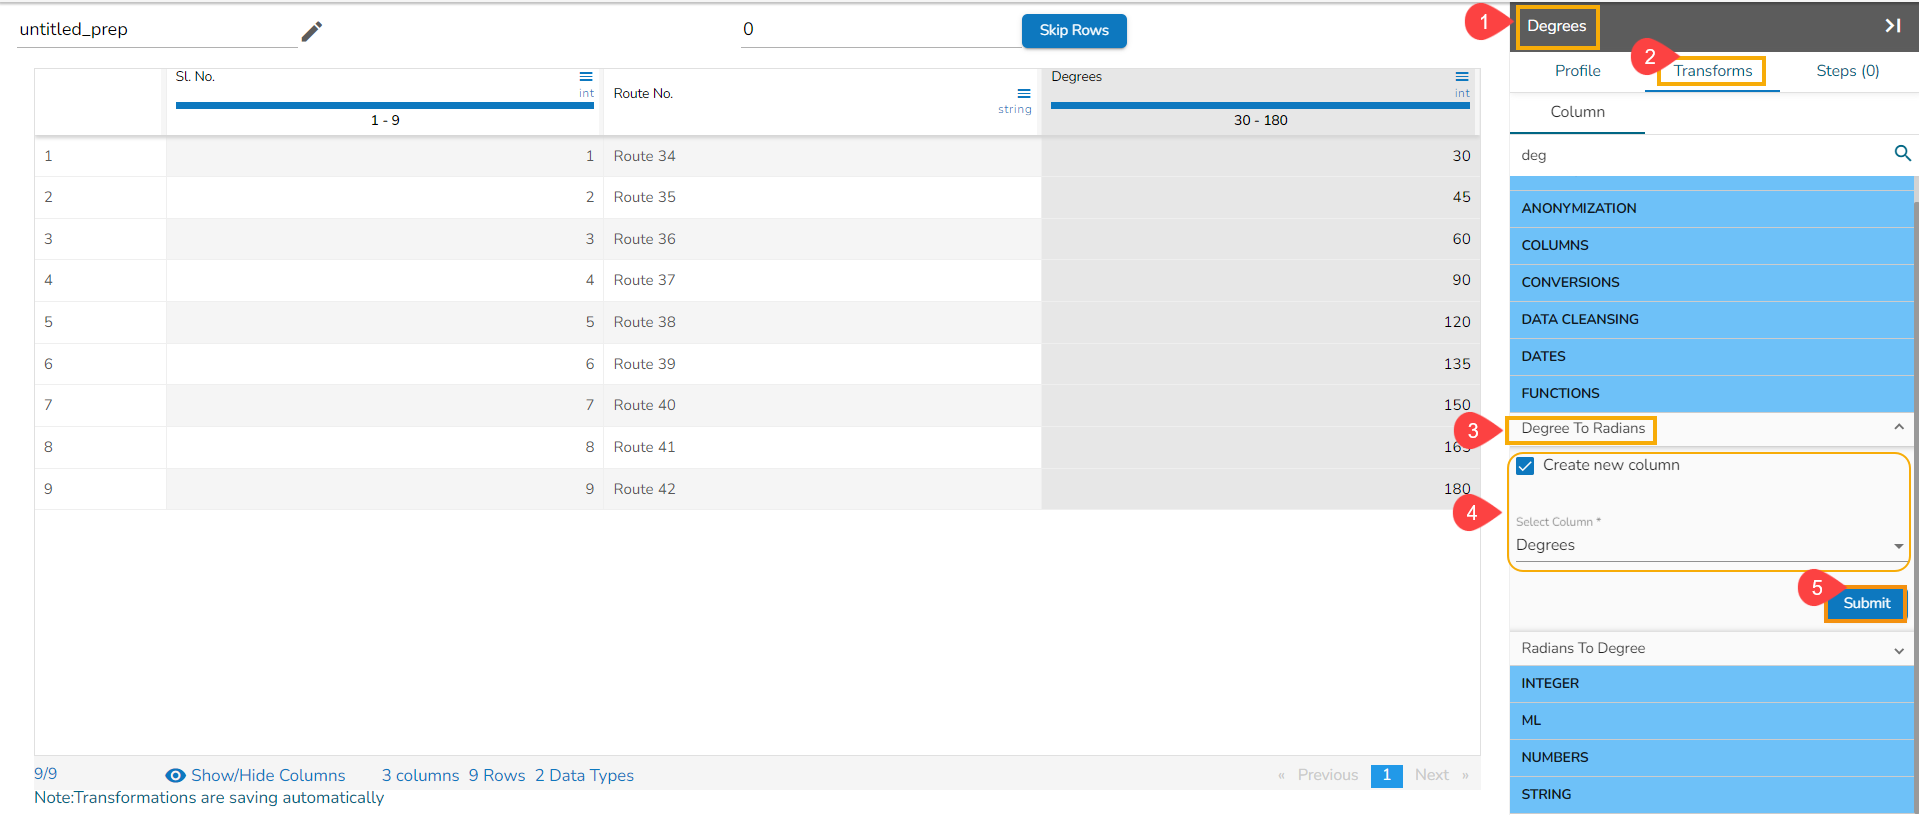
The result will come as a different column with a prefix of radians for the selected column by converting the source column values into radians.
Discretize Values
The Discretize values transform converts continuous data into discrete or distinct values or categories. This may be done for various purposes, such as simplifying data analysis, creating bins for histograms, or preparing data for certain machine-learning algorithms that work better with discrete inputs.
Check out the given illustration on how to use Discretize Values.
Steps to perform the transform:
Select a column.
Select the Discretize Values transform.
Update the number of bin size.
Click the Submit option.
The result will be displayed in a new column.
E.g., 1,2,3,4,5,6,7,8,9,10 num of bins : 3 the data gets displayed in the result column like - 0,0,0,0,1,1,1,2,2,2
Distance Between Geo Points
This transform computes the distance between a point column and another point. The computation outputs a number of distance units (kilometers, miles) in another column.
Check out the given illustration on how to use Distance Between Geo Points.
Steps to perform the transform:
Select a dataset which contains 2 latitude & longitude respectively.
Select the transform.
Pass the respective fields with latitudes & longitudes
Update the unit in which the result is required (km/miles)
Pass New column name
Click the Submit option.
The result will come as new columns with the name passed in the units which is required.
Latitude1
Longitude1
Latitude2
Longitude2
Result_in_km
Result_in_miles
1.601554
42.546245
63.588753
-154.493062
8026.14457
4992.561757
Exact
The Exact data transform refers to a data transformation technique that involves exact matching of data records or values. In this context, the transformation could involve comparing data across multiple columns within the same dataset to find exact matches between specific fields. This could be useful for data deduplication or data integration tasks.
Check out the given walk-through on how to use the Exact transform.
Steps to perform the Exact transformation:
Select a URL-based column having query parameters in it.
Open the Transforms tab.
Click the Exact transform from the FUNCTIONS category.
Provide the following information:
Select Column 1 using the drop-down option.
Select another column using the another drop-down option.
Provide a name for the new column that gets added with the result values.
Enable the Ignore case checkbox to ignore the case.
Click the Submit option.
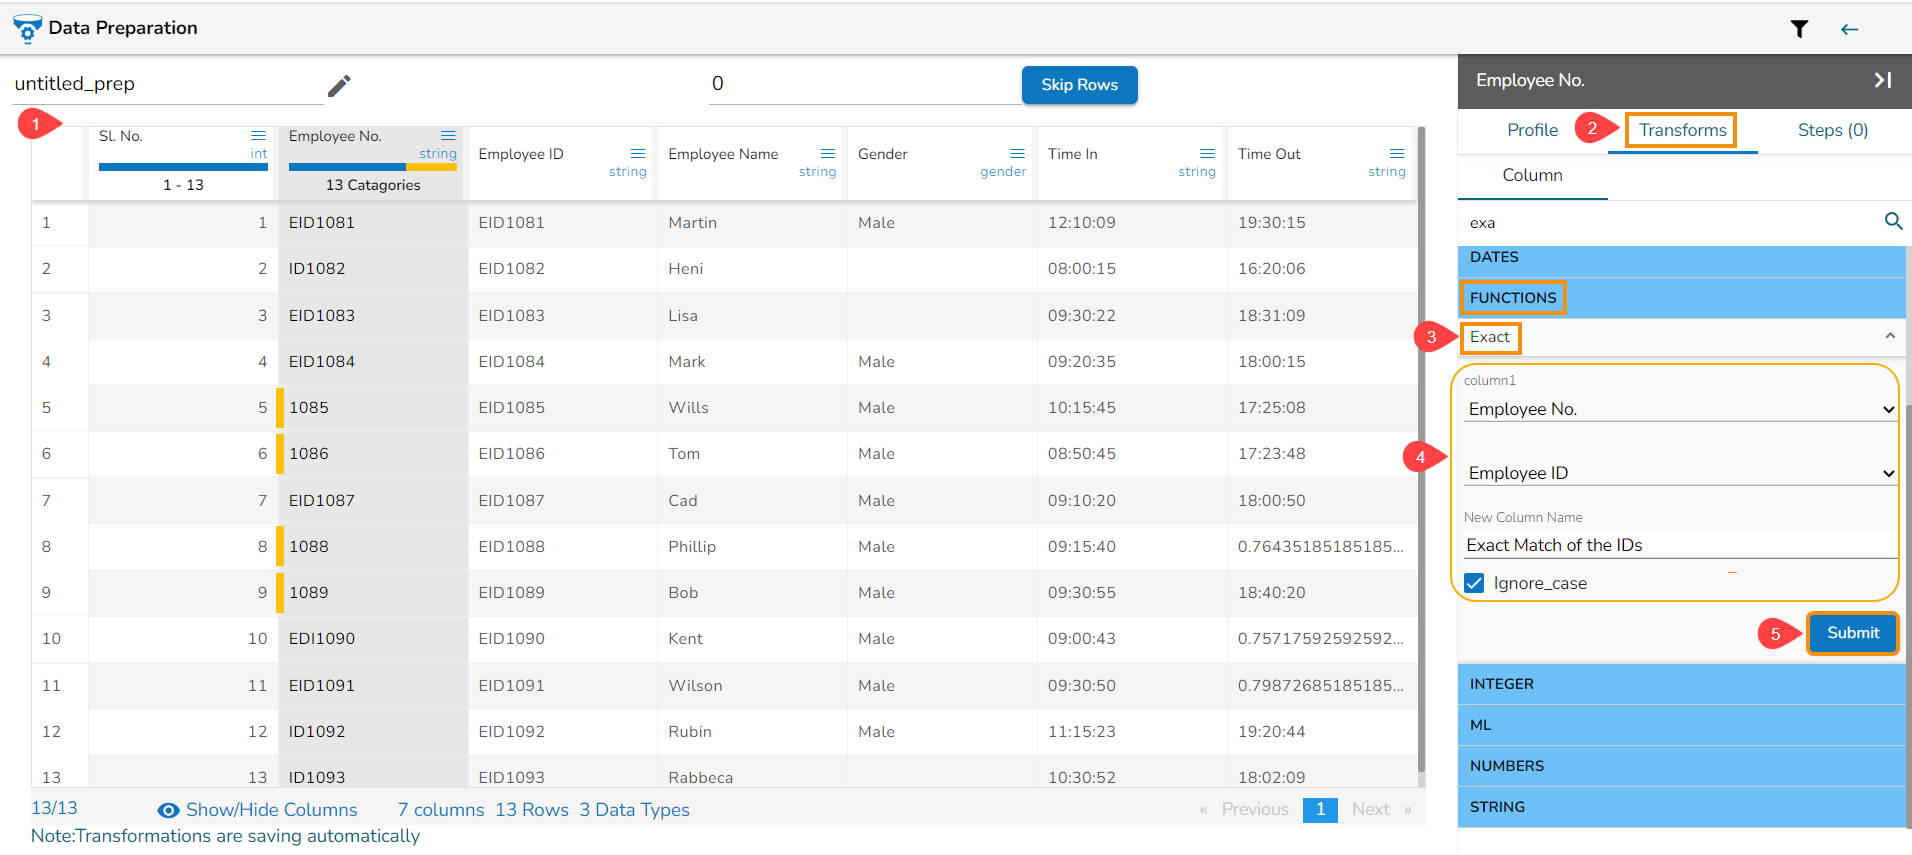
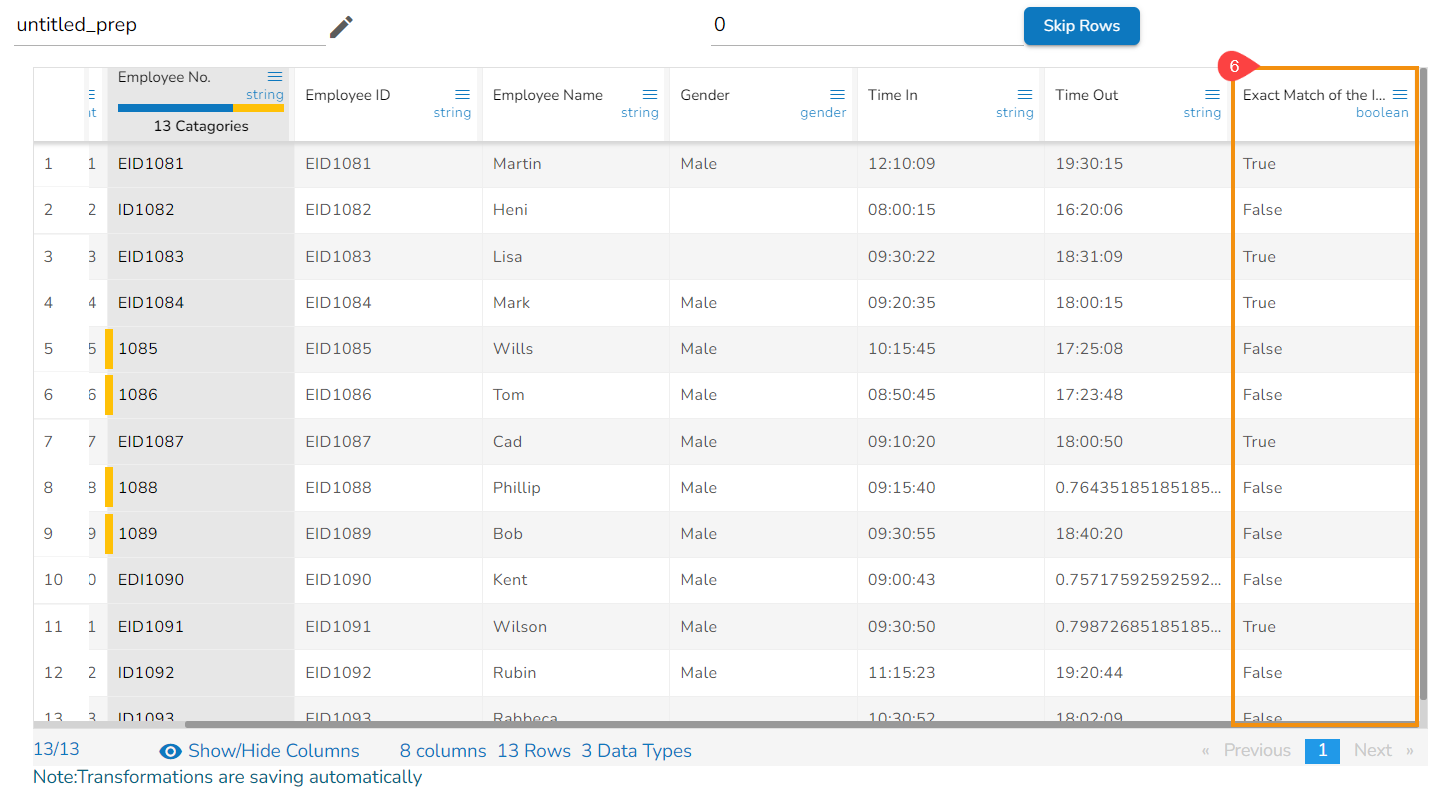
The result column gets added to the dataset reflecting either True or False values after matching data values from the selected columns.
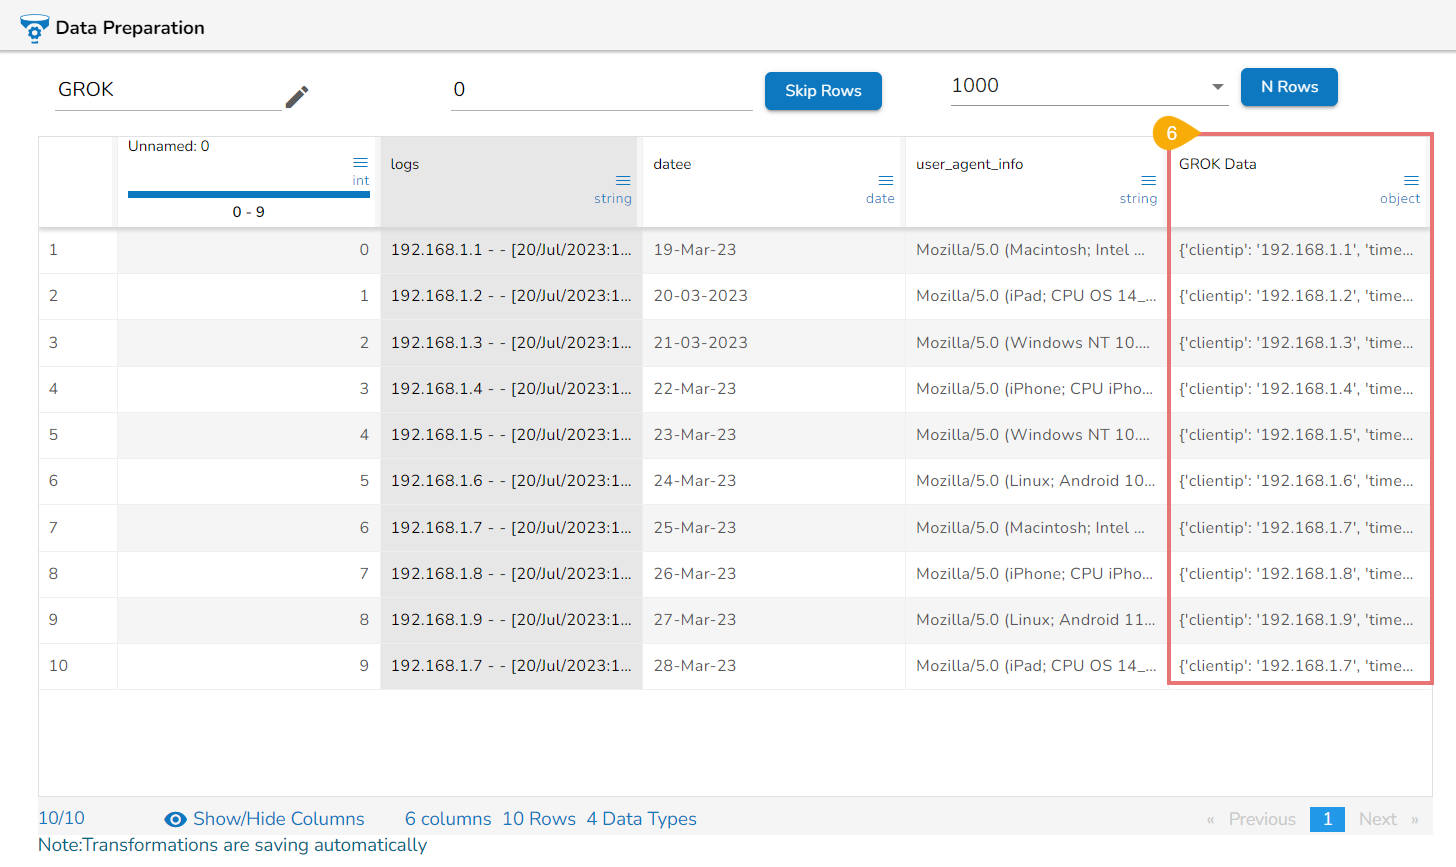
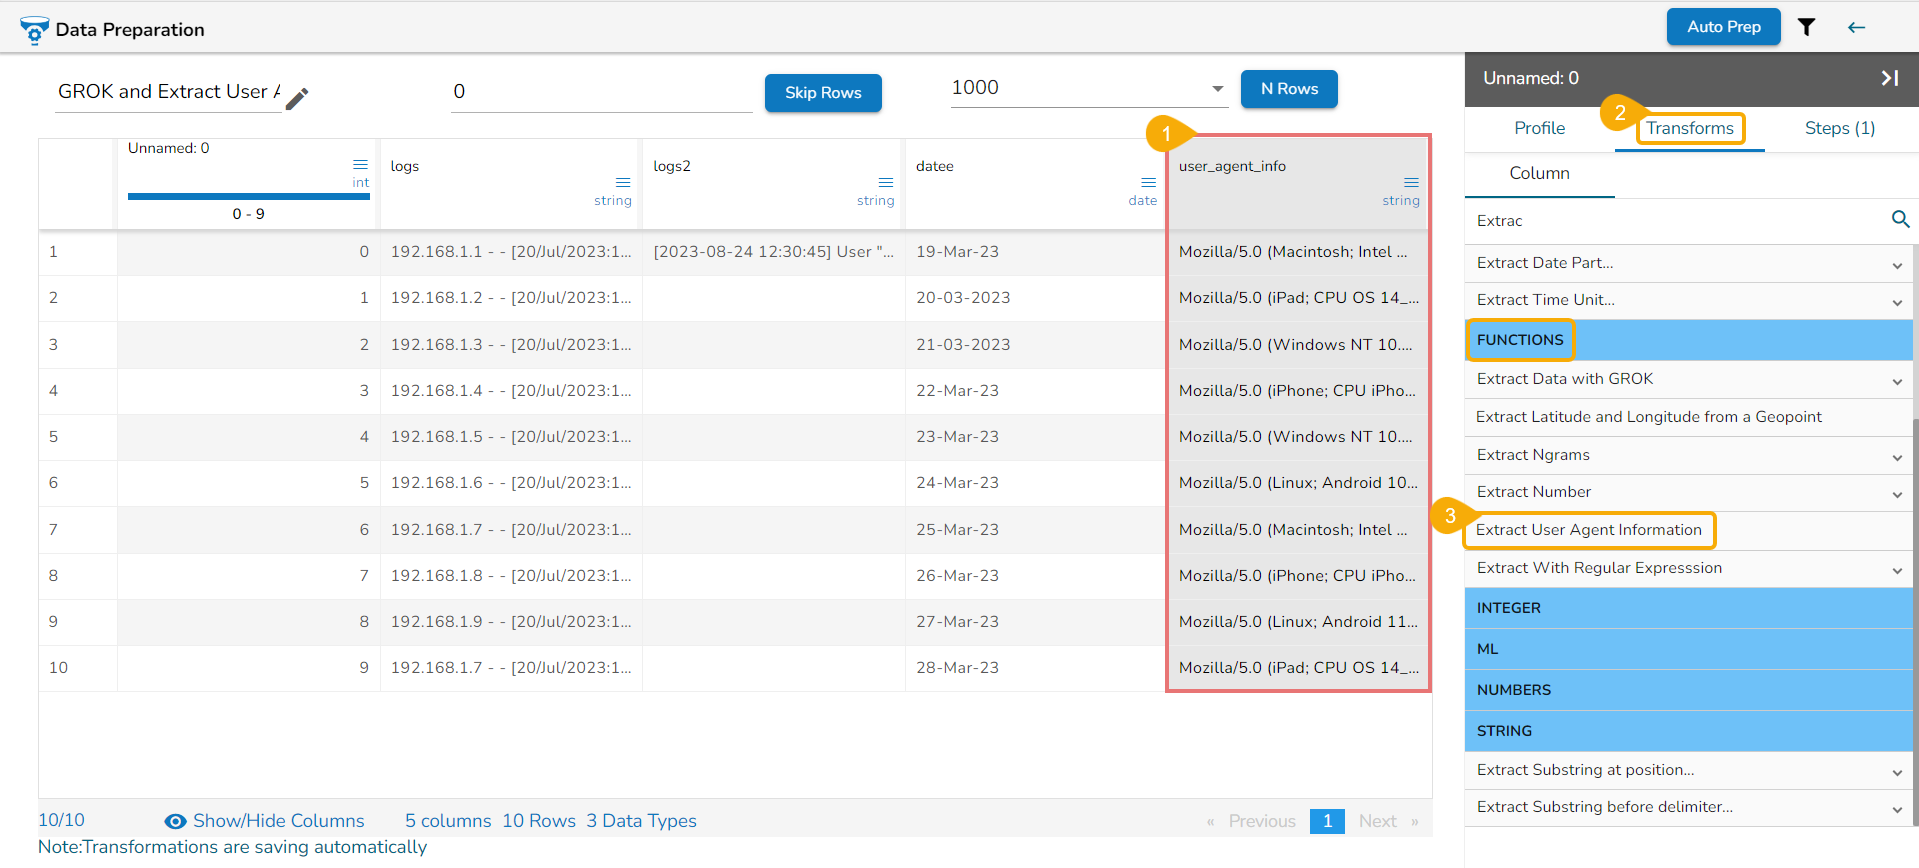
Extract Data with GROK
This transform extracts parts from a column using GROK patterns and/or a set of regular expressions. The chunks to extract are delimited using named captures.
Check out the given video on how to use the GROK transform.
Steps to perform transform:
Select the required column.
Open the Transforms tab.
Select the Extract Data with GROK transform.
Pass the New column name.
Pattern Used: %{IPORHOST:clientip} - - \[%{HTTPDATE:timestamp}\] "%{WORD:method} %{URIPATHPARAM:request} HTTP/%{NUMBER:httpversion}" %{NUMBER:response}
Pass the GROK pattern.
Click the Submit option.
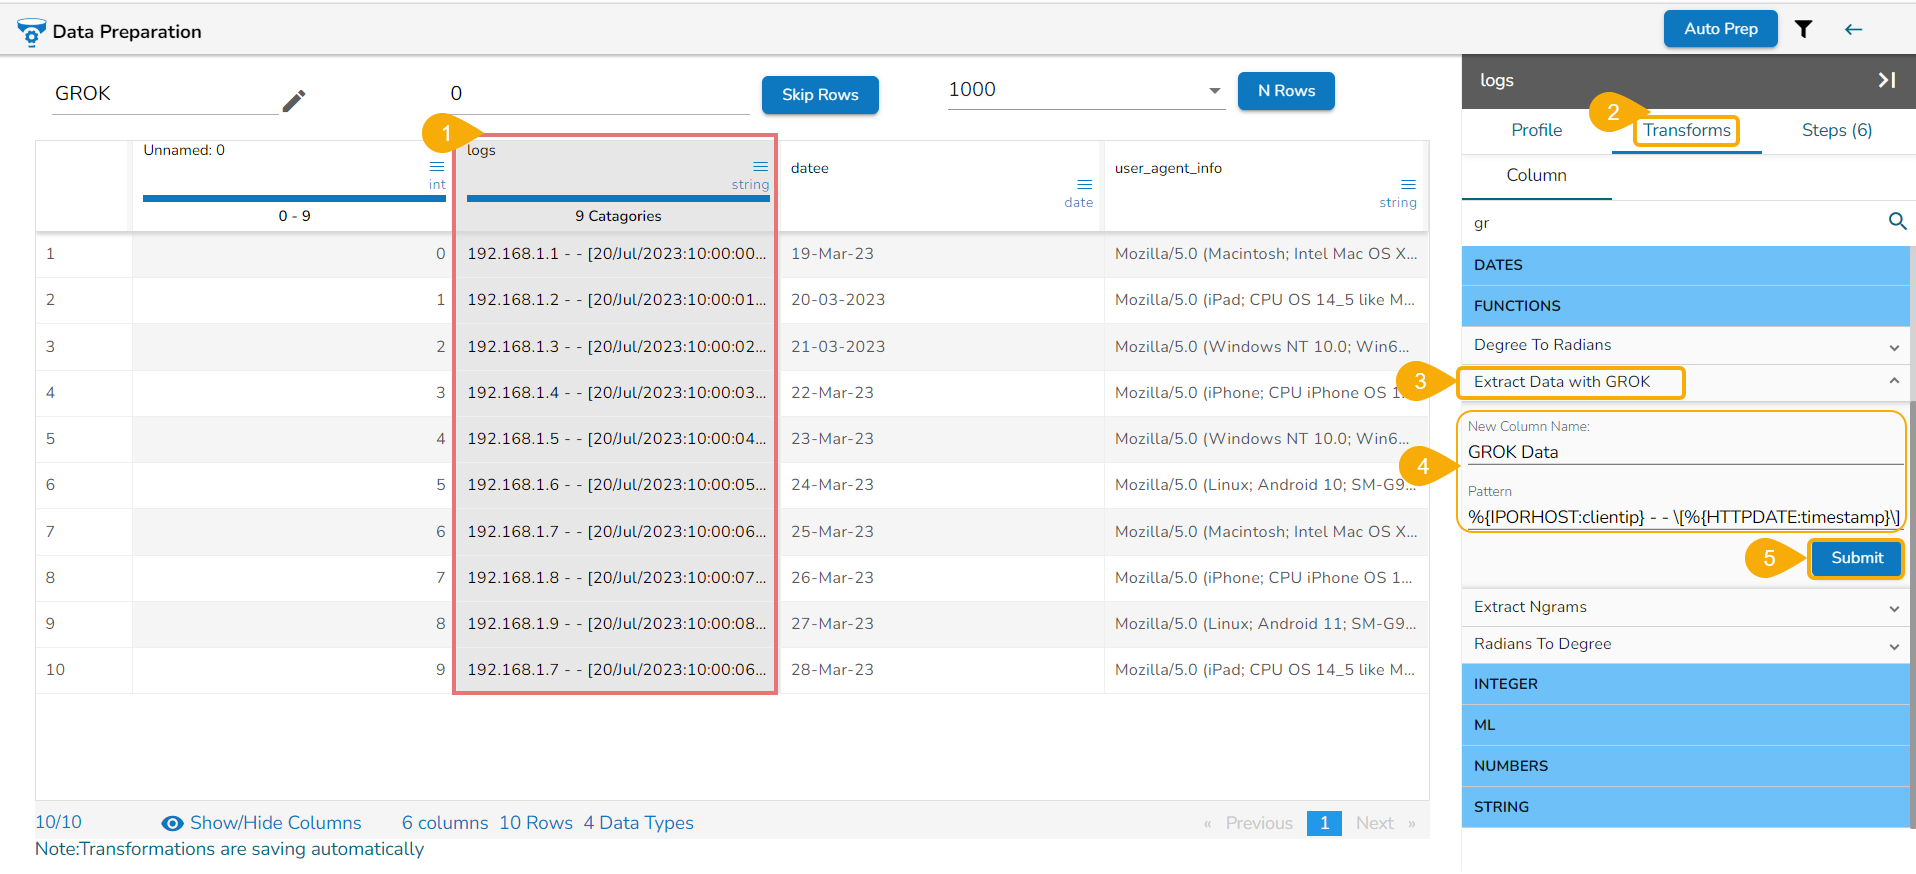
The result will come as a new column with the given name.
E.g, if a column has data like 192.168.1.1 - - [20/Jul/2023:10:00:00 +0000] "GET /index.html HTTP/1.1" 200
The Output after applying the Extract Data with GROK will come as: {'clientip': '192.168.1.1', 'timestamp': '20/Jul/2023:10:00:00 +0000', 'method': 'GET', 'request': '/index.html', 'httpversion': '1.1', 'response': '200'}
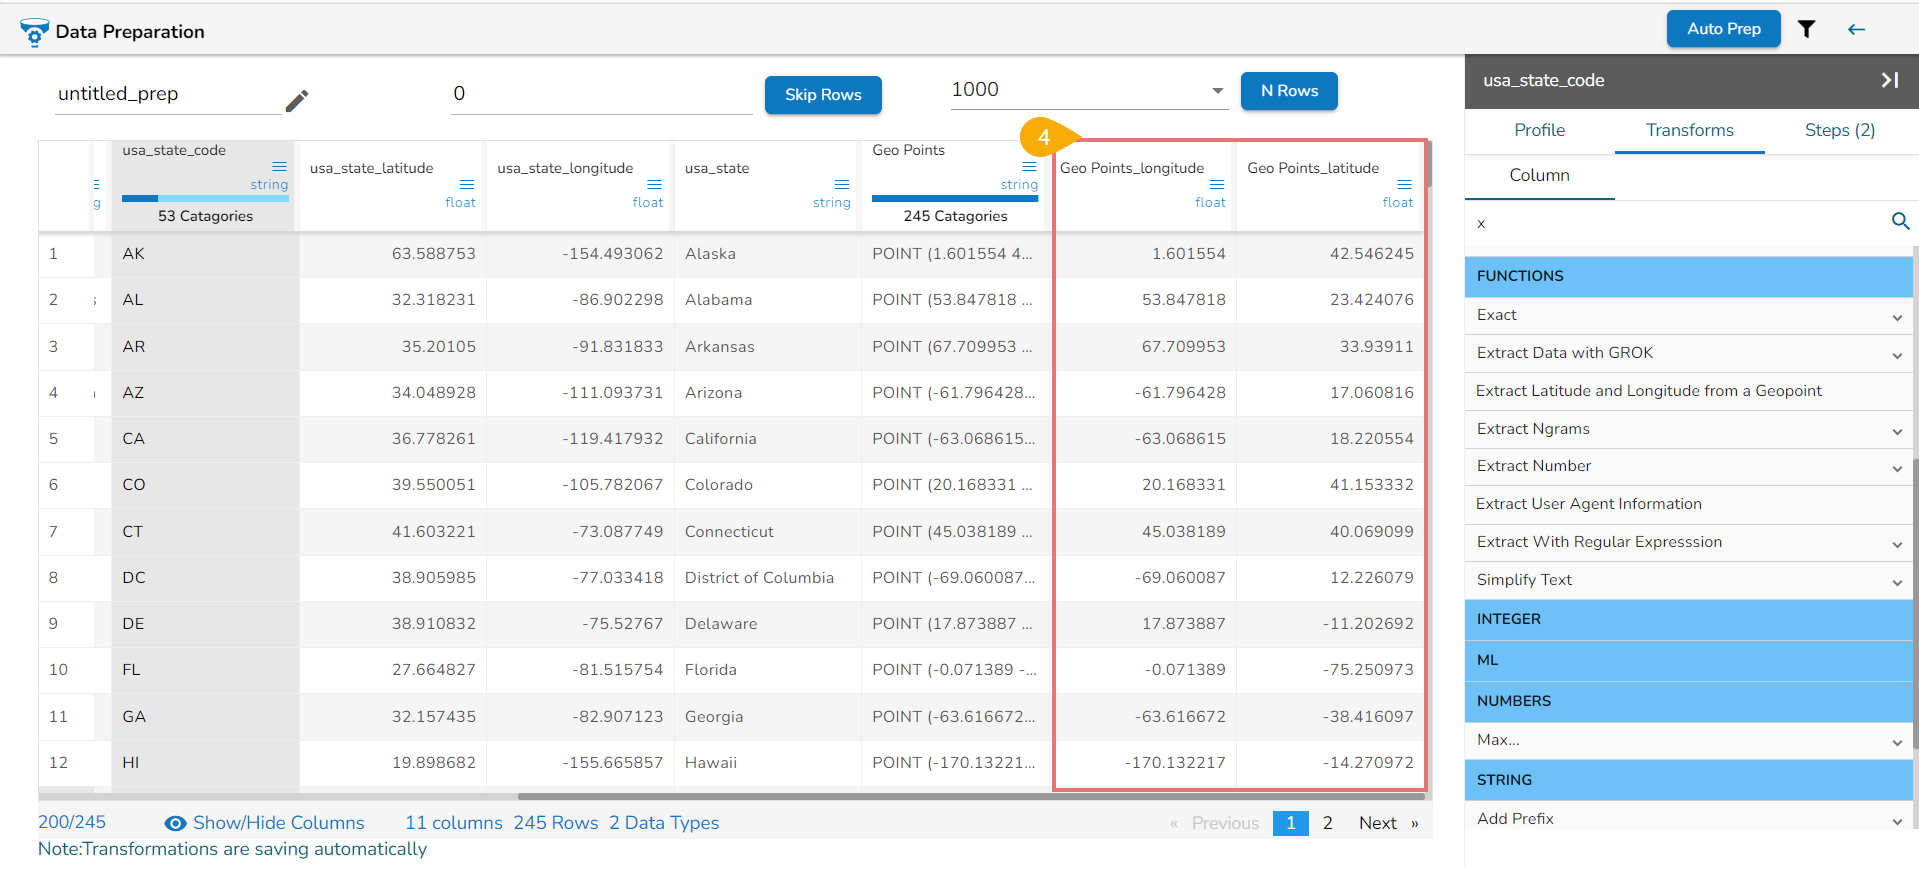
Extract Latitude and Longitude from a Geopoint
This transform extracts two latitude and longitude columns from a column in Geo point format. Geo point is a data meaning representing a point on Earth.
Check out the given walk-through on how to extract the Longitude and Latitude columns from the Geo point data.
Steps to perform the transform:
Select a dataset that contains a geo point column.
Open the Transforms tab.
Select the transform.
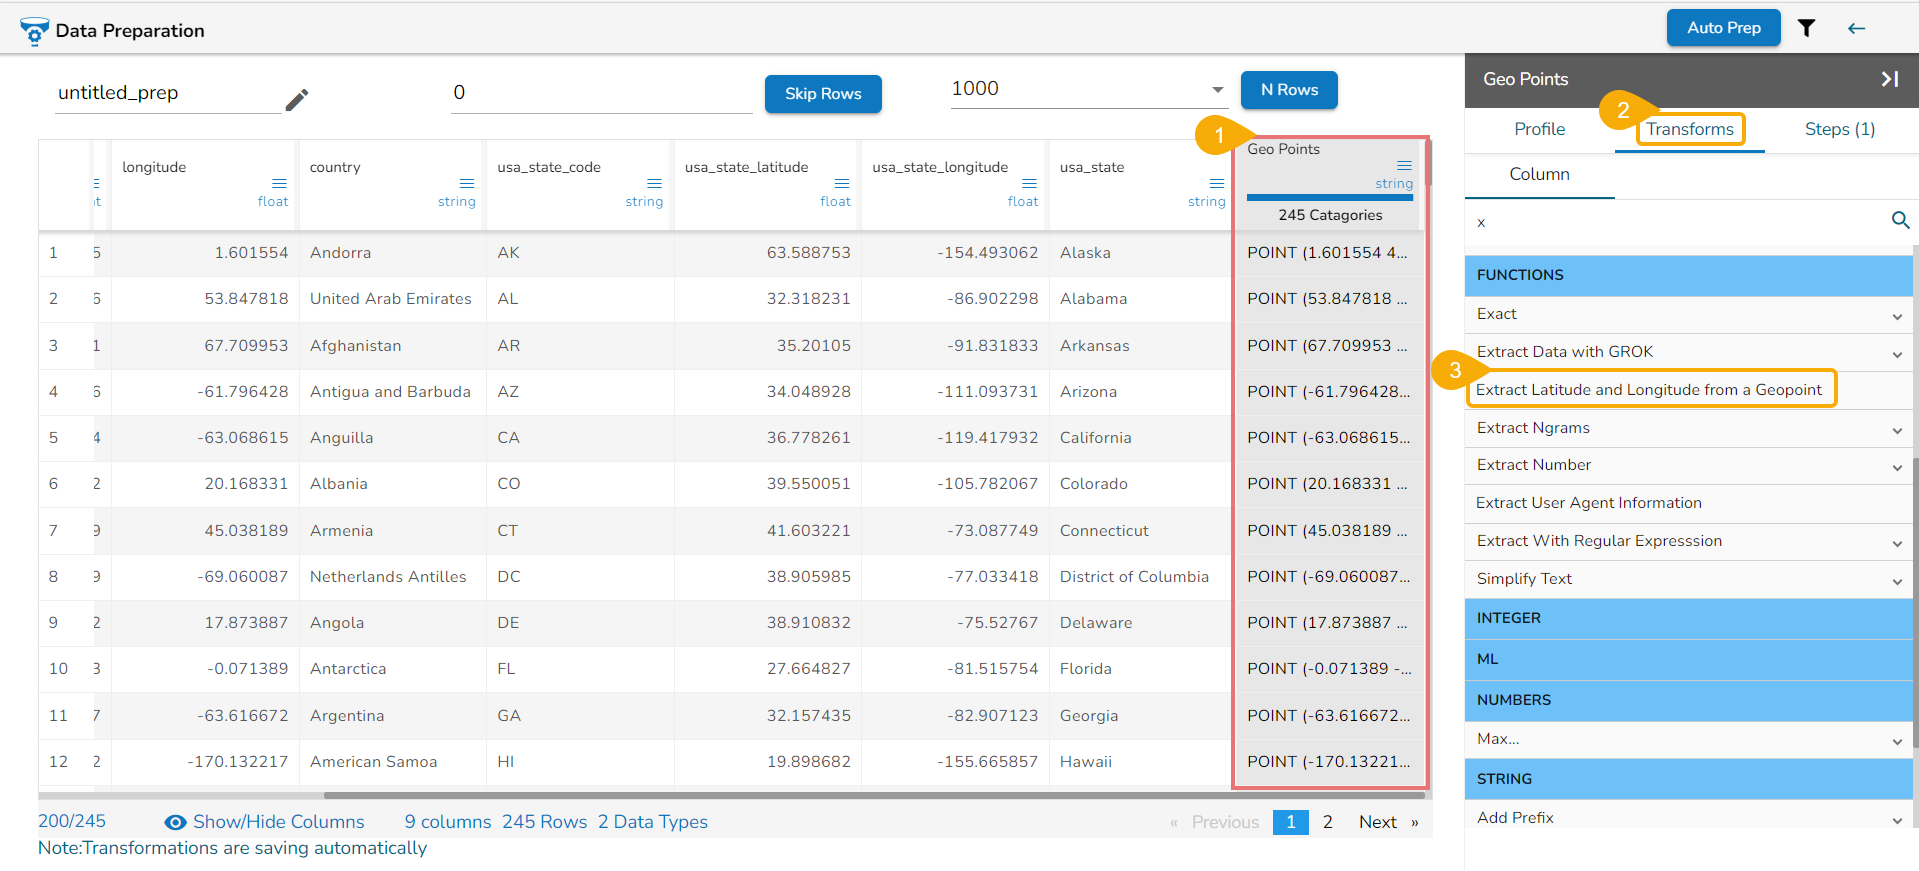
The result will come in two new columns with the actual name mentioned as a prefix:
Extract Ngrams
N-grams are contiguous sequences of n items from a given sample of text or speech. This transform extracts sequences of words, called N-grams, from a text column.
Check out the given illustration on how to use Extract Ngrams transform.
Steps to perform the transform:
Select one text column with string data.
Open the Transforms tab.
Select the transform.
Provide a name for the new column for the output.
Set a number to indicate the Size for the Ngrams.
Click the Submit icon.
The result will be displayed in a new column based on the defined size. E.g., the following image displays Ngrams with size 2.
Extract Number
The Extract Number data transform is a data preparation technique used to extract numbers from a column that includes a combination of text and number as data points.
Steps to perform the Extract Number transform:
Select a column that contains text and number together as data points in it.
Open the Transforms tab.
Click the Extract Number transform from the FUNCTIONS category.
Provide a new column name.
Click the Submit option.
A new column gets added to the dataset with the extracted numbers from the concerned column.
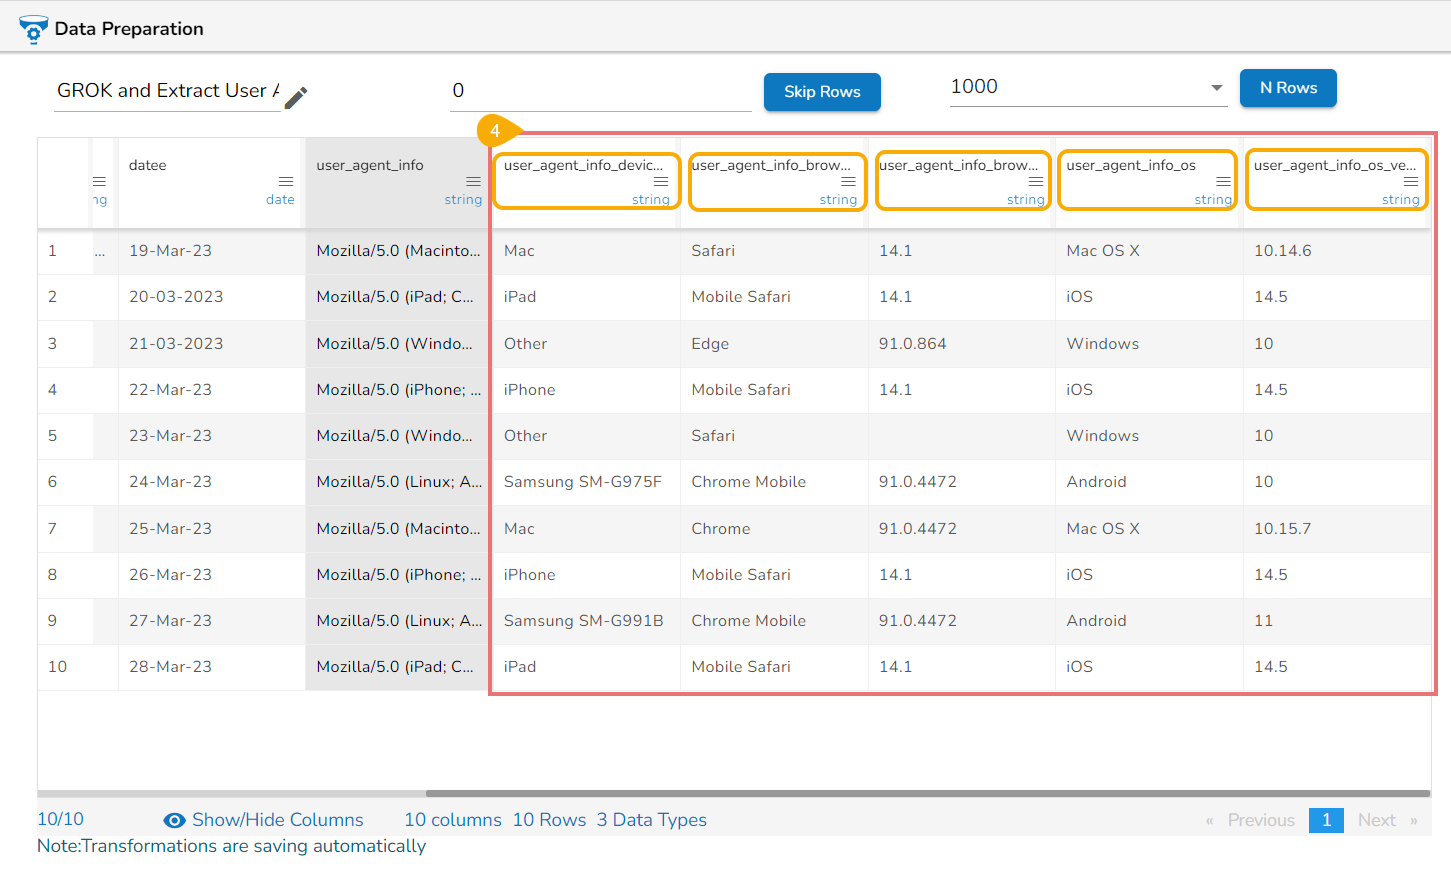
Extract User Agent Information
This transform parses and extracts information from a browser’s User-Agent string.
Check out the given illustration on how to use the Extract User Agent Information transform.
Steps to perform the Extract User Agent Information transform:
Select a column containing details of a browser user-user string data.
Open the Transforms tab.
Click the Extract User Agent Information transform.
The information about the user can be extracted in the separate columns with the following suffix added to the column names:
device_family
browser_family
browser_version
os
os_version
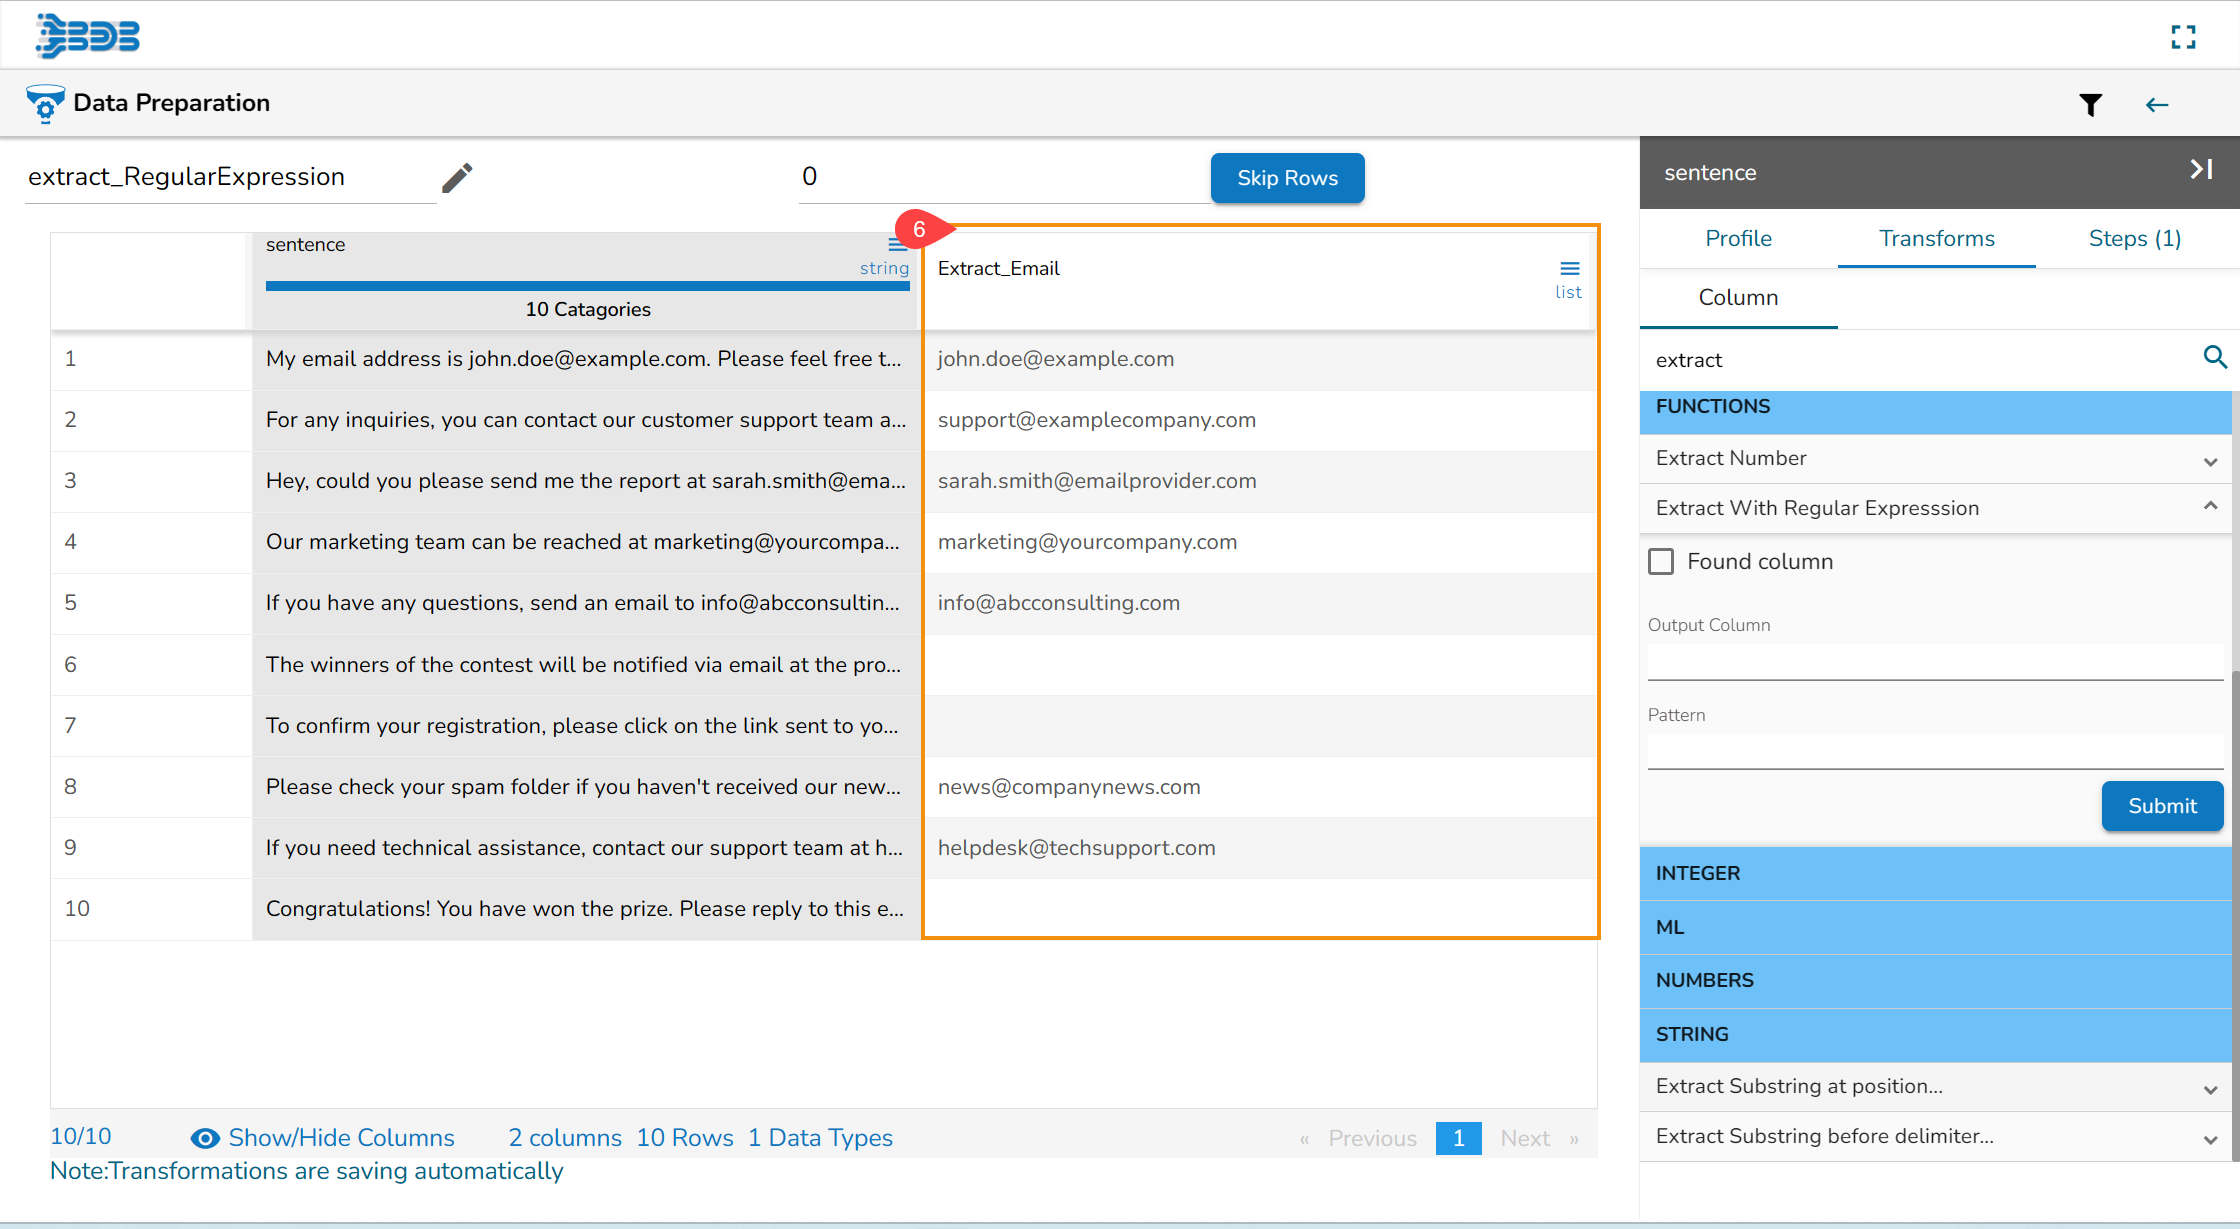
Extract with Regular Expression
The Extract with Regular Expression data transform, also known as Extract with regex is a powerful technique used to extract specific patterns or substrings from textual data using regular expressions. Regular expressions (regex) are sequences of characters that define a search pattern. They are particularly useful for searching, matching, and extracting specific patterns from strings.
Check out the given walk-through on how to use Extract with Regular Expression.
Select a textual column within the Data Preparation framework.
Open the Transforms tab.
Open the Extract with Regular Expression transform from the FUNCTIONS category.
Provide the following information:
Enable the Found Column option.
Provide the Pattern.
E.g., Suppose a text in a column is “Please contact [email protected] for assistance or [email protected] for inquiries.”
Pattern used: \b[A-Za-z0-9._%+-]+@[A-Za-z0-9.-]+\.[A-Z|a-z]{2,7}\b
Output as: ["[email protected]","[email protected]"]
Click the Submit option.
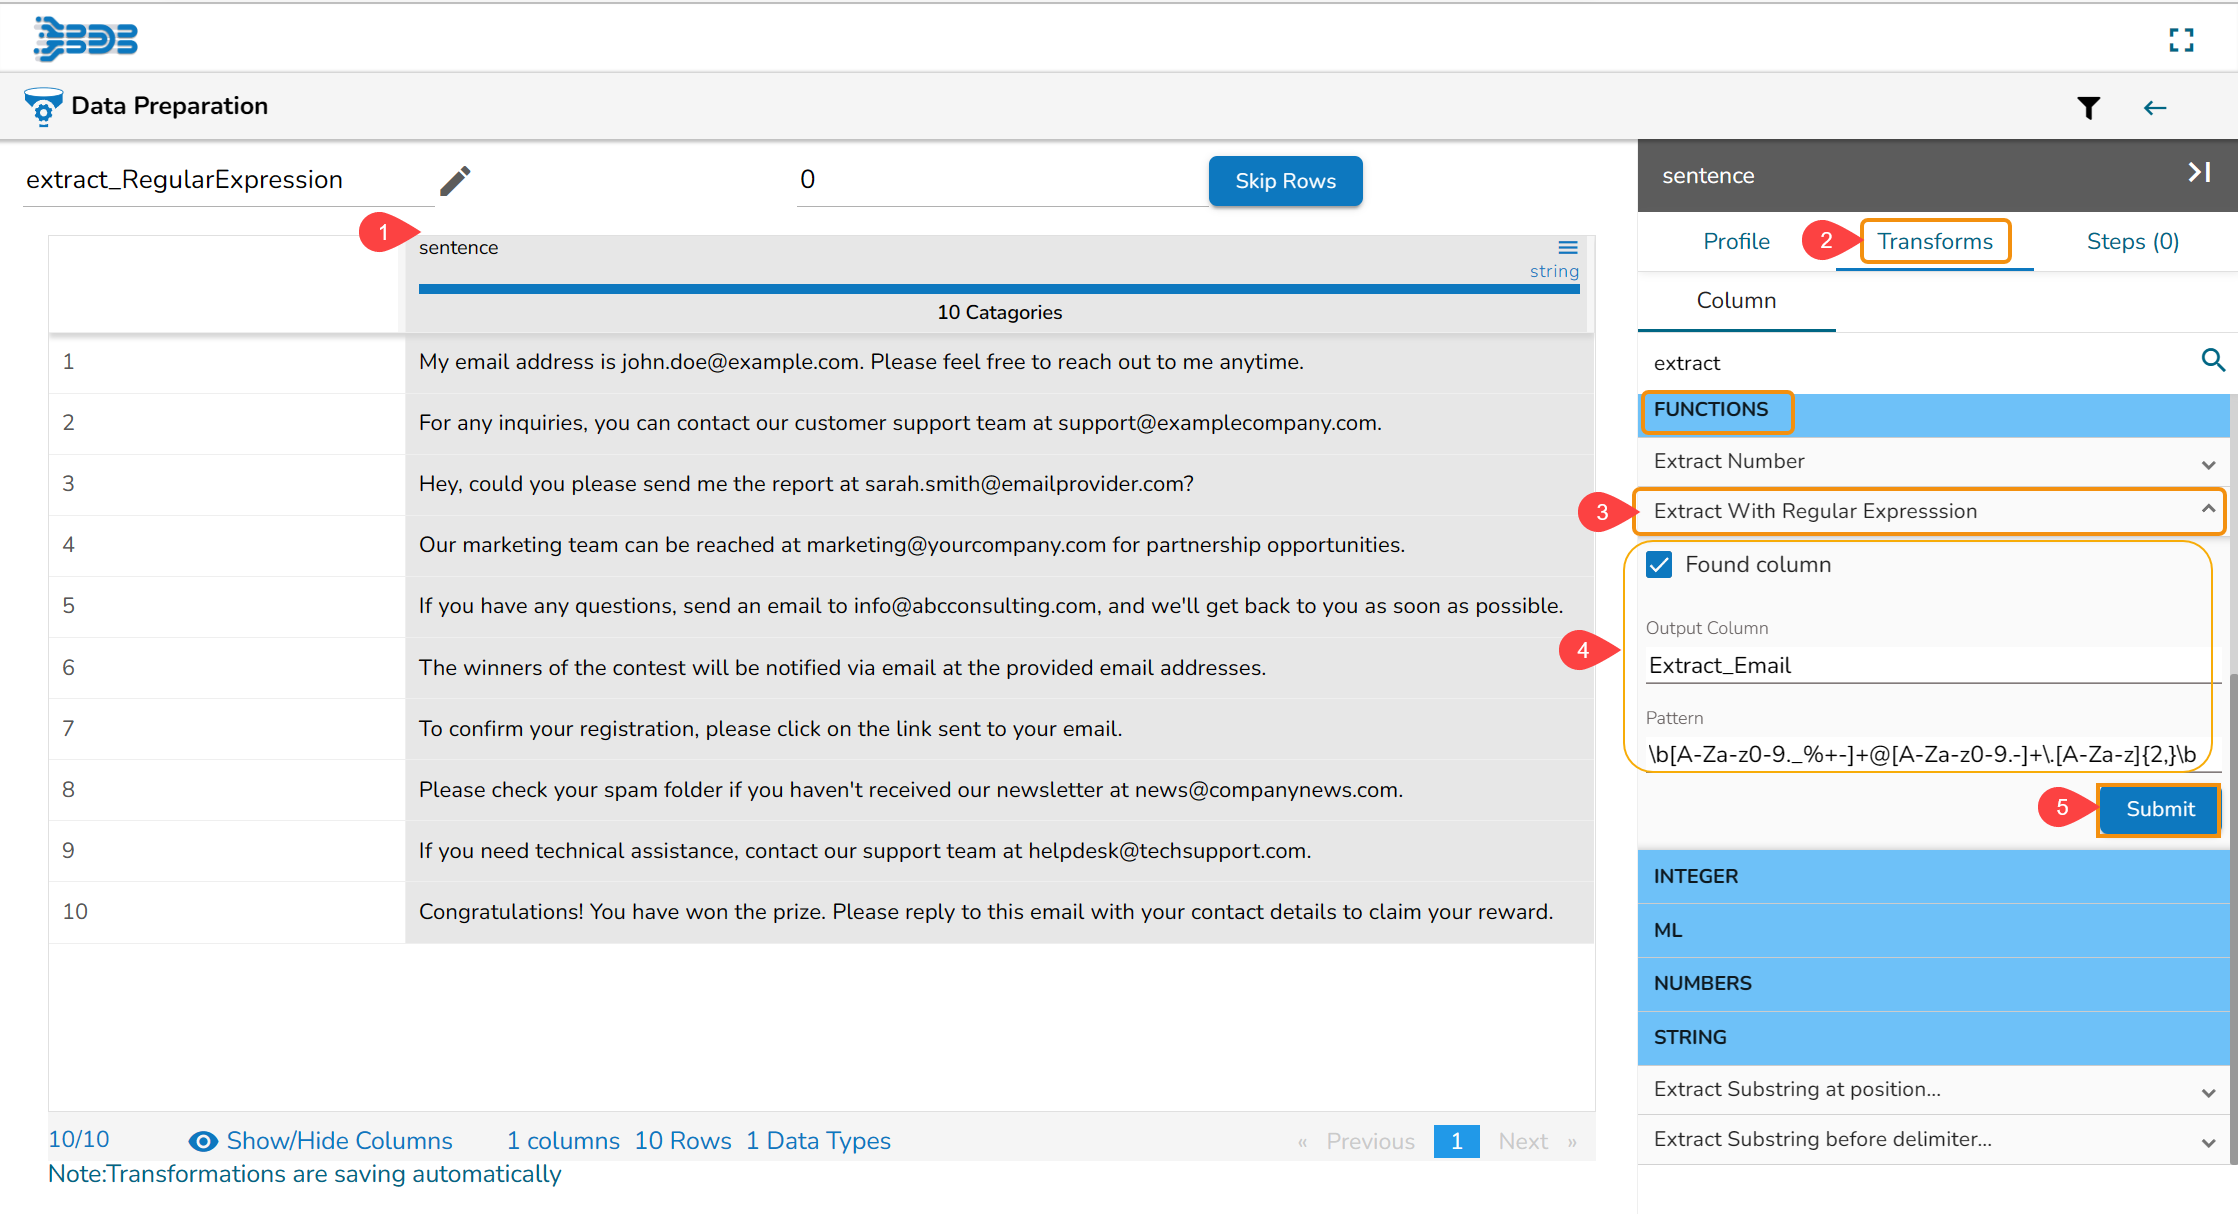
As a result, a new column gets added to the dataset with the extracted values.
Formula-based
A Formula-based transform typically refers to a data transformation or calculation using a formula describing the relationship between variables.
Select the Formula-based transform from the Functions transform section.

The Formula-Based Transformation window appears.
Select the required columns using the Select Columns drop-down option (This transform supports mathematical-based operations only, therefore select numeric columns).
All the selected columns will be listed below.
Double-click on the required columns from the list. They will be listed under the Formula field. Pass the necessary operation along with the selected columns to create a formula.
Provide a name to the new column.
Click the Submit option.

The result will be created as a new column on which the name passed with the formula result.

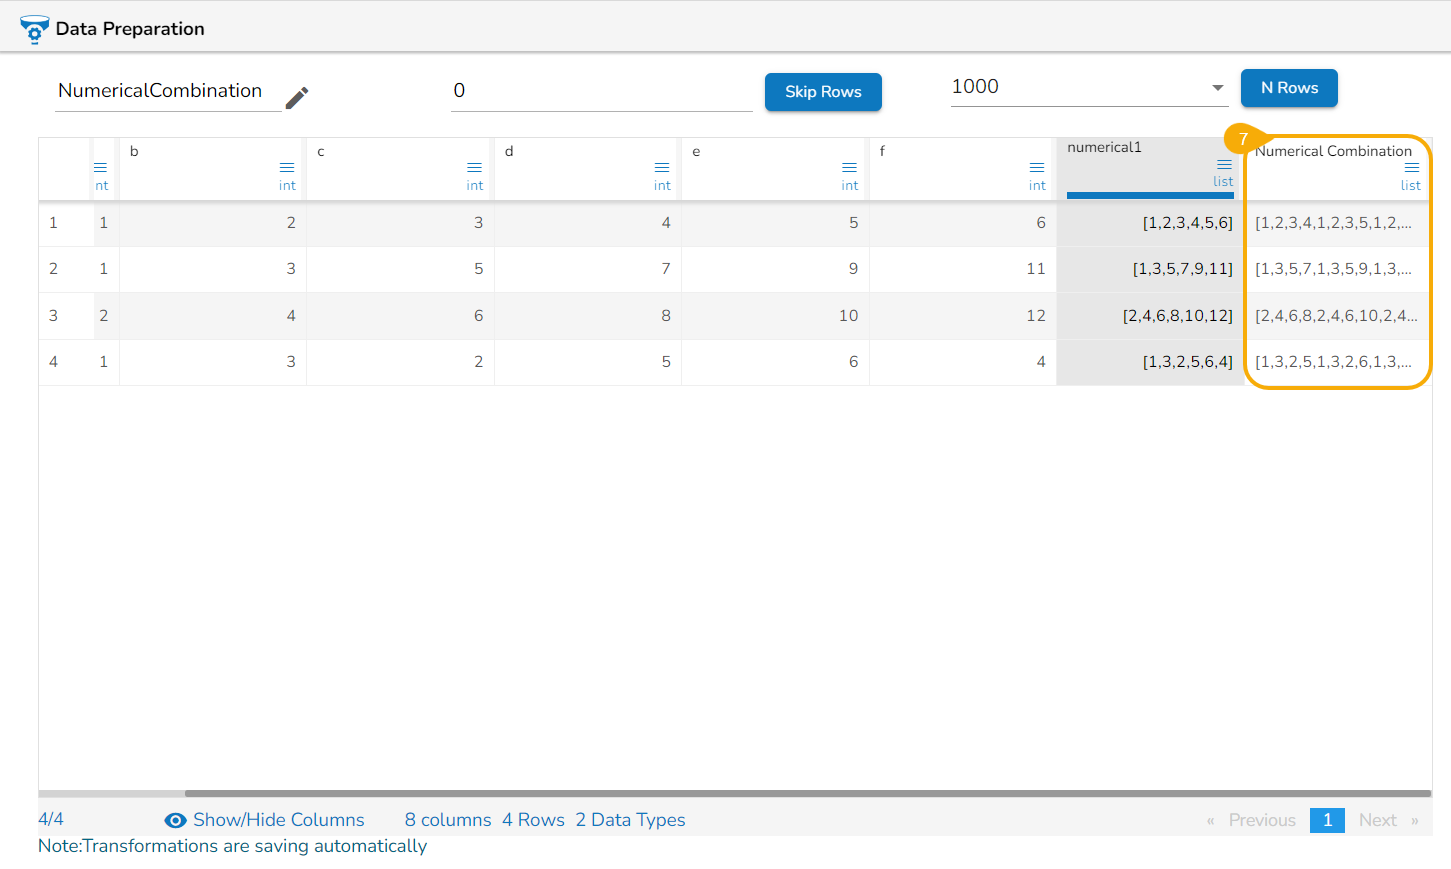
Generate Numerical Combination Transformation
The Generate Numerical Combination Transformation helps to find all the possible combinations of a set of numbers without repetition.
Select a Numerical column with multiple numerical values.
Open the Transforms tab.
Select the Transform.
Provide the name of the column containing the result values.
Set a number to define the combination length.
Click the Submit option.
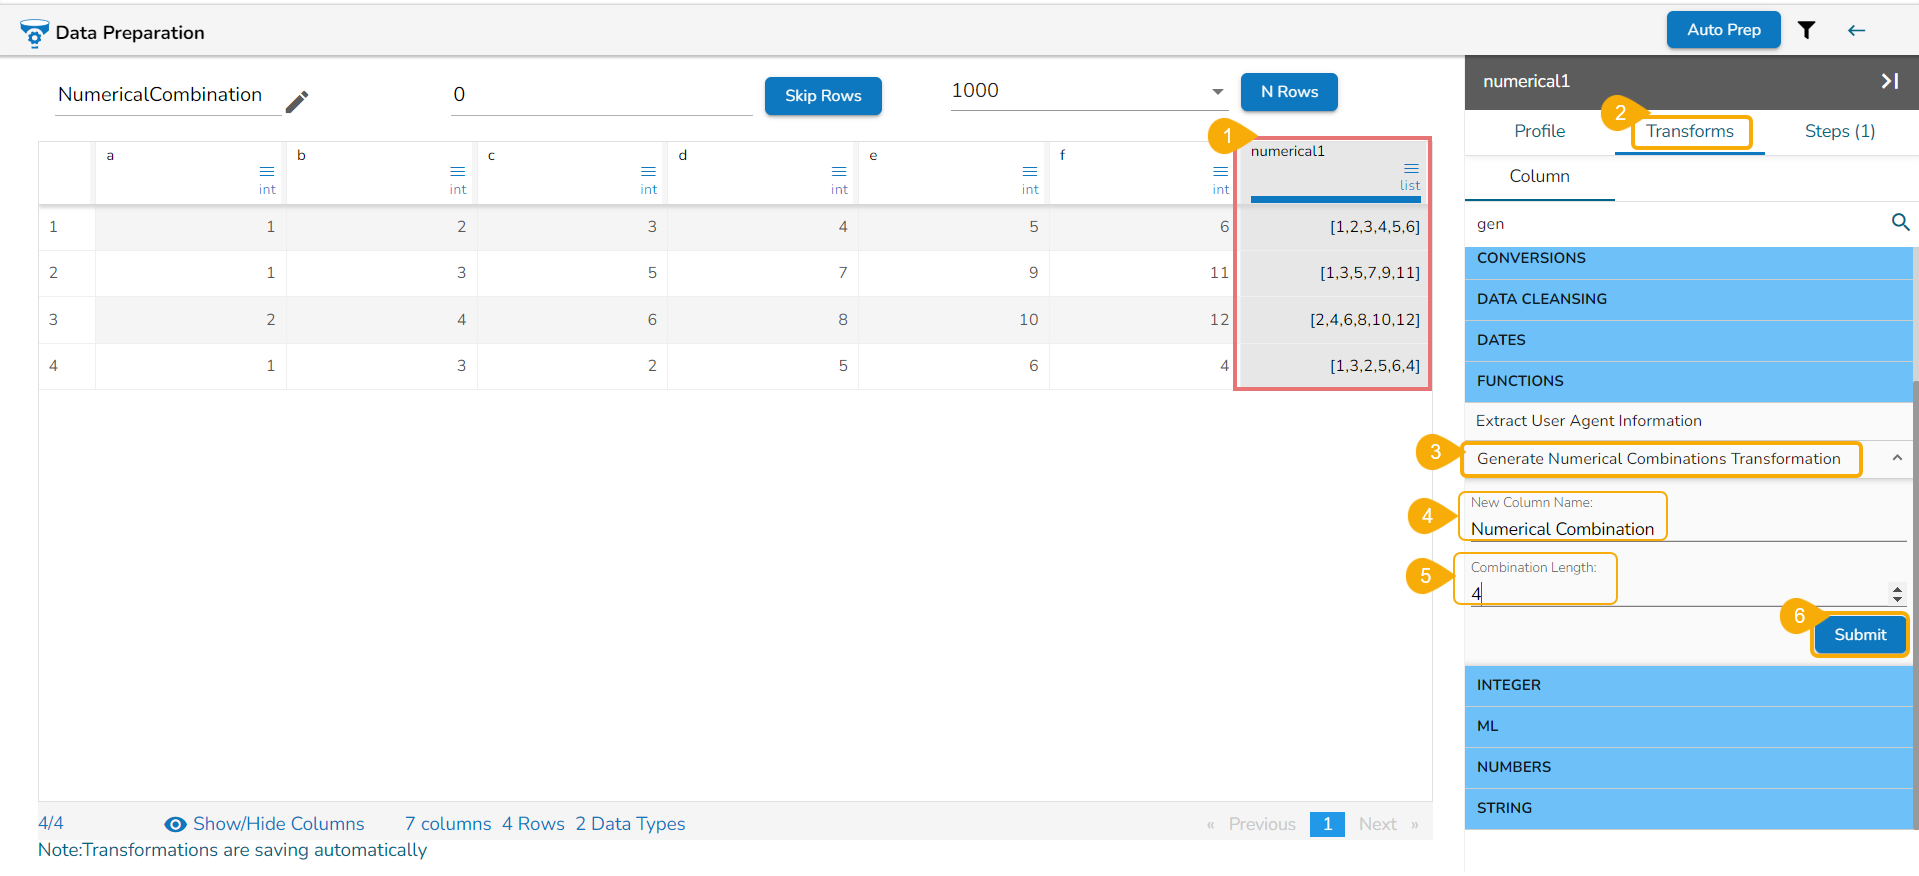
A new column is added as per the set combination length displaying the numerical values.
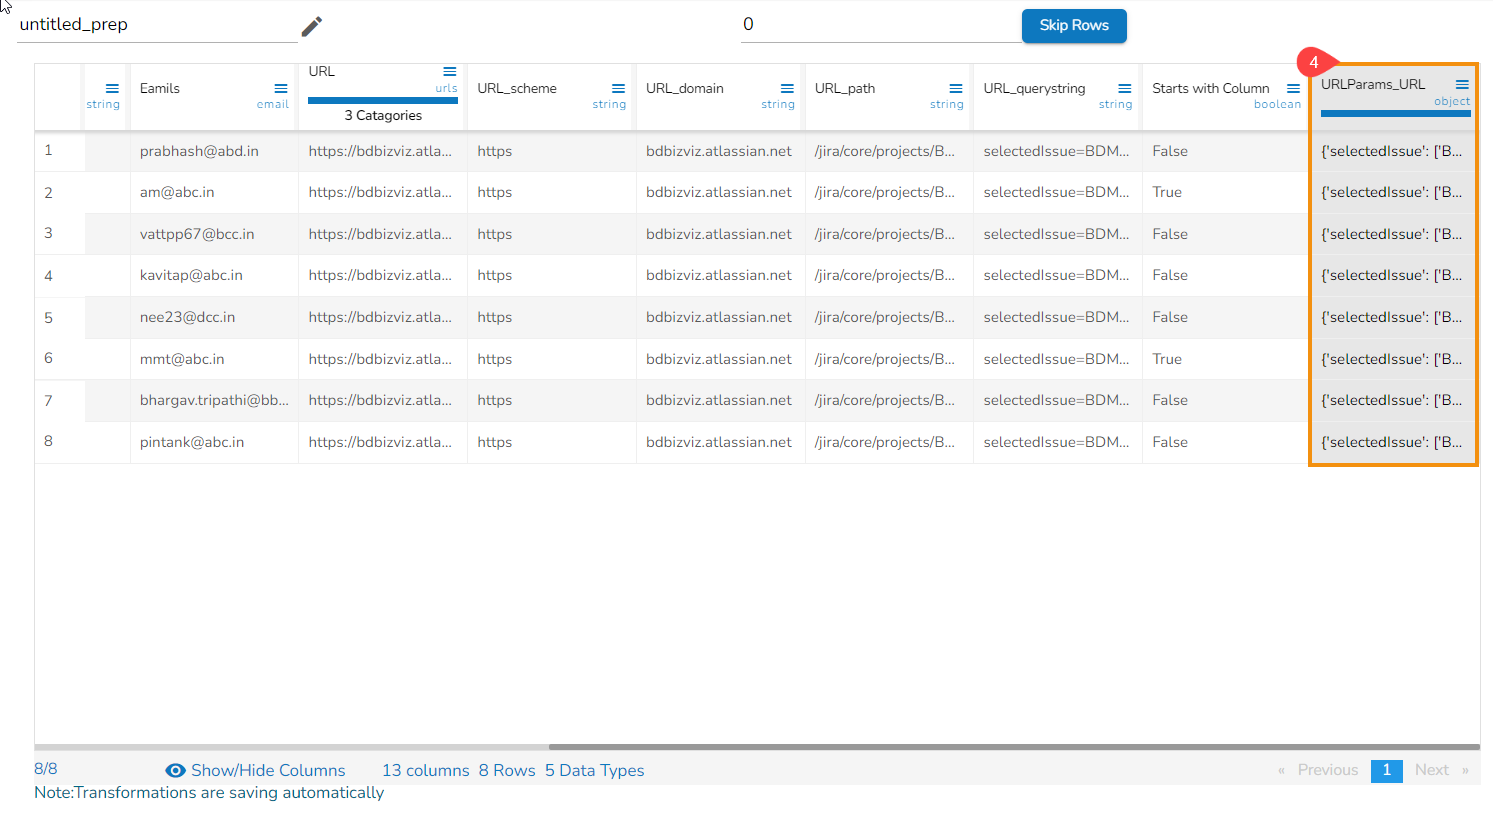
Get URL Parameters
This transform helps to extract the query parameters of a URL into an Object. The Object keys are the parameter's names, and their values are the parameter's values. Input values must be of URL or String type.
Check out the given illustration on how to use the Get URL Parameters data transform.
Steps to perform the transformation:
Select a URL-based column having query parameters in it.
Open the Transform tab.
Click the Get URL Parameters transform from the FUNCTIONS category.
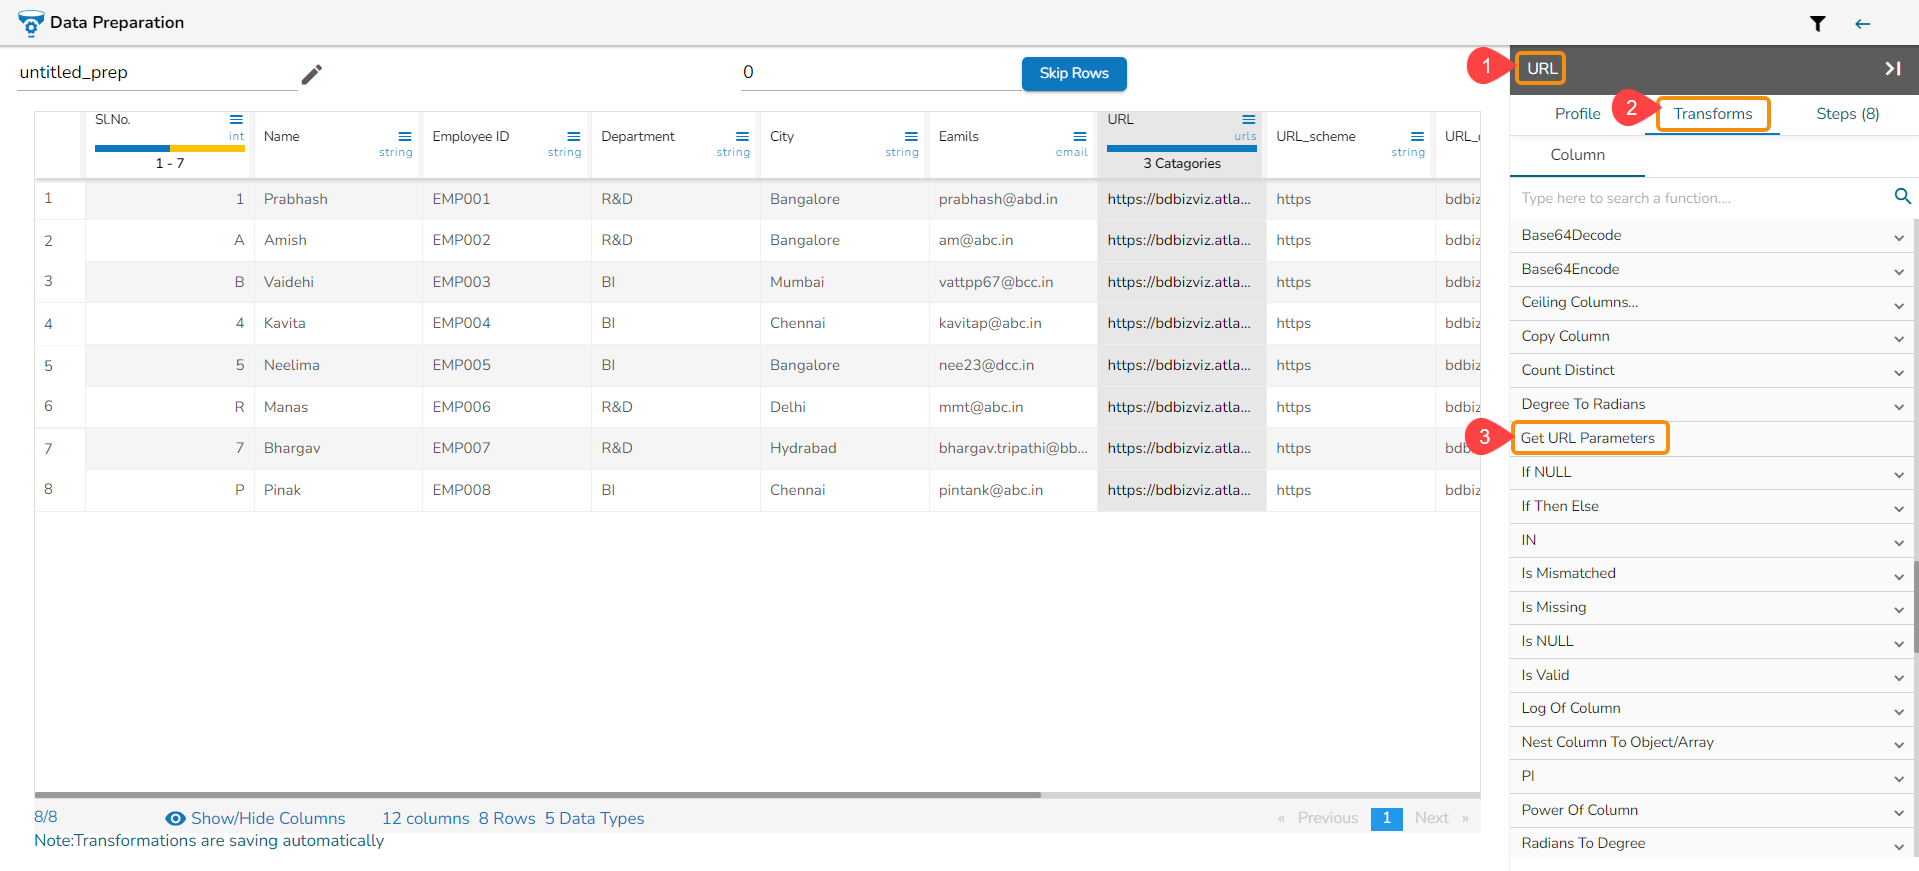
As a result, a new column gets added to the dataset with the extracted URL parameters.
Example: A Column having URL like:
http://example.com?color=blue;shape=square/;then result will be:{"color": "blue", "shape": "square"}
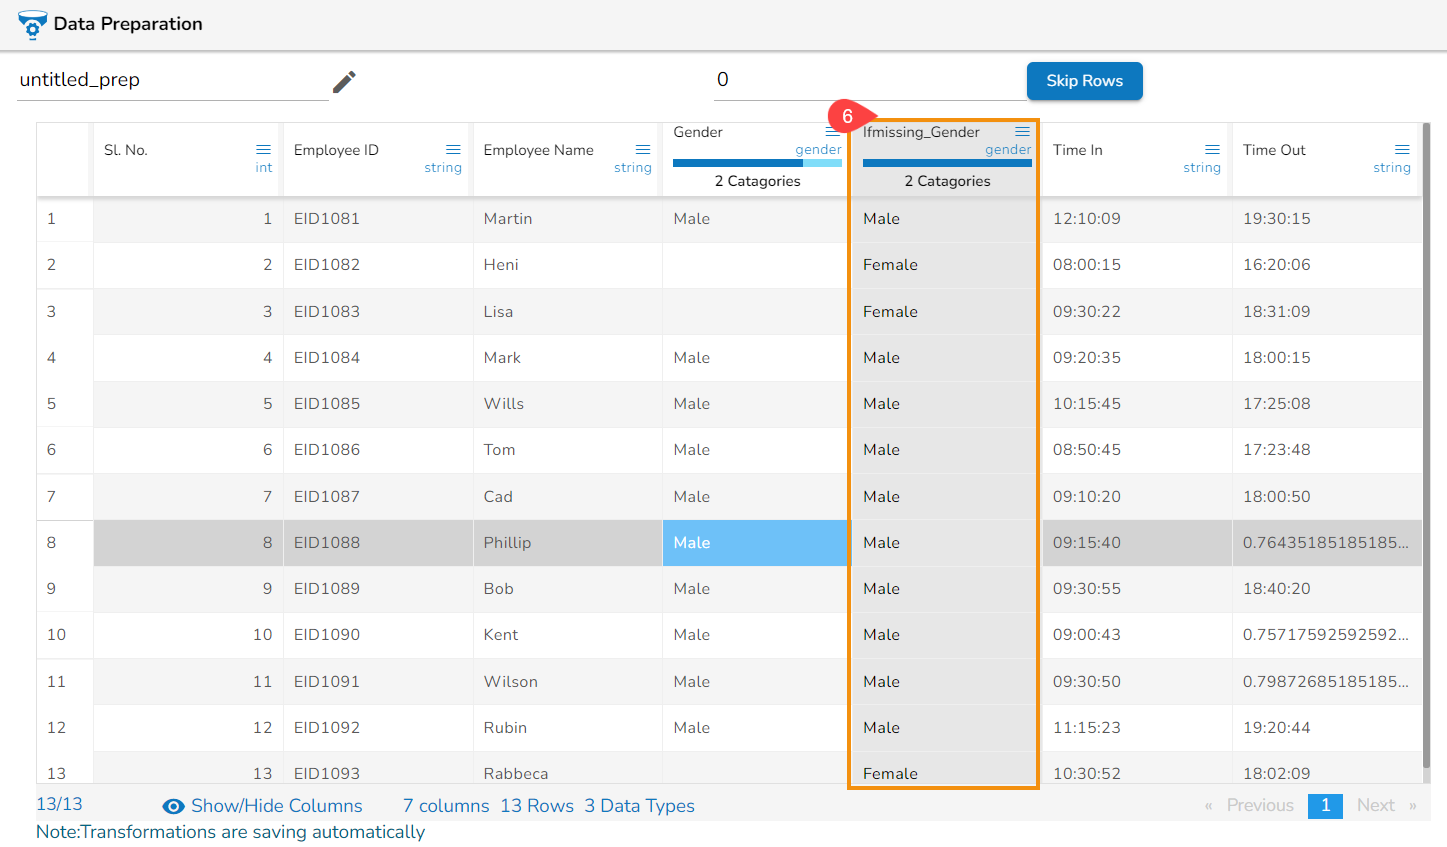
If Missing
The If Missing data transform likely refers to a data transformation technique used to handle missing values in a dataset. Dealing with missing data is a common challenge in data analysis and machine learning, and various strategies are employed to handle these missing values effectively.
The If Missing data transform can be understood as a conditional transformation that is applied to data points where specific features have missing values. The general idea is to specify a rule or condition to check if a data point is missing certain values, and then apply a transformation based on that condition.
Check out the given walk-through on how to use the If Missing transform.
Steps to apply the If Missing transform:
Open a dataset within the Data Preparation framework.
Open the Transforms tab.
Click the If Missing transform from the FUNCTIONS category.
Enable the Create New Column option.
Select one or multiple column with missing values.
Provide a value to be added in the missing cells.
Click the Submit option.
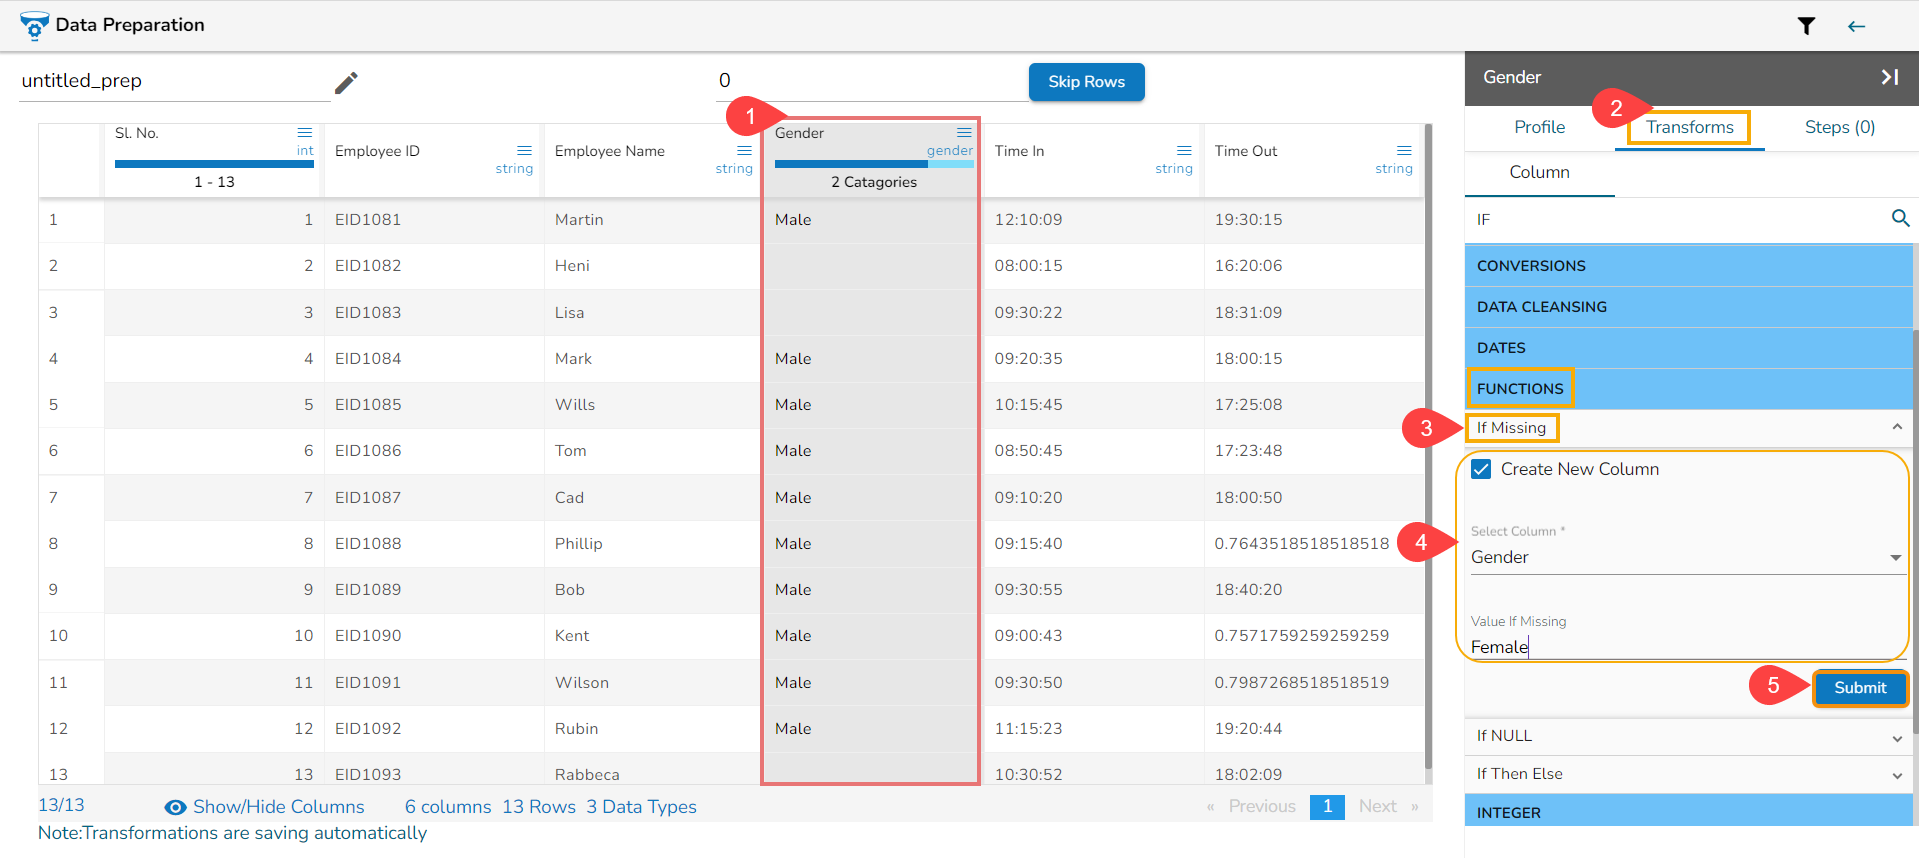
As a result a new column gets added reflecting the provided If missing values in the empty cells or the same column gets modified (In the given image a new column has been added with the transformed values).
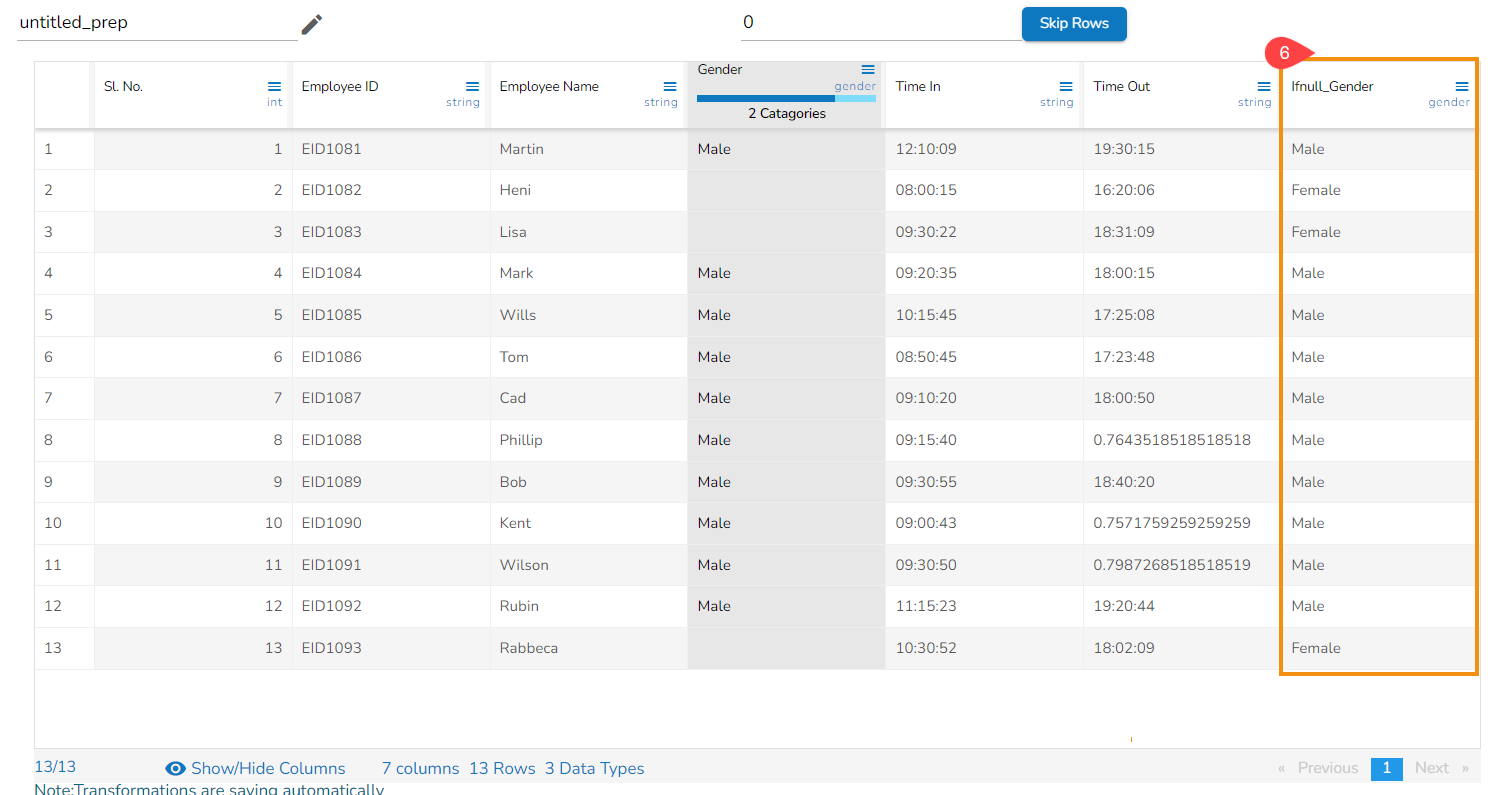
If NULL
The If NULL function writes out a specified value if the source value is null. Otherwise, it writes the source value.
Check out the given illustration on how to use the If NULL transform.
Steps to perform the If NULL transform:
Select a column that contains null cell(s).
Open the Transforms tab.
Click the If NULL transform from the FUNCTIONS category.
Configure the below-given details:
Enable the Create New Column option to create a new column with the result values.
Select a column using the drop-down option.
Provide the value to be added if null value is found in the source transform.
Click the Submit option.
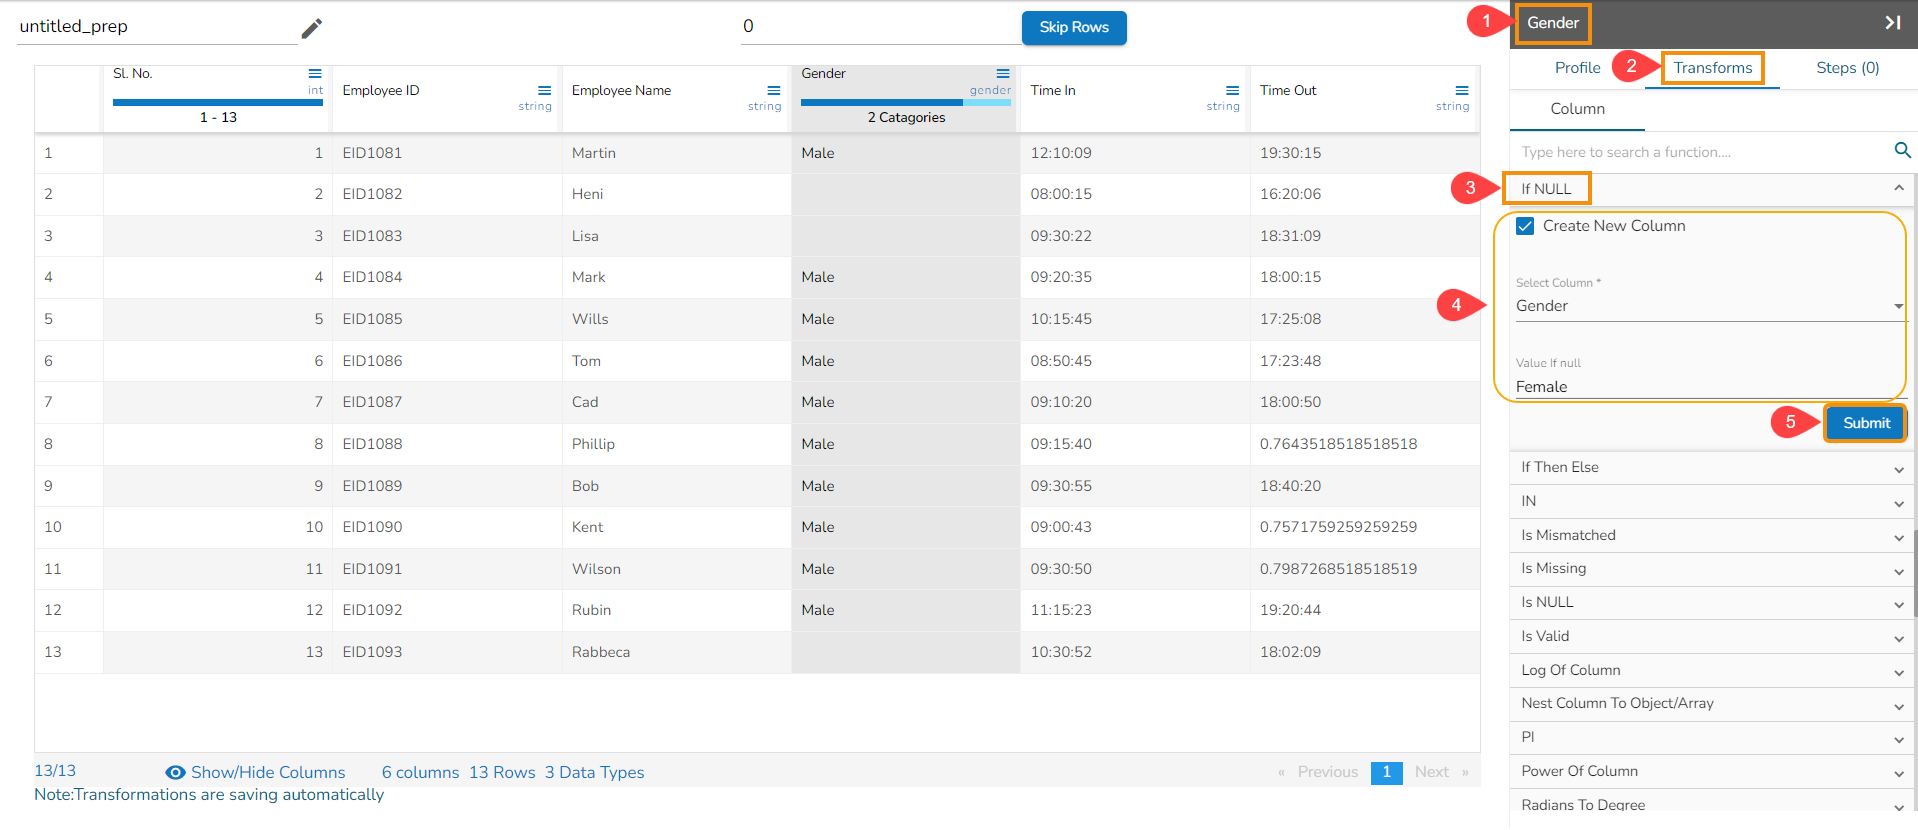
Result: The selected value will get updated to that cell either as a new column or on the same column based on the saved configuration.
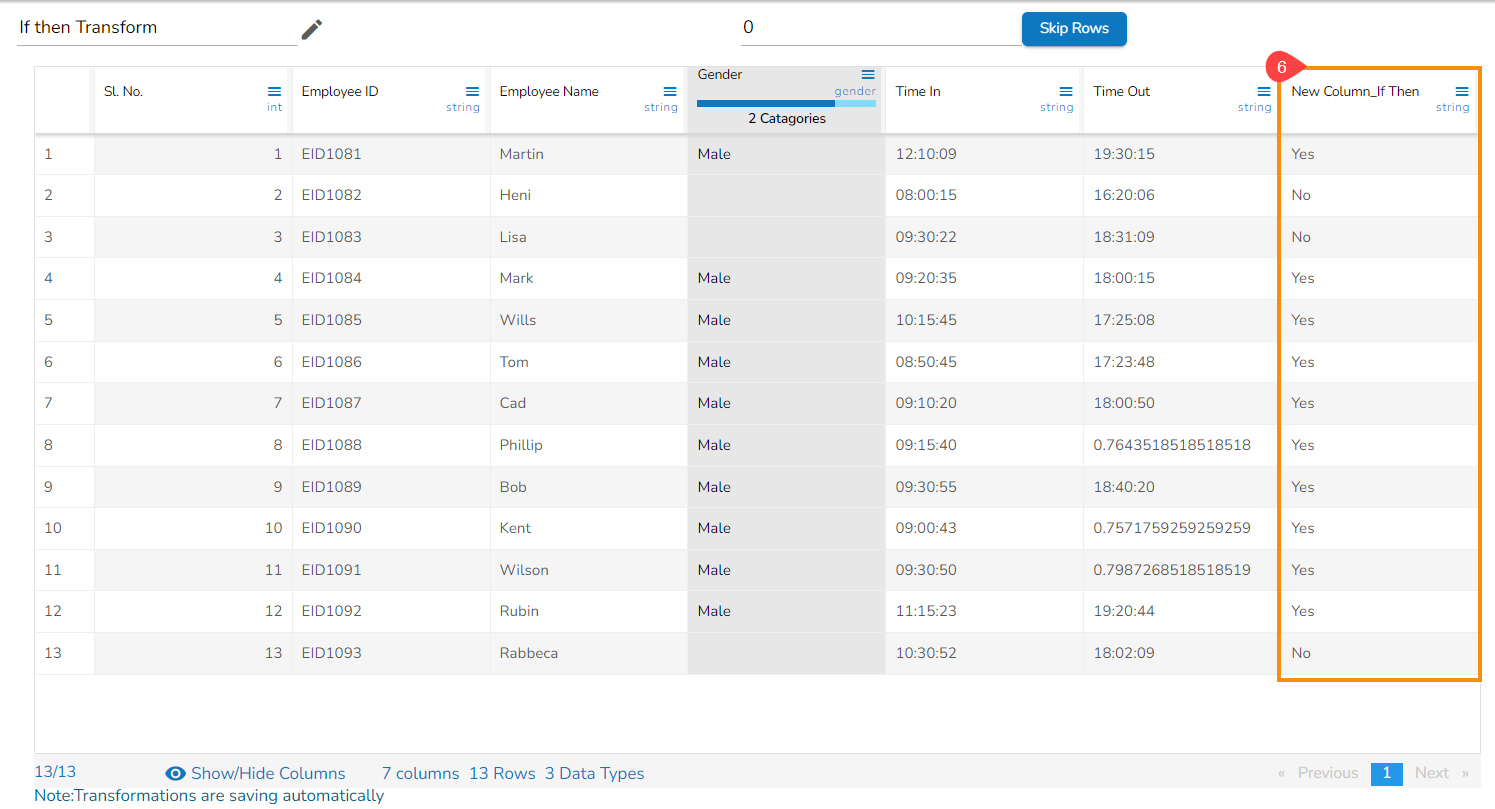
If Then Else
This is used to return values according to the logical expression. If the test expression evaluates to true, the true_expression is executed else the false_expression is executed.
Steps to perform the If Then Else transformation:
Select a column from the dataset that contains binary values.
Open the Transforms tab.
Select the If Then Else transform from the FUNCTIONS category.
Provide the following information:
Provide New Column name for the column that appears with the transformed data.
Provide the Logical expression in the If Value.
Provide the true_exp and false_exp respectively in the Then Value & Else Value fields.
Click the Submit option.
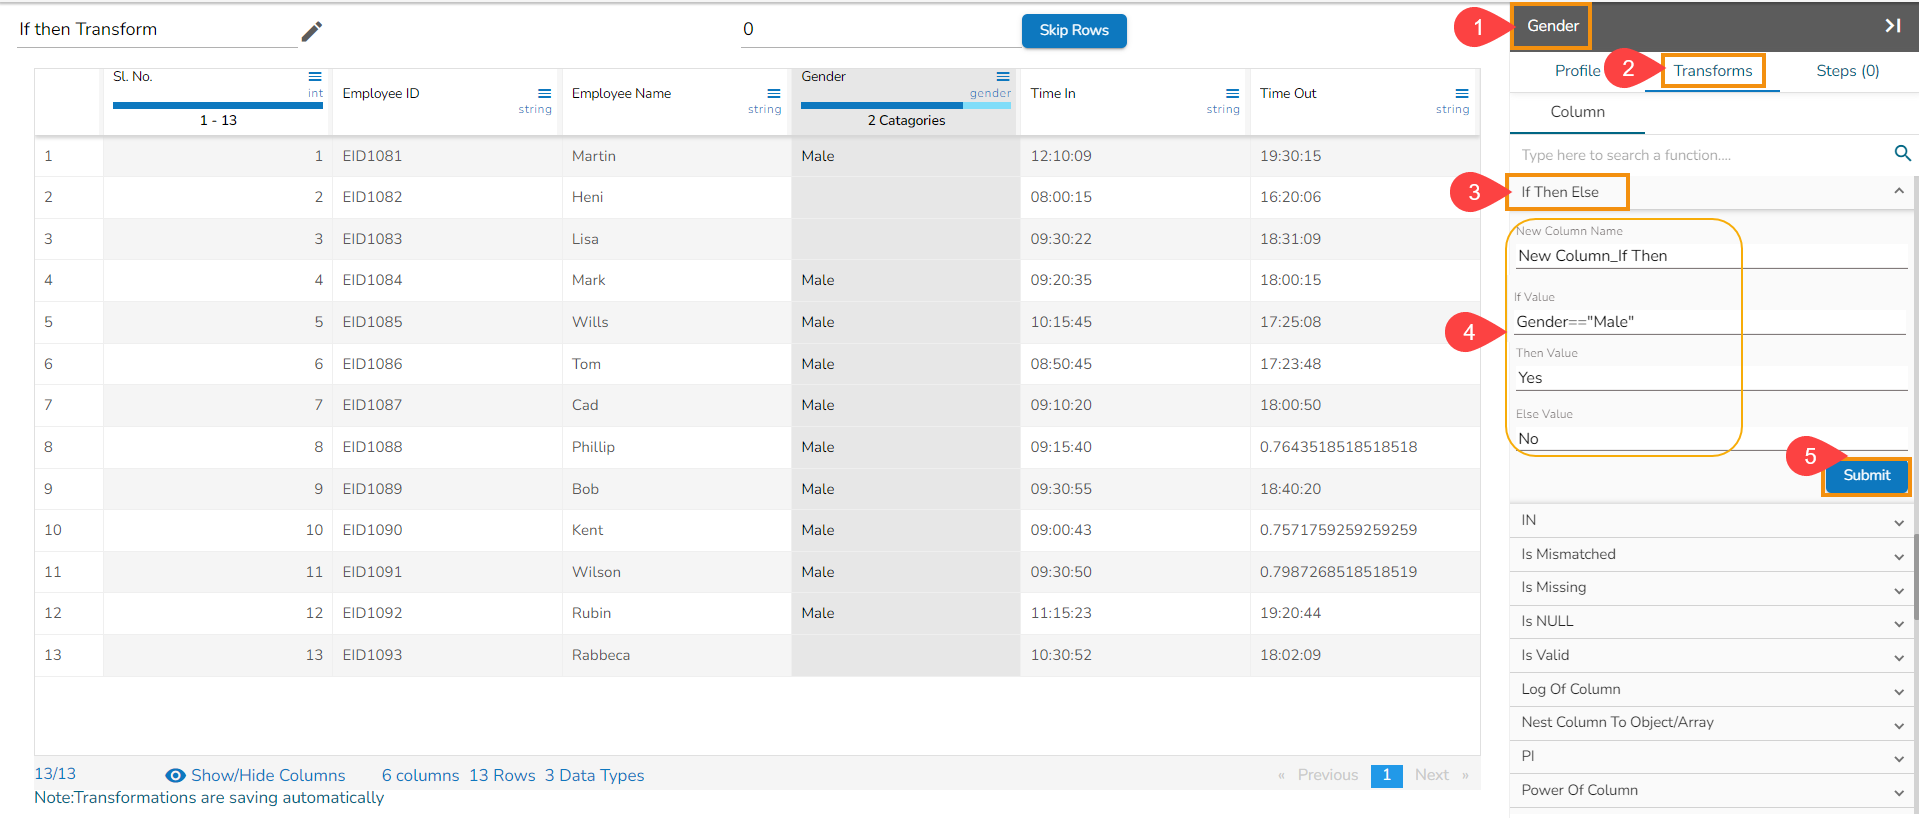
Result will come in a different column (with the configured name as given for the new column).
If the logical expression is true, then it will return the true_exp else false_exp.
Please Note:
While passing logical expression it should be in the below-given format as given -below
Column Name =="Value of Column" (String columns)
Column Name == Value of Column (Numeric columns)
The user can use any supported arithmetic operators (e.g., = =, <, >, <=, >=, !=)
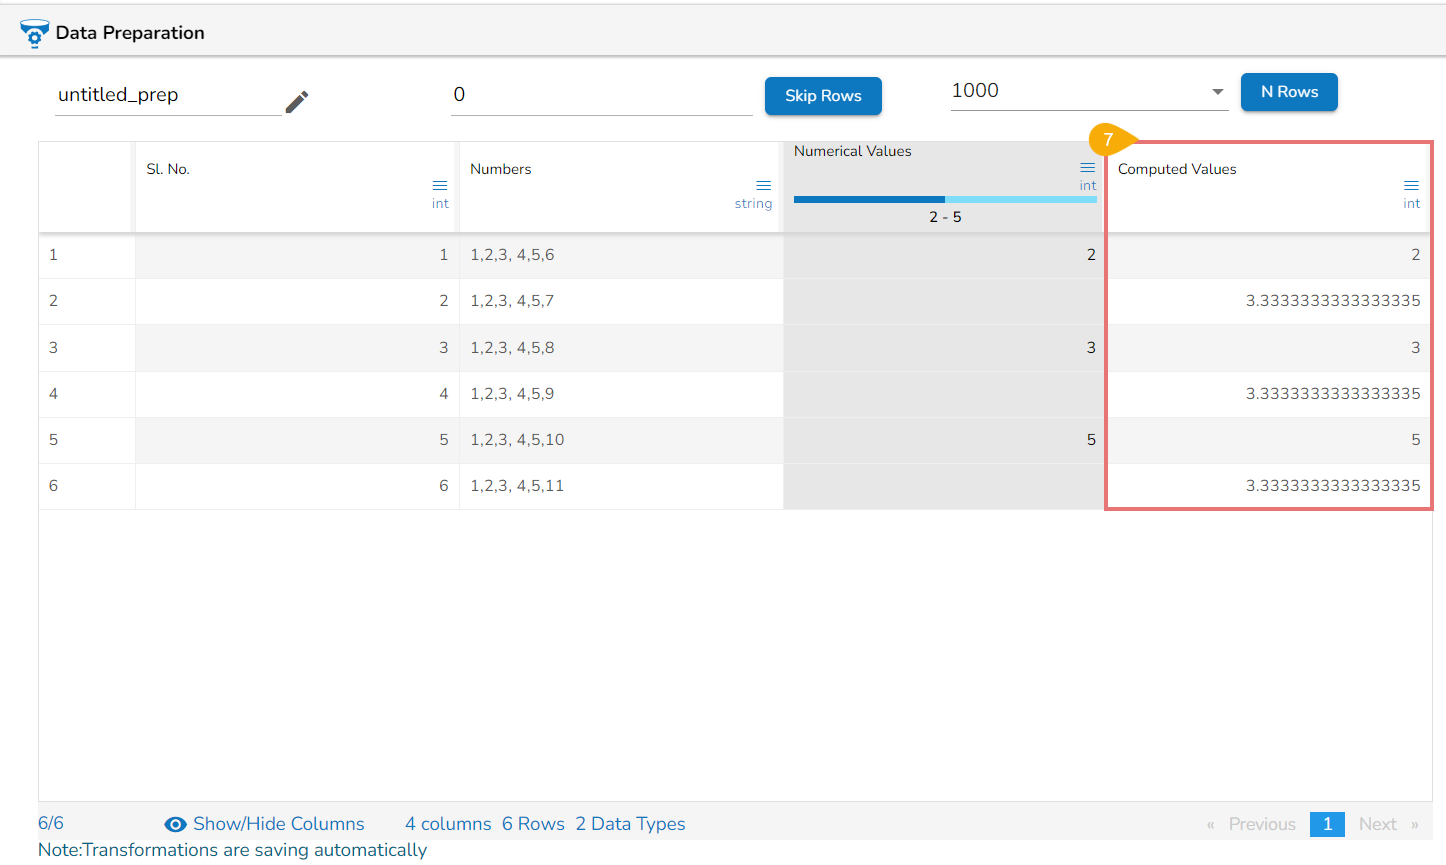
Impute with Computed Values
Imputation is a common technique used in data preprocessing to handle missing or incomplete values in a dataset. There are various methods to impute missing data, and one common approach is to use computed values such as mean, median, or mode to fill in the missing values.
Check out the given illustration on how to use Impute with Computed Values transform.
Navigate to a column with numerical values.
Open the Transforms tab.
Select the Transform.
Provide the New Column Name displaying the output.
Selected a computing method using the Compute Value drop-down.
Click the Submit option.
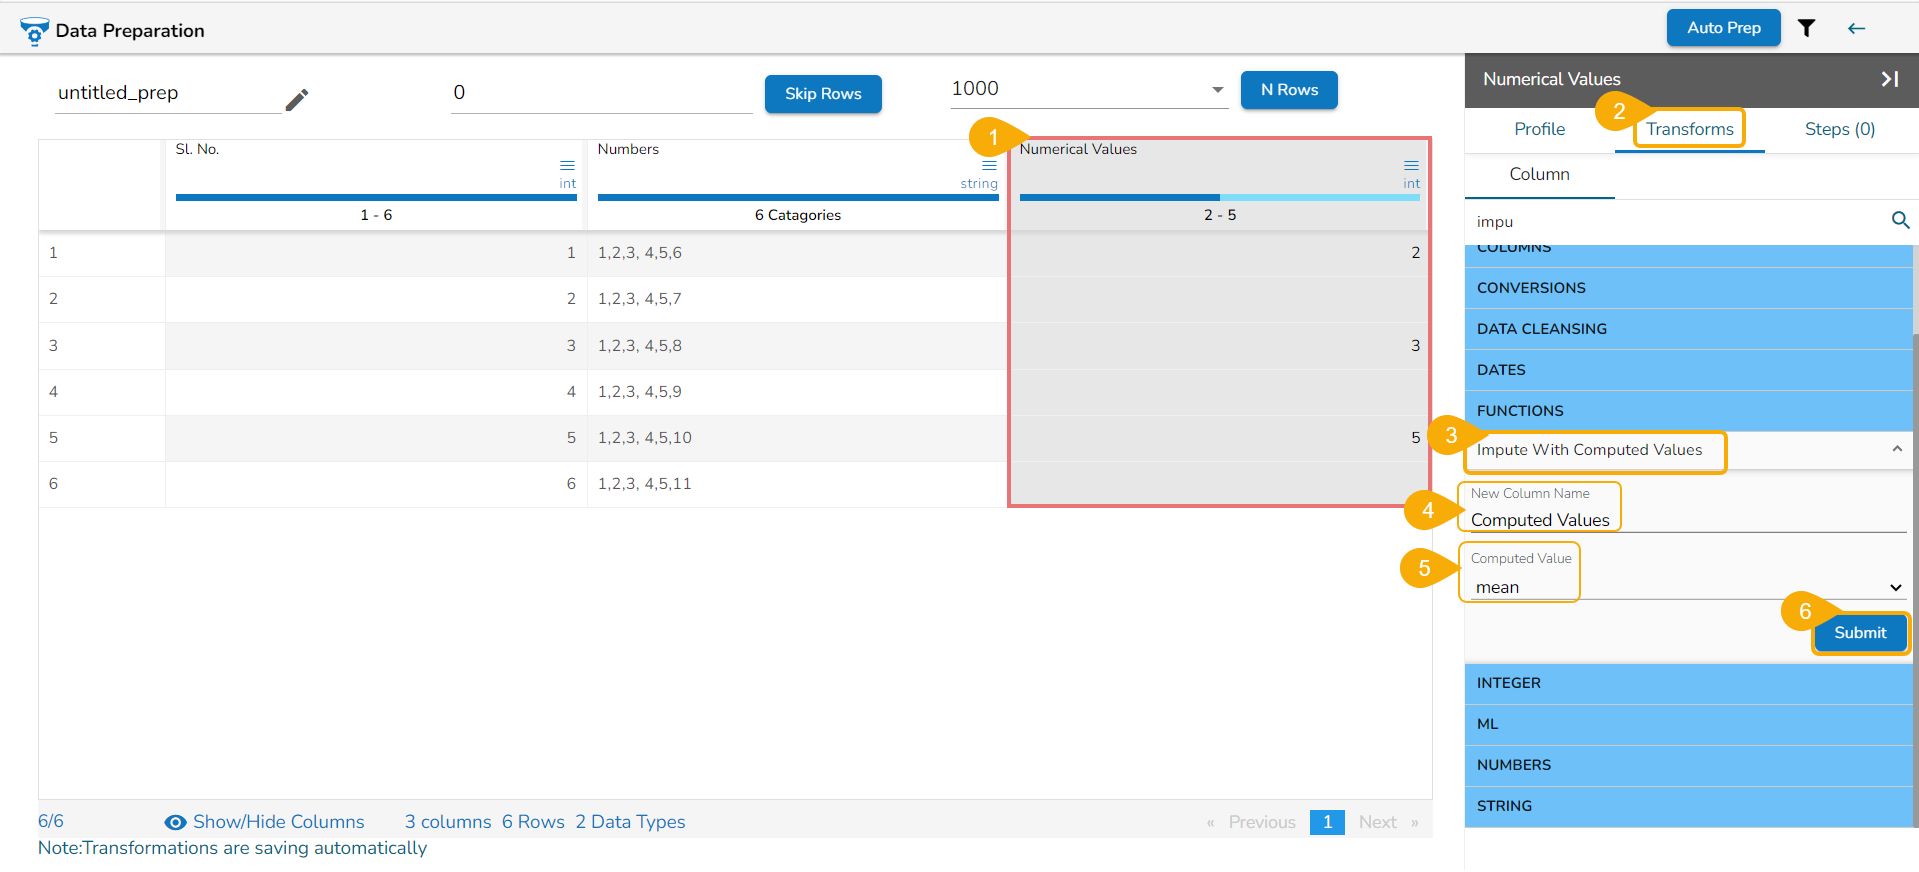
A new column gets added to the dataset based on the set computing value.
IN
This is basically to check whether the combination of values exists in the selected column or not. If it is there then the function returns true else false.
Check out the given illustration on how to use IN transform.
Steps to perform the IN transformation:
Navigate to the Transforms tab.
Select the IN transform from the FUNCTIONS category.
Select one or multiple columns using the drop-down menu.
Provide the values from the column (Use commas to separate multiple values).
Click the Submit option.
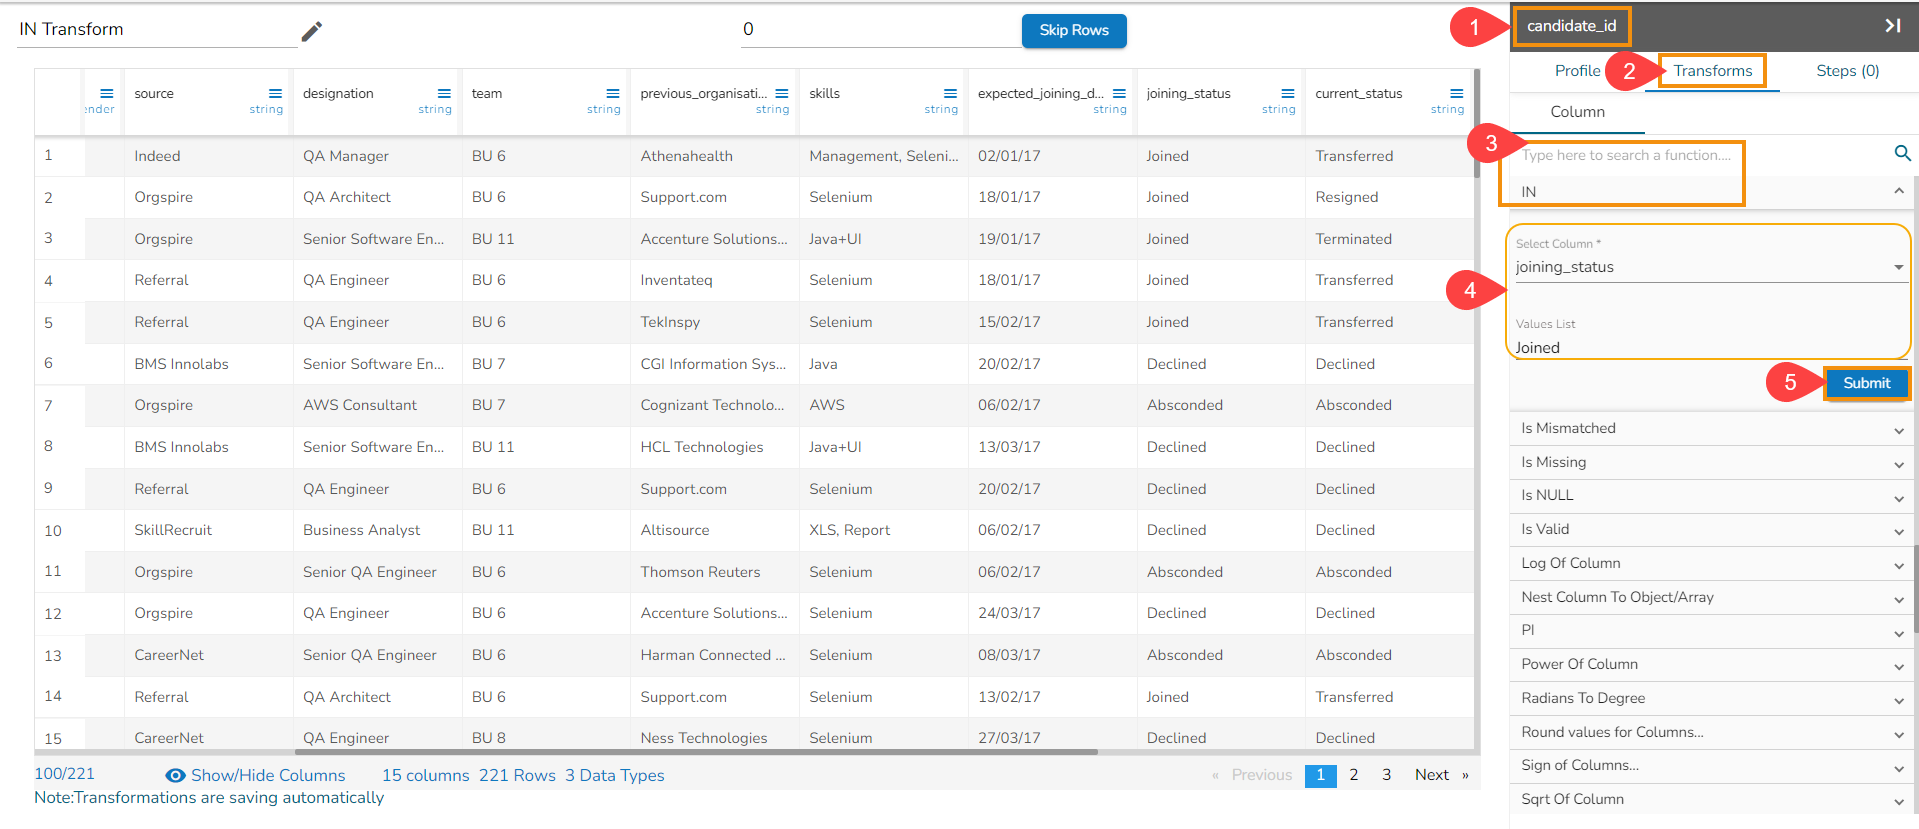
As a result a new column gets created with the result values. The result will return as True (for the values which are IN) else False.
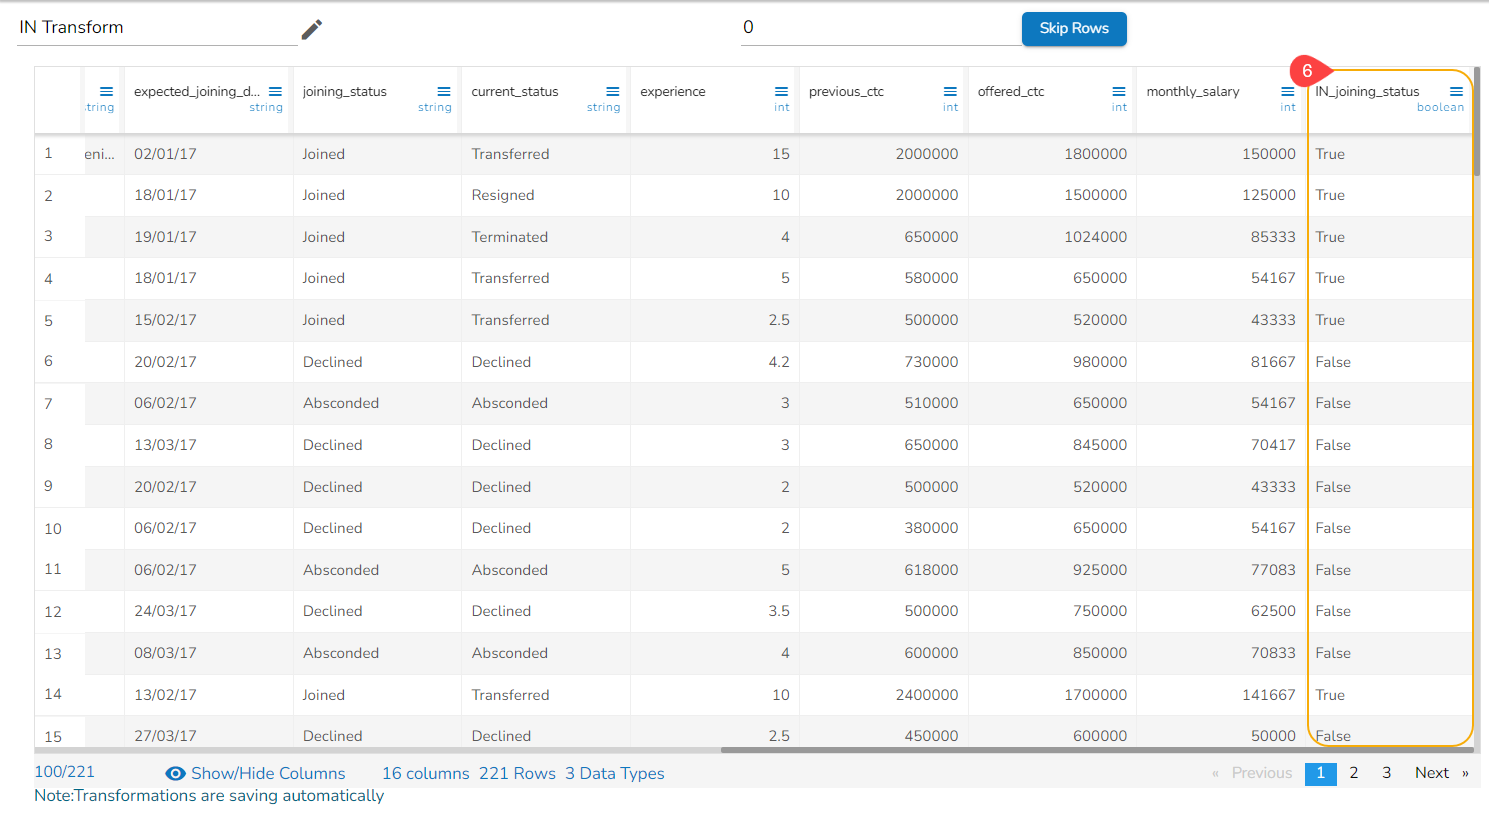
Please Note: When selecting one column, it will check the complete column where those values are present or not.
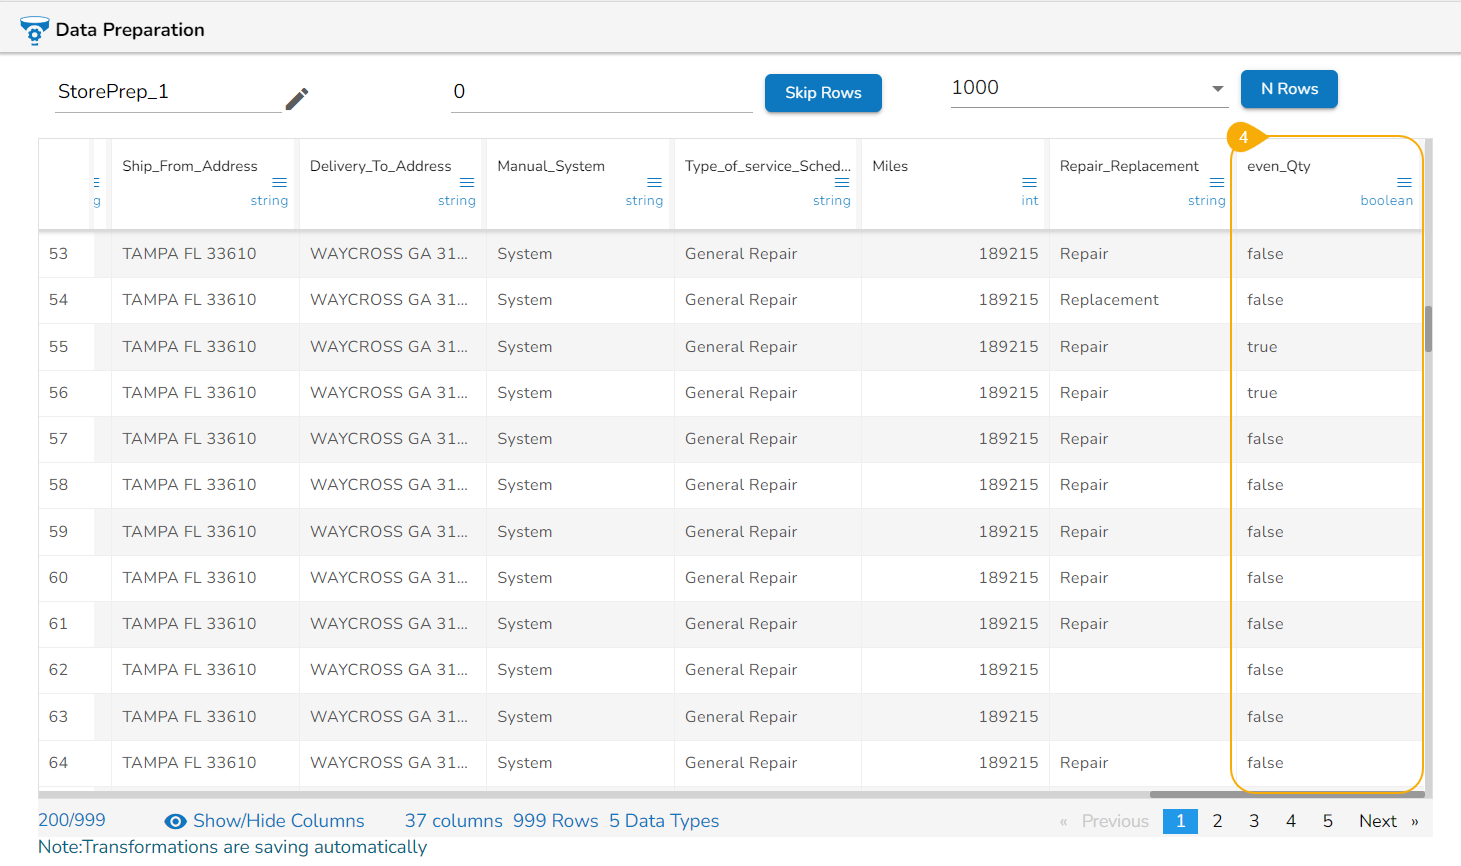
Is Even
The Is Even transform is a data manipulation operation that checks whether an integer is even or not. It evaluates the given integer and returns a Boolean value indicating whether it is an even number.
Check out the given illustration on how to use the Is Even transform.
Please Note: It returns True for the even number and False for the non-even values.
Steps to perform the transformation:
Select an Integer column.
Open the Transforms tab.
Click the Is Even transform to apply it on the selected column.

The result gets displayed in a new column. The newly added column displays True if the integer is Even, else it will mention False.
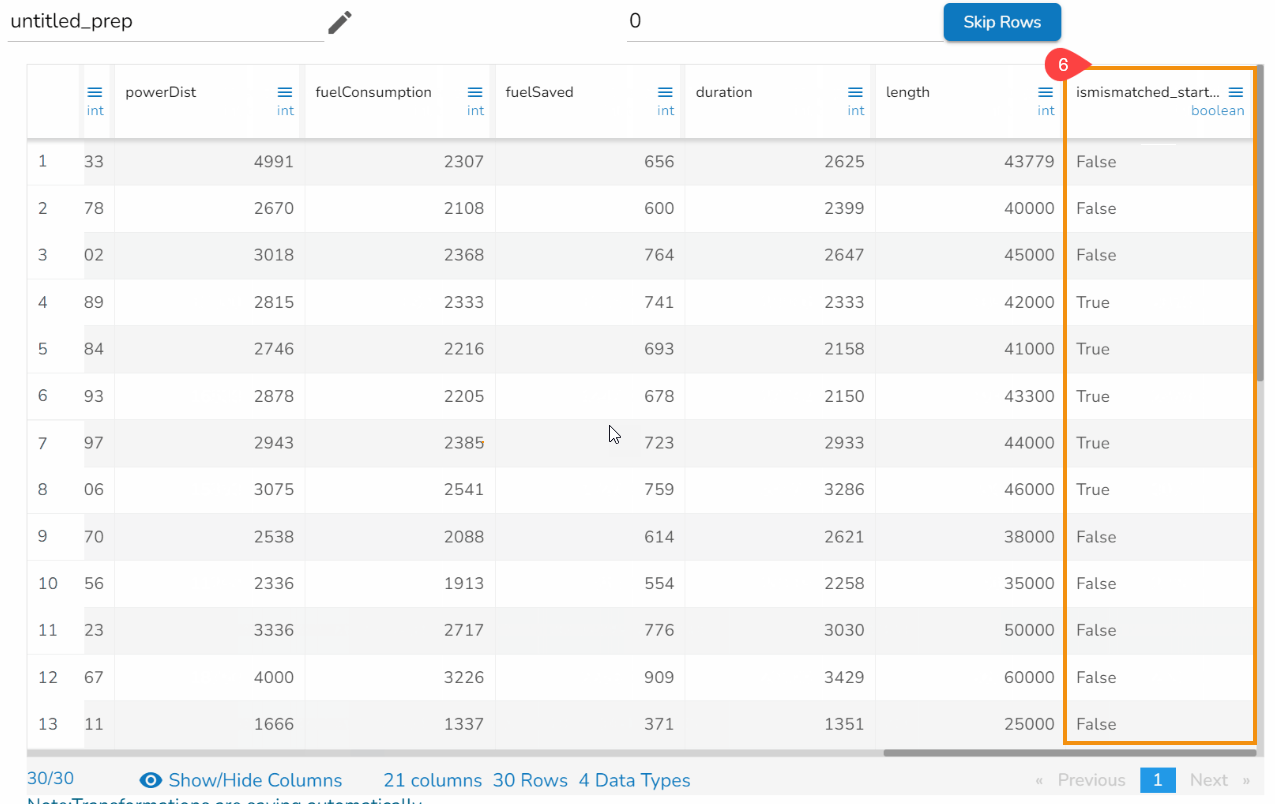
Is Mismatched
The Is Mismatched function confirms whether a column of values does not contain the datatype is provided, then the function returns true or false.
Check out the given illustration on how to use the Is Mismatched transform.
Steps to perform the transformation:
Select a column from the dataset.
Open the Transforms tab.
Select the Is Mismatched transform from the FUNCTIONS category.
Provide the datatype name which is required to confirm that doesn’t belong to that datatype. E.g., Datetime is the selected data type in the given example.
Click the Submit option.
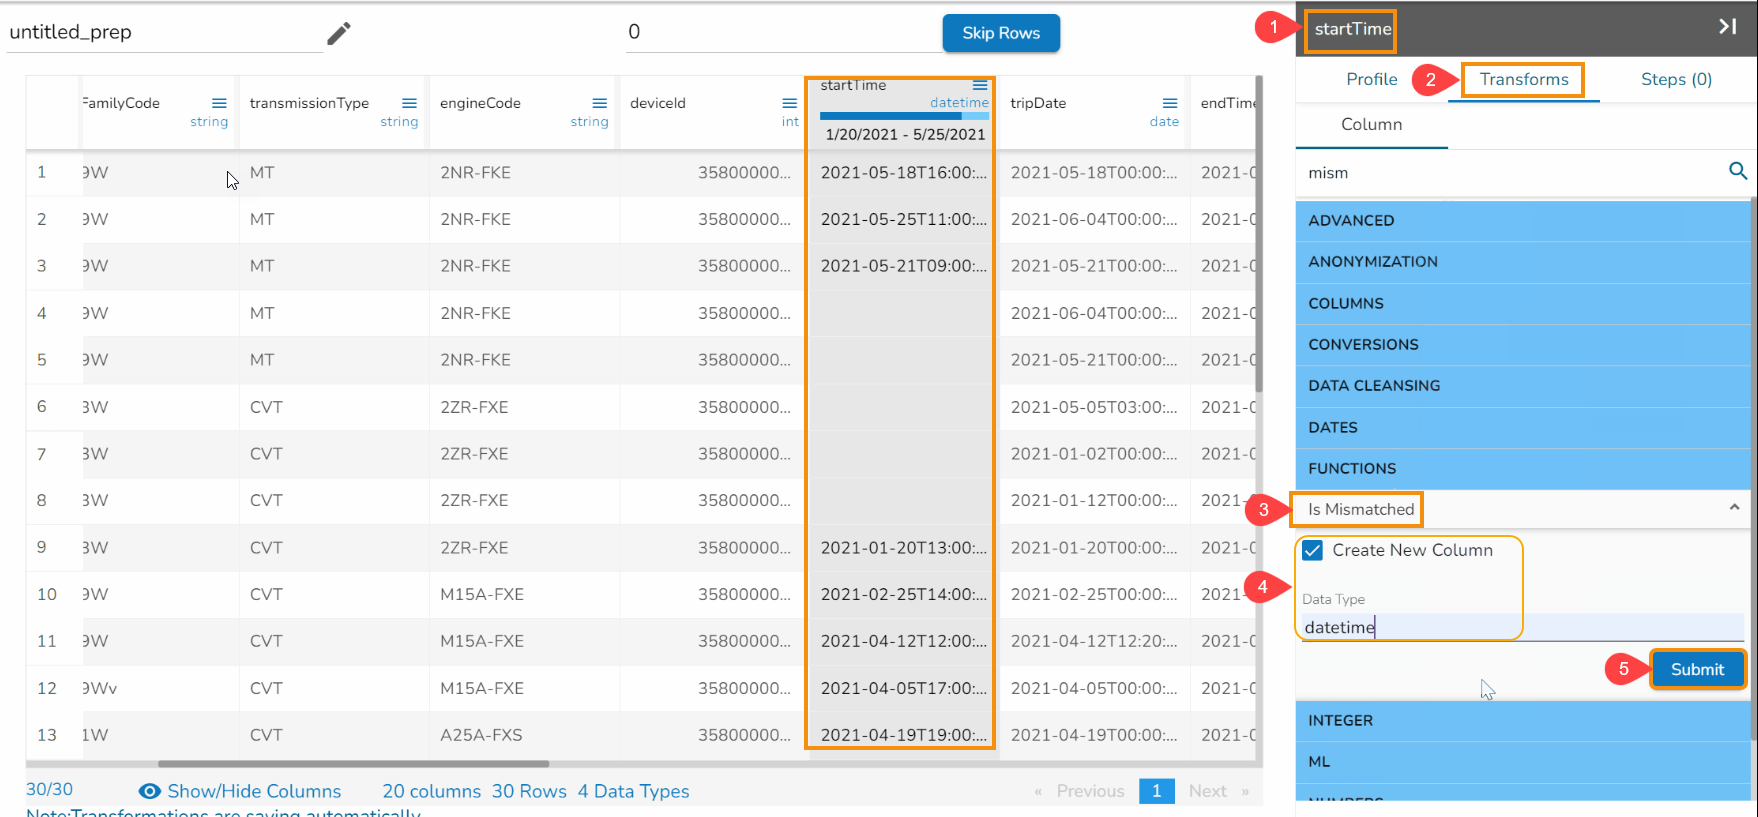
Result will come in a different column if the datatype is mismatched then returns True else False.
Is Missing
The Is Missing function tests whether a column of values is missing or null, then this function returns true or false.
Check out the given illustration on how to use Is Missing transform.
Steps to perform the Is Missing transformation:
Navigate to the dataset within the Data Preparation framework.
Open the Transforms tab.
Select the Is Missing transform from the FUNCTIONS category.
Select one or multiple columns that contain missing data.
Click the Submit option.
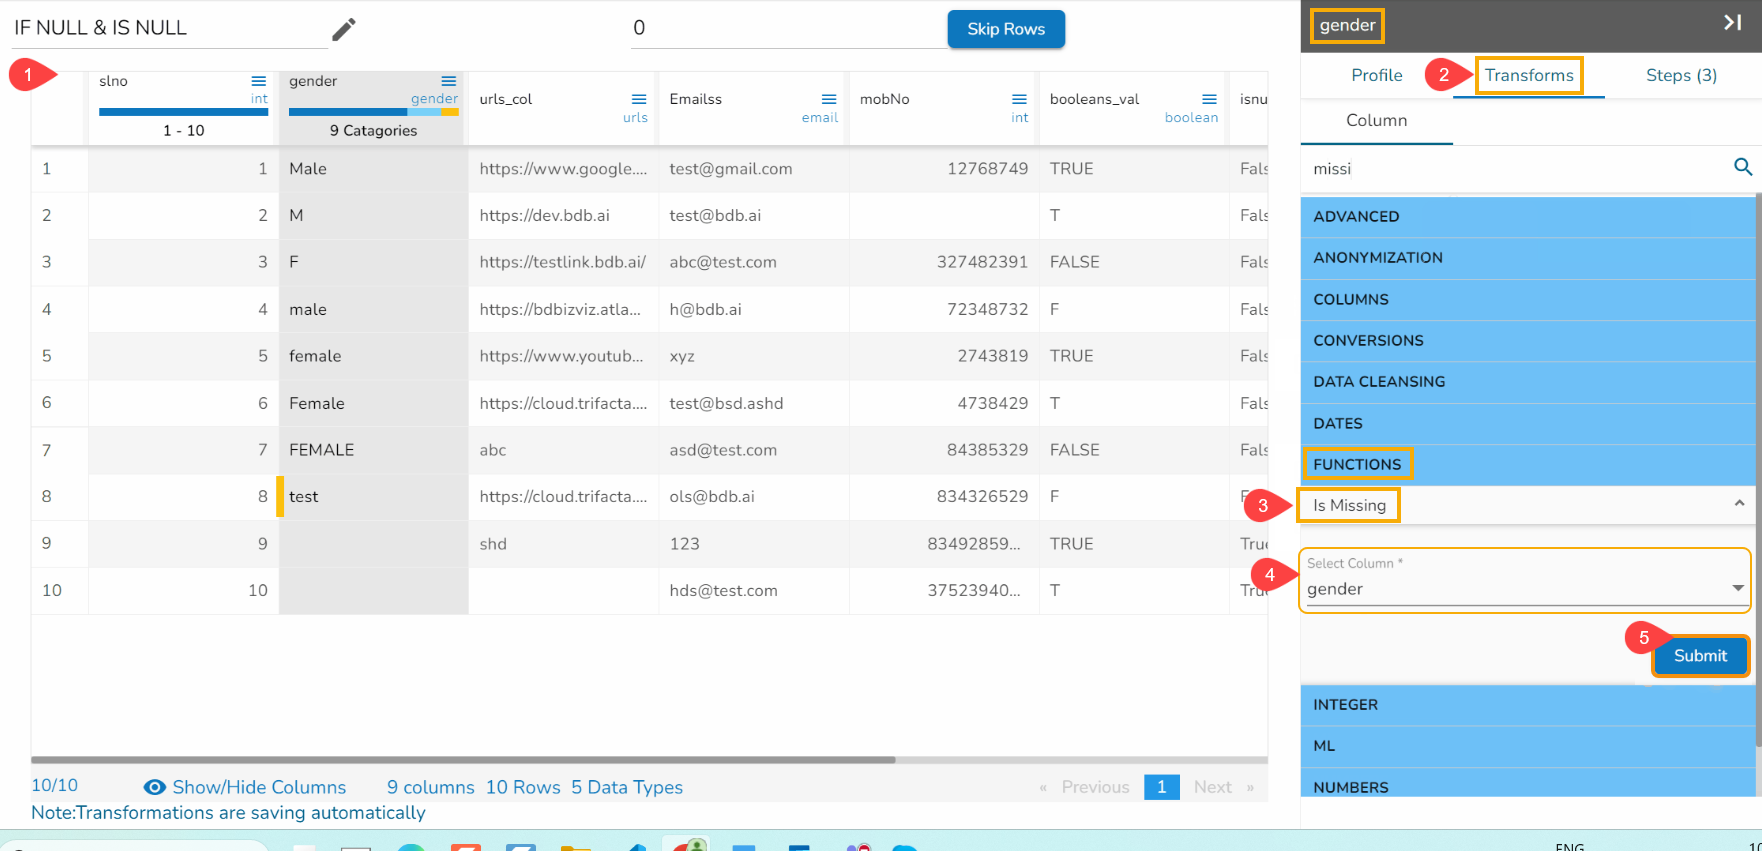
Result will c
ome in a different column. If values are missing from a cell of the selected column, it returns True else False in the result column.
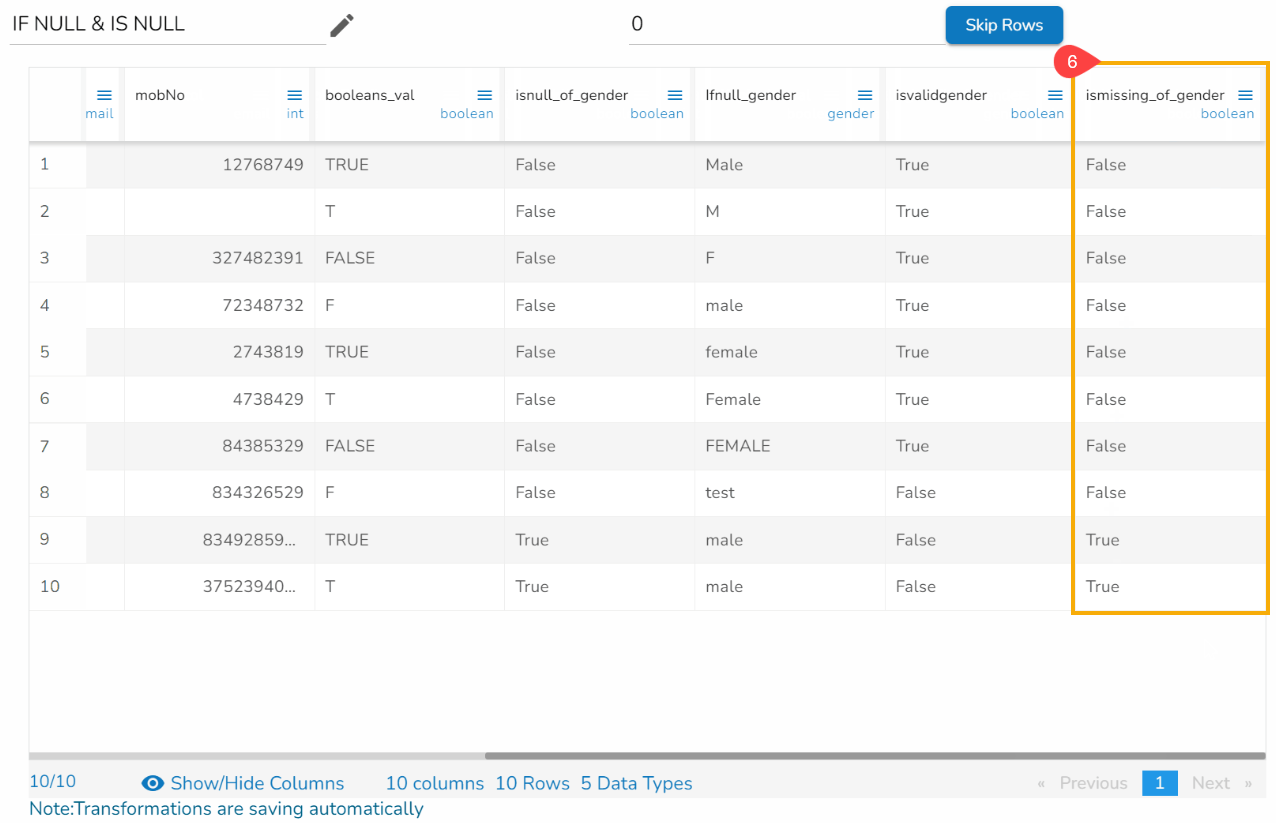
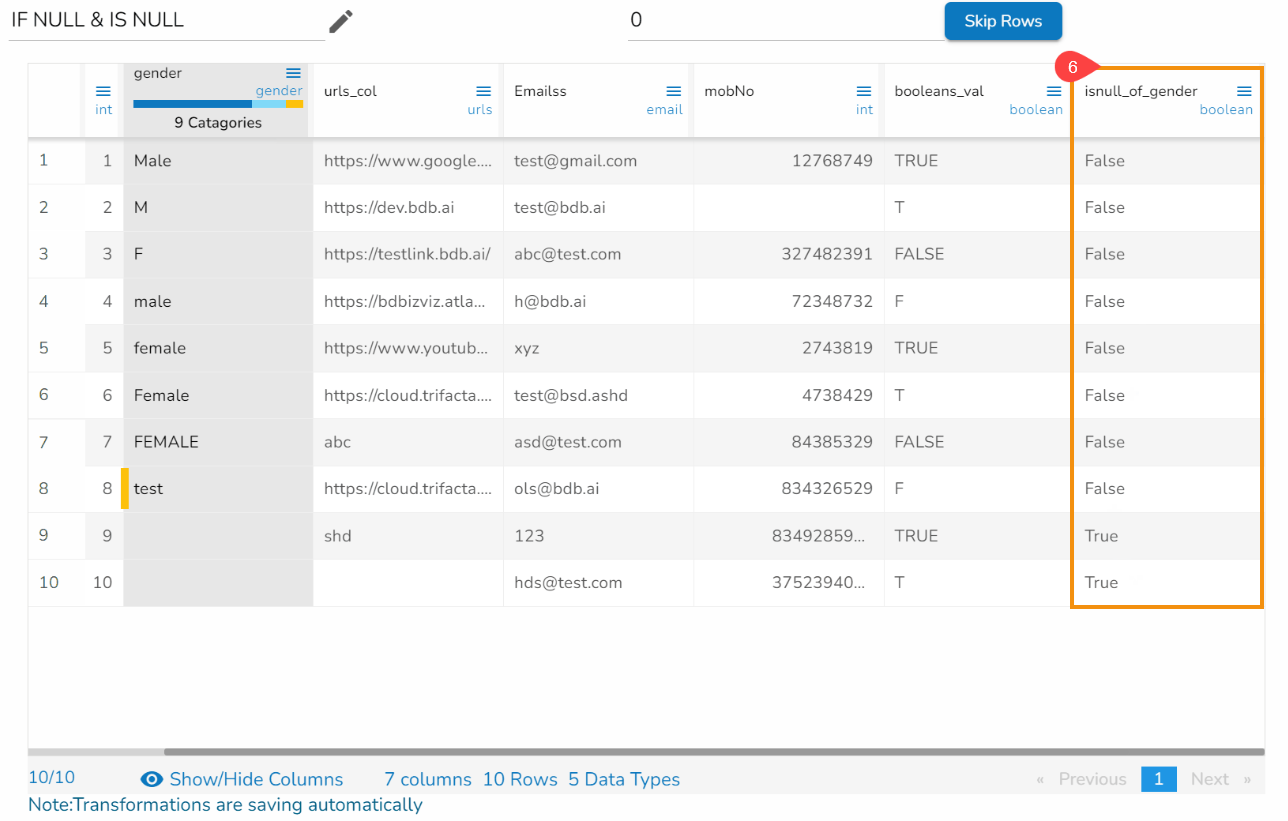
Is NULL
The Is NULL function tests whether a column of values contain null values. For input column references, this function returns either True or false.
Check out the given illustration on how to use the Is NULL transform.
Steps to perform the Is Null transformation:
Navigate to a Dataset in the Data Preparation framework.
Open the Transforms tab.
Select the Is NULL transform from the FUNCTIONS category.
Select one or multiple columns (It supports all datatypes).
Click the Submit option.
Result will come in a newly added column. If there is null value, it returns True else False.
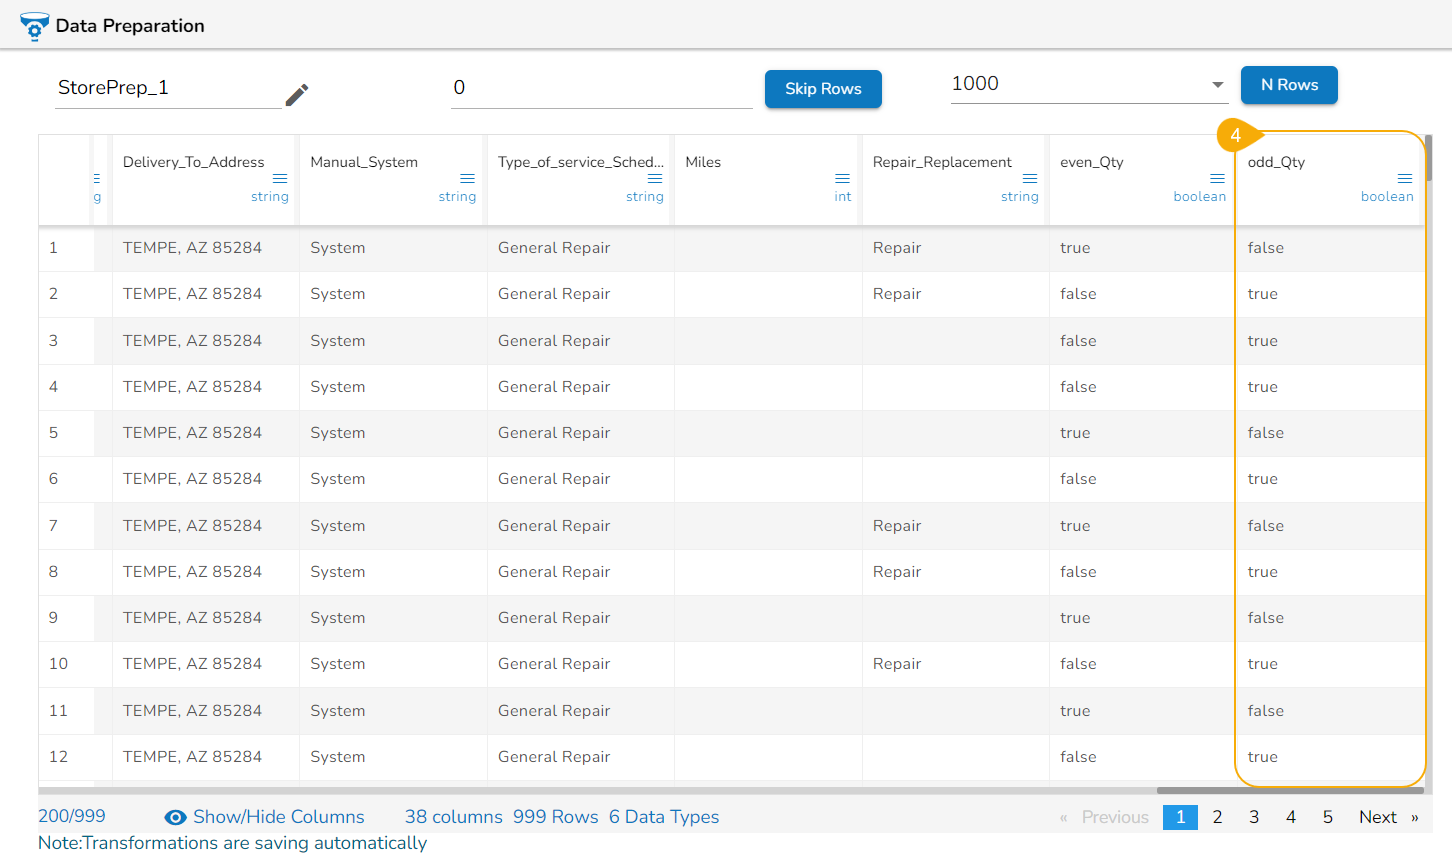
Is Odd
The Is Odd transform is a data manipulation operation that checks whether an integer is odd or not. It evaluates the given integer and returns a Boolean value indicating whether it is an odd number.
Check out the given walk-through on how to use Is Odd transform.
Steps to perform the transformation:
Select an Integer column.
Open the Transforms tab.
Click the Is Odd transform to apply it to the selected column.
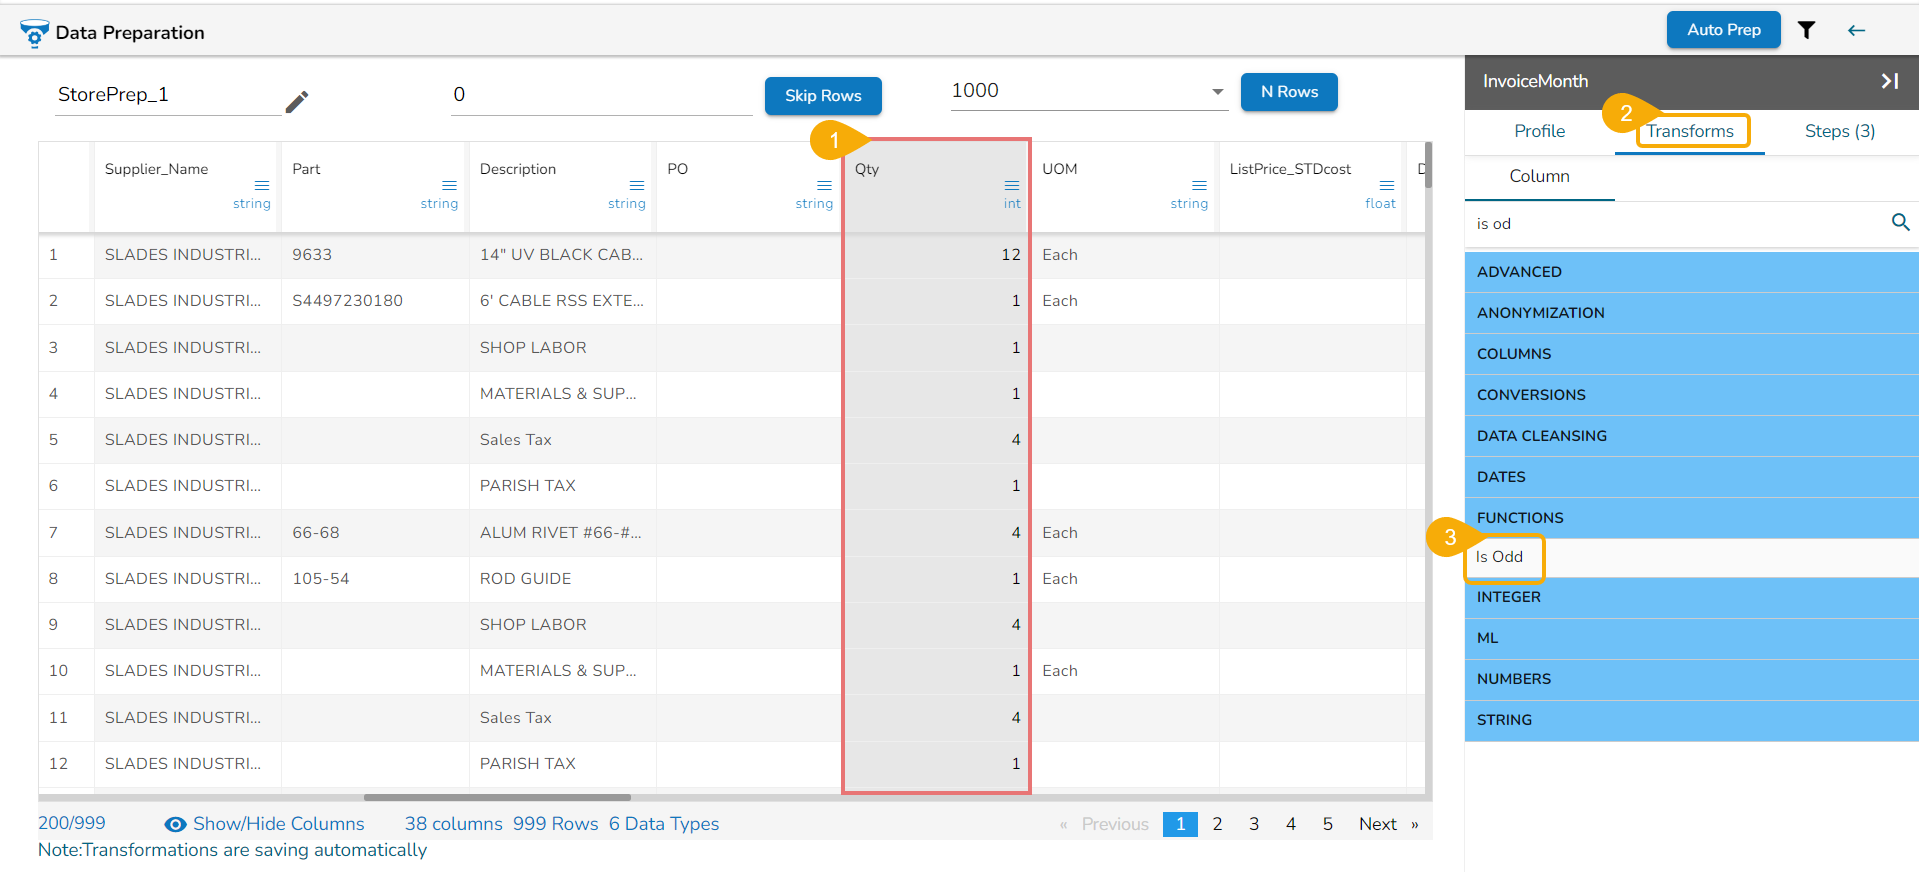
The result gets displayed in a new column. The newly added column displays True if the integer is Odd, else it will mention False.
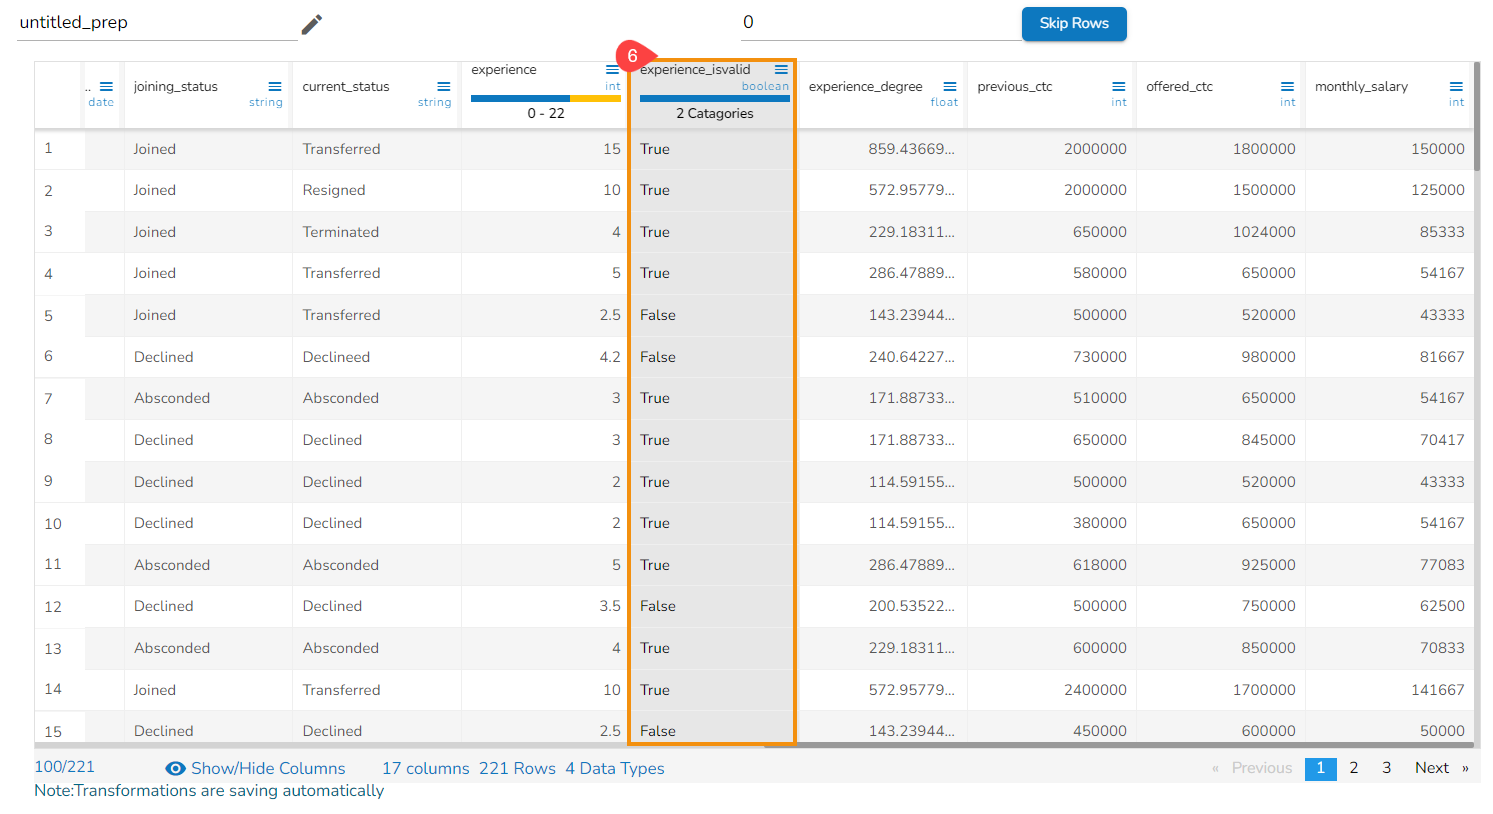
Is Valid
The Is Valid data transform is a data validation technique used to check the validity of data in a specific column in a dataset. Its primary purpose is to identify and flag data that may be erroneous (invalid) or missing. This transform results in a binary output, where the transformed column contains Boolean values (e.g., True or False) indicating whether each data point is valid or not.
Check out the given illustration on how to use Is Valid transform.
Steps to perform the transformation:
Navigate to a Dataset within the Data Preparation framework.
Open the Transforms tab.
Select the Is Valid transform.
Provide the datatype name which is required to confirm.
Click the Submit option.
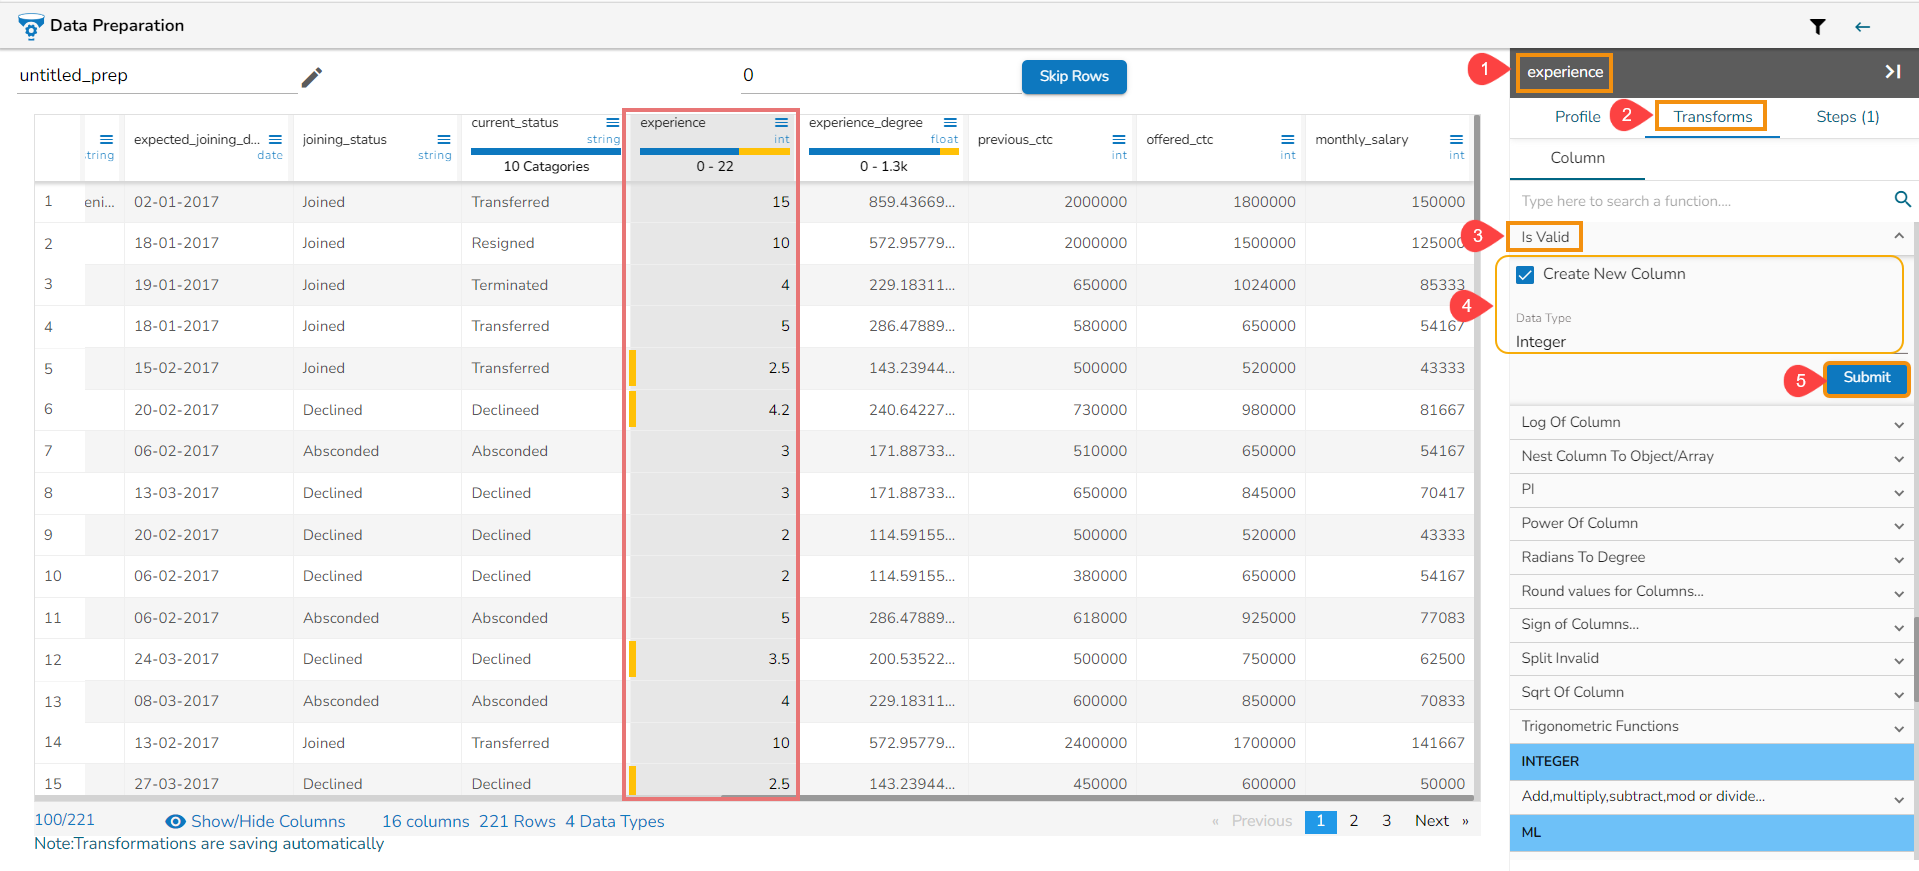
Result will come in a different column. If it is a valid data returns True else False.
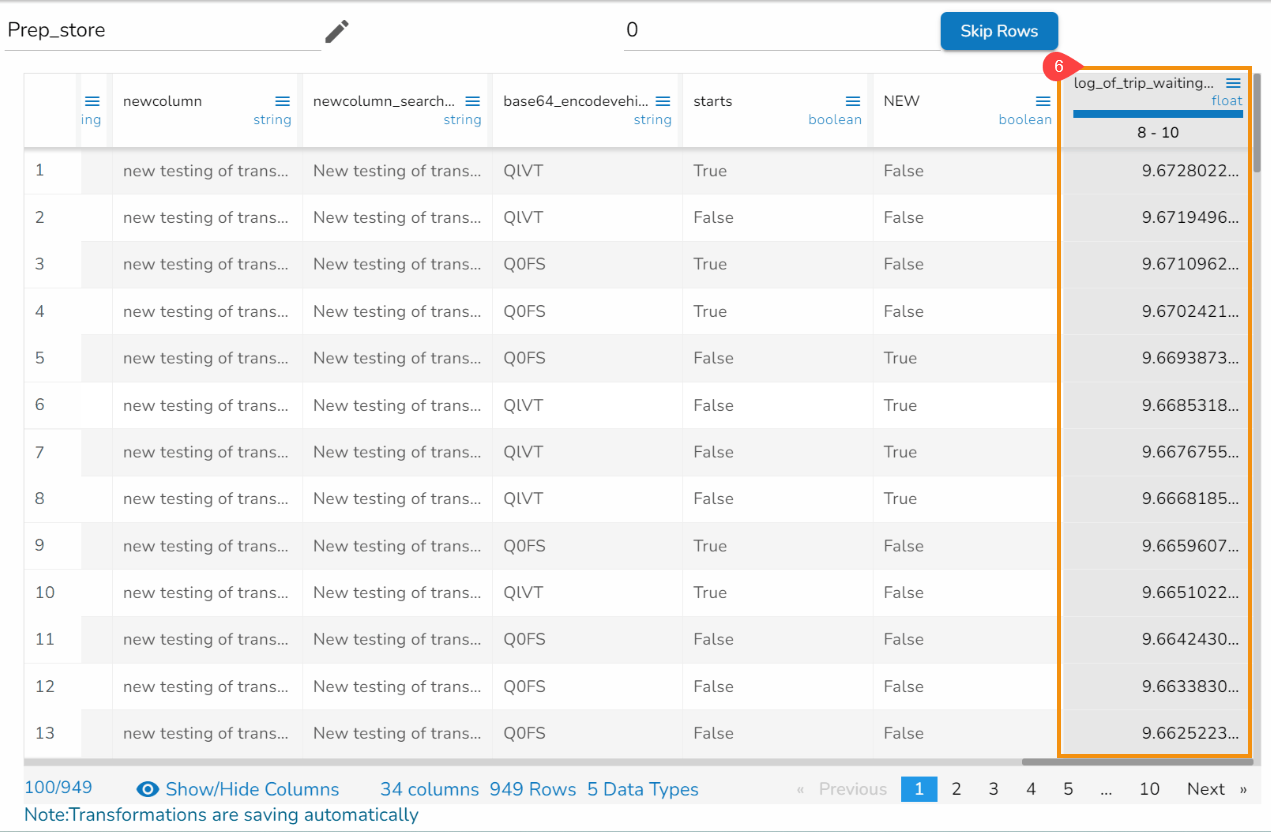
Log of Column
The natural logarithm uses the base "e," which is approximately equal to 2.71828. The mathematical notation, the natural logarithm is represented as "ln."
Check out the given illustration on how to apply the Log of Column transform.
Steps to perform the Log of Column transformation:
Select a column from the dataset within the Data Preparation framework.
Open the Transforms tab.
Select the Log of column transform from the FUNCTIONS category.
Select the Create New Column option to create a new column with the result values.
Click the Submit option.
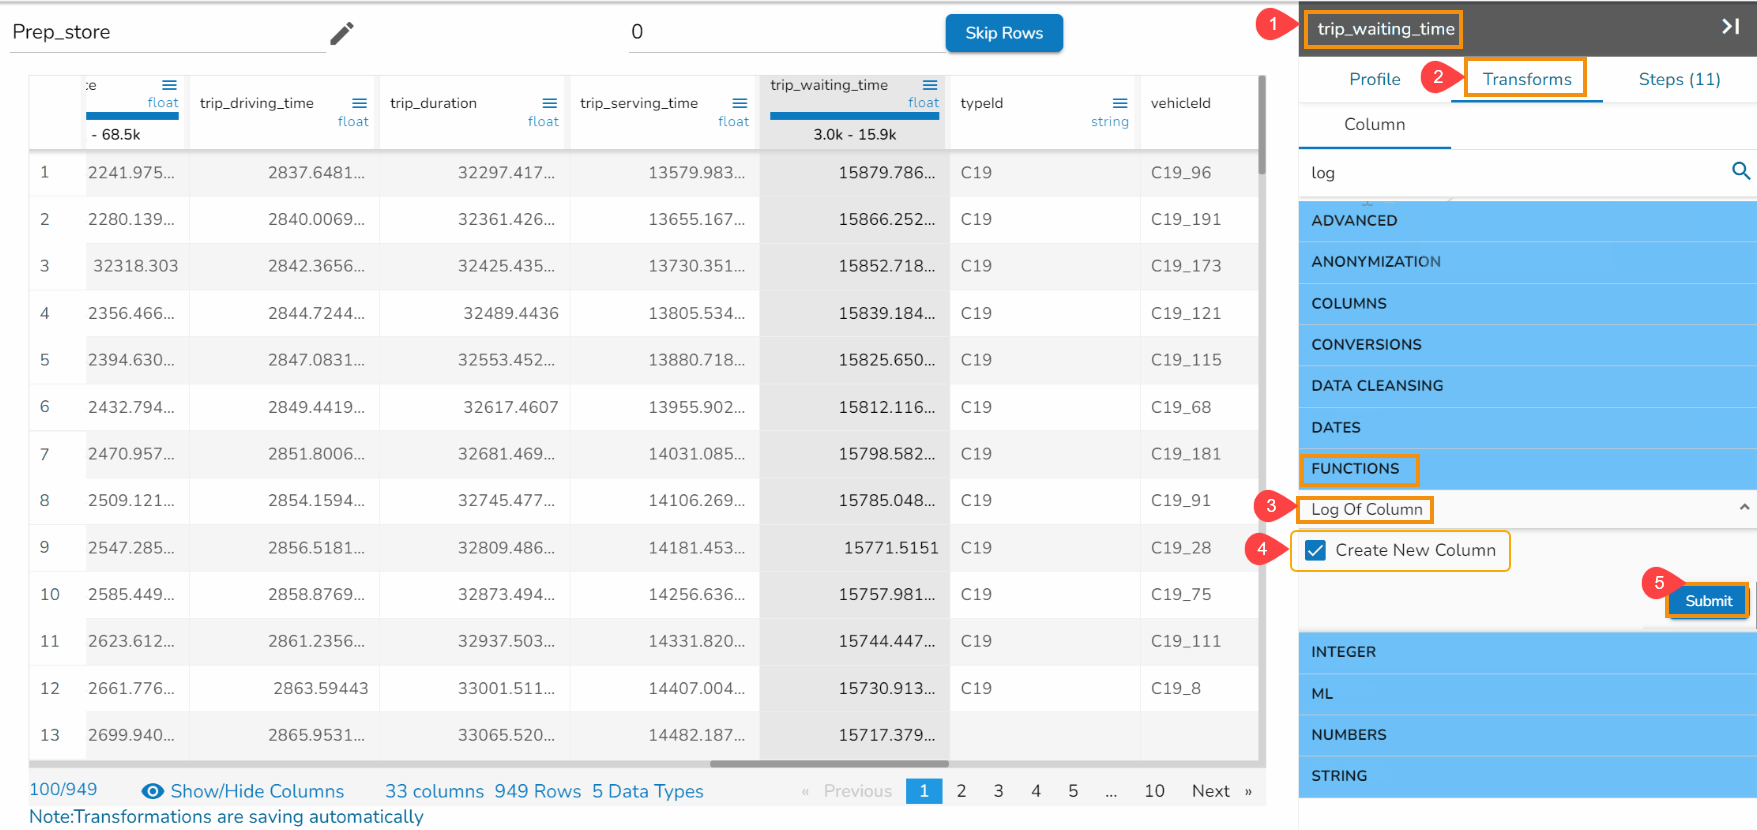
Result will come in a different column with the log result of the source column.
Please Note: The calculation format to be followed for the Log of Column transform is In(any value) e.g., In(100).
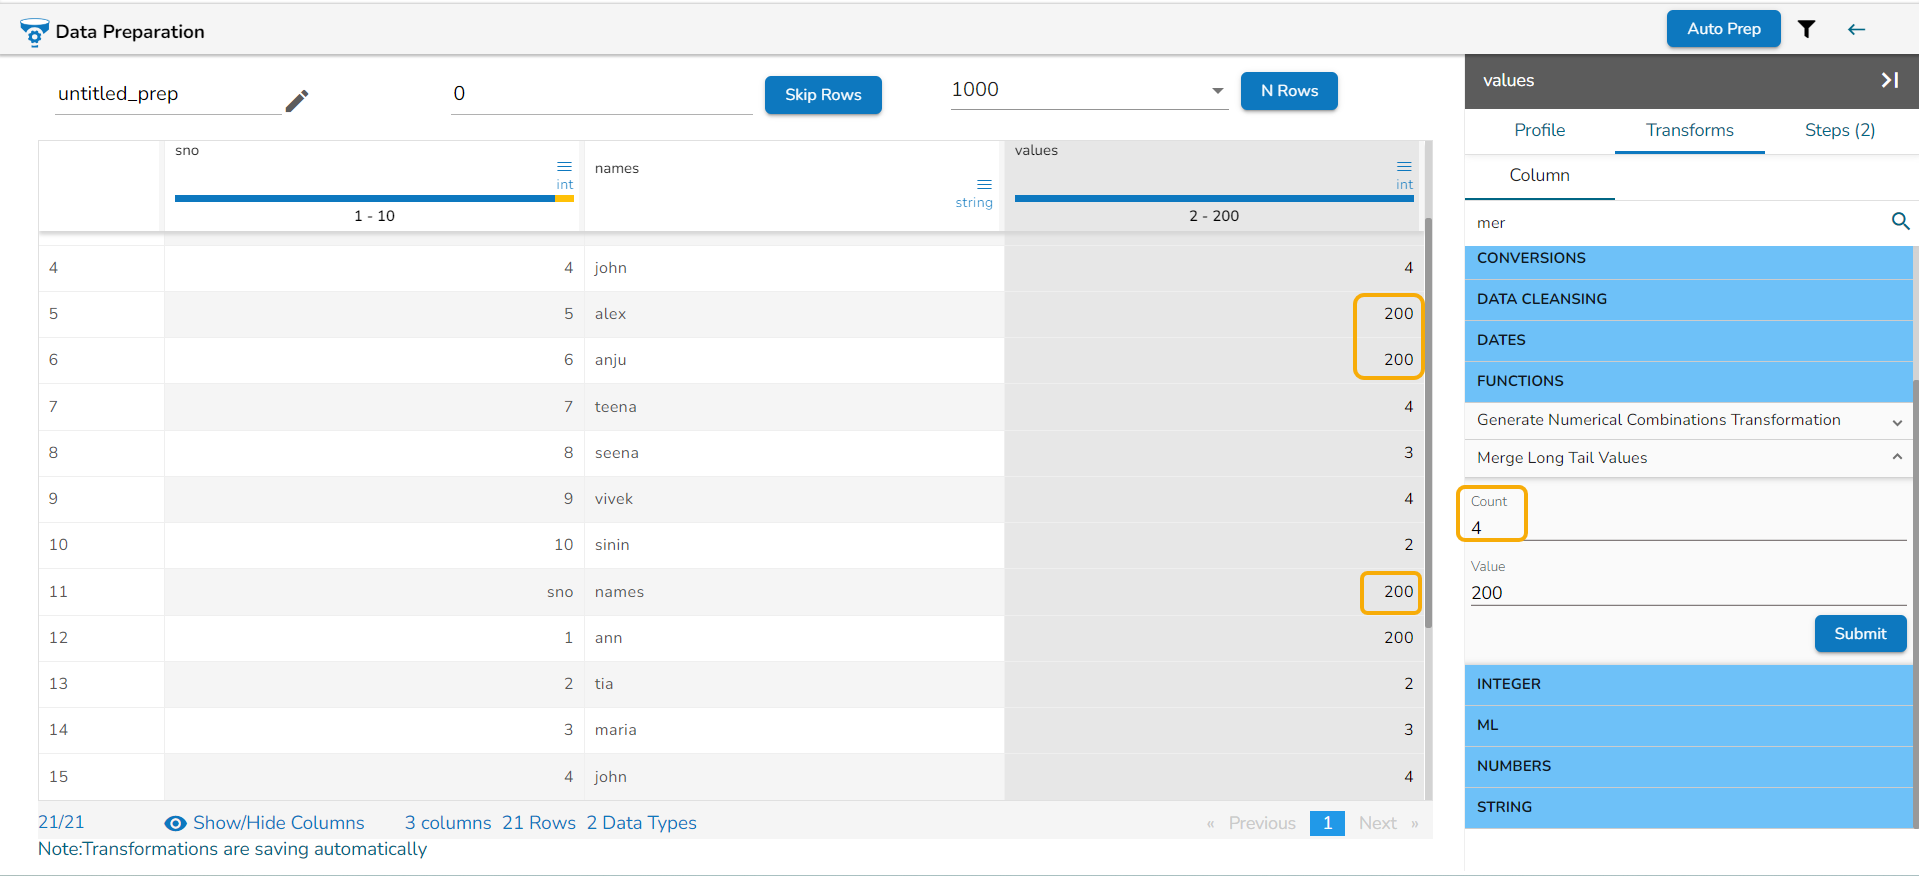
Merge Long Tail Values
This processor merges values below a certain appearance threshold.
Check out the given video on the usage of the Merge Long Tail Values transform.
Steps to perform transform:
Select a column.
Open the Transforms tab.
Select the transform.
Update Count & Value.
Click the Submit option.
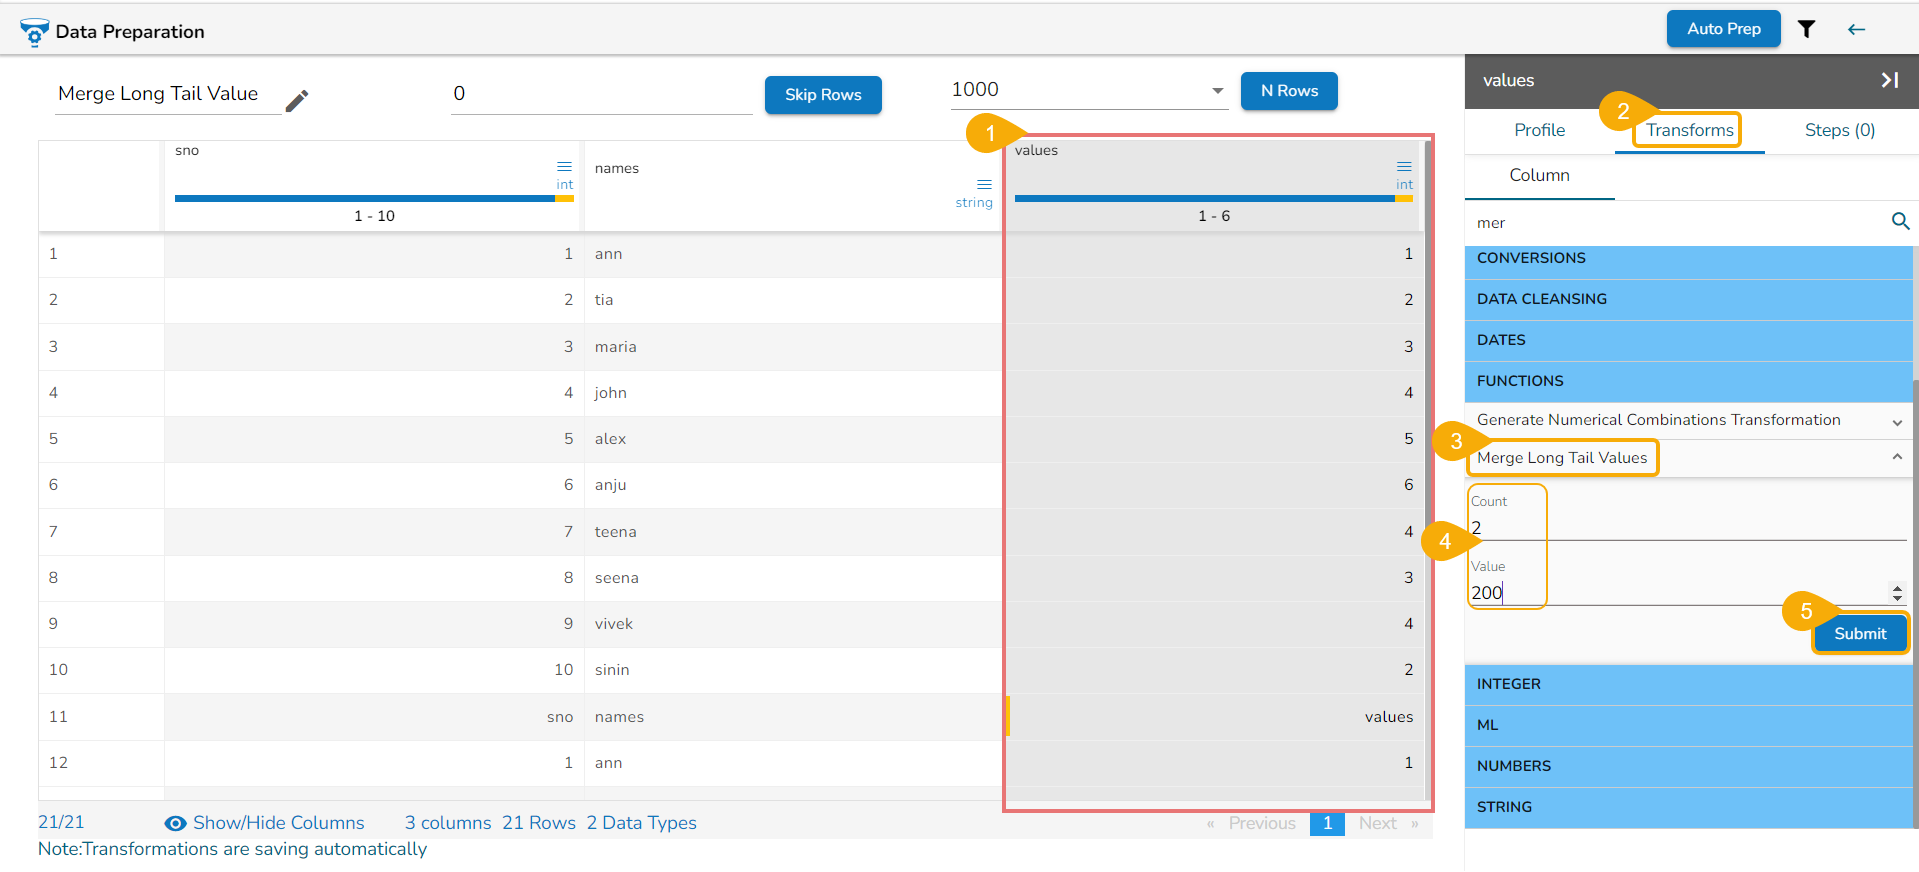
The result will get updated in the same column based on the count of occurrences. E.g., in the following image the given count is 2, so less than 2 only one value has been merged as the defined value (that is 200).
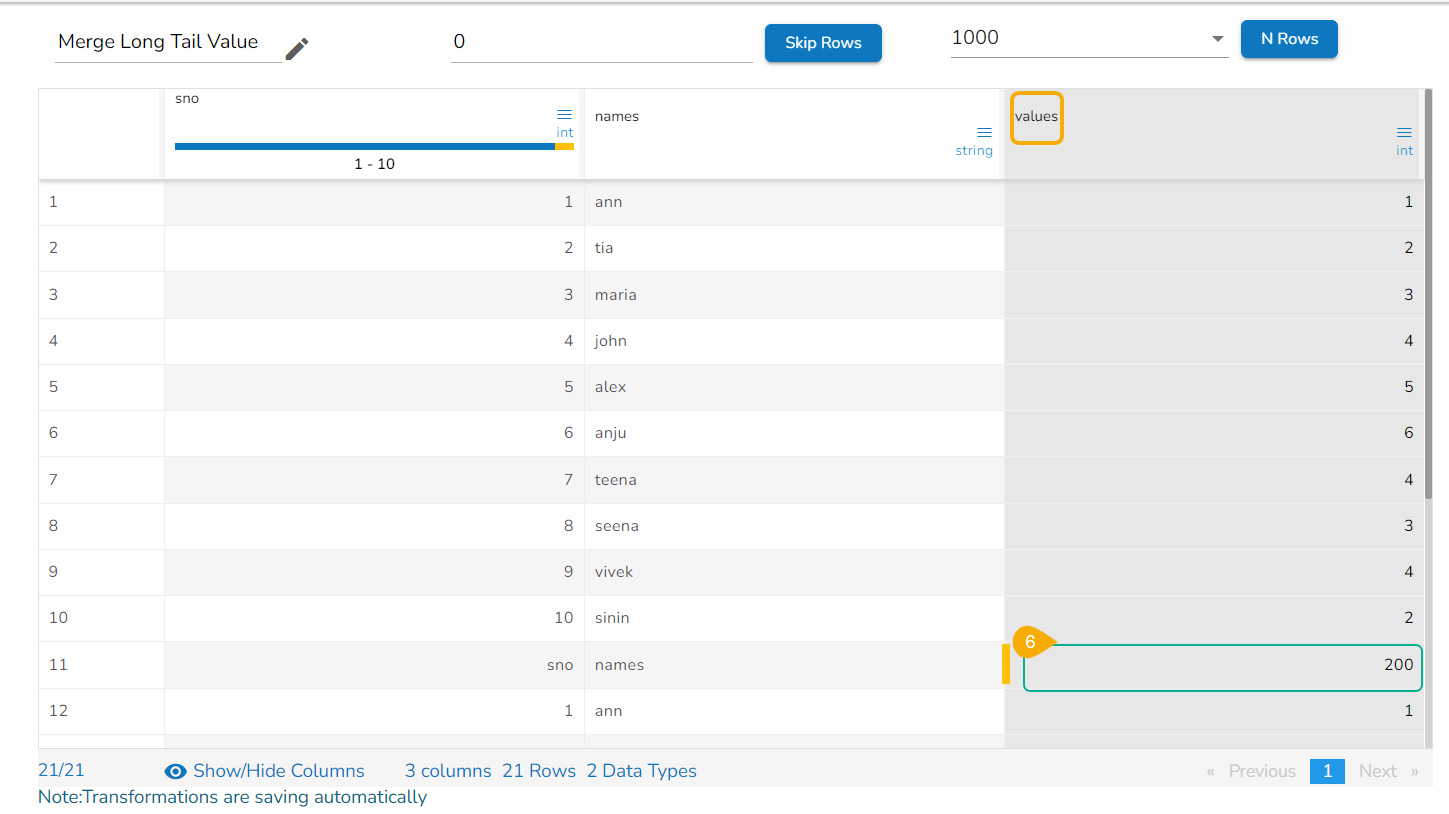
If the count is given 4 then less than 4, so any 3 values will turn into the given value digit.
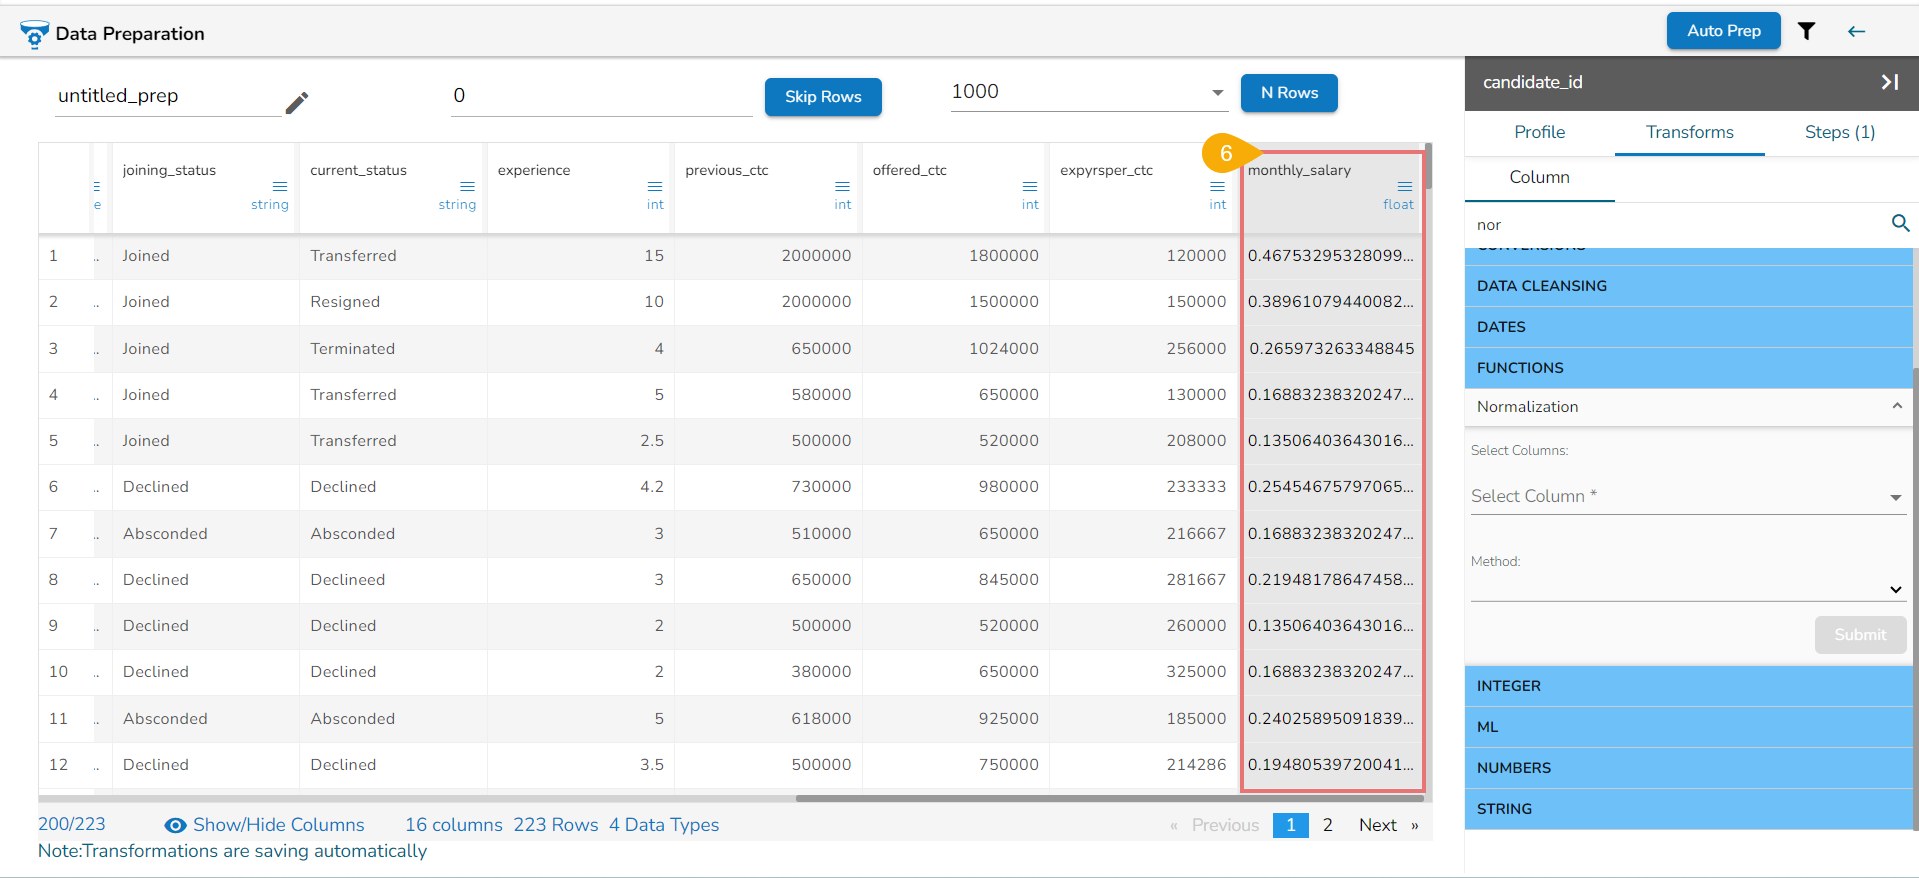
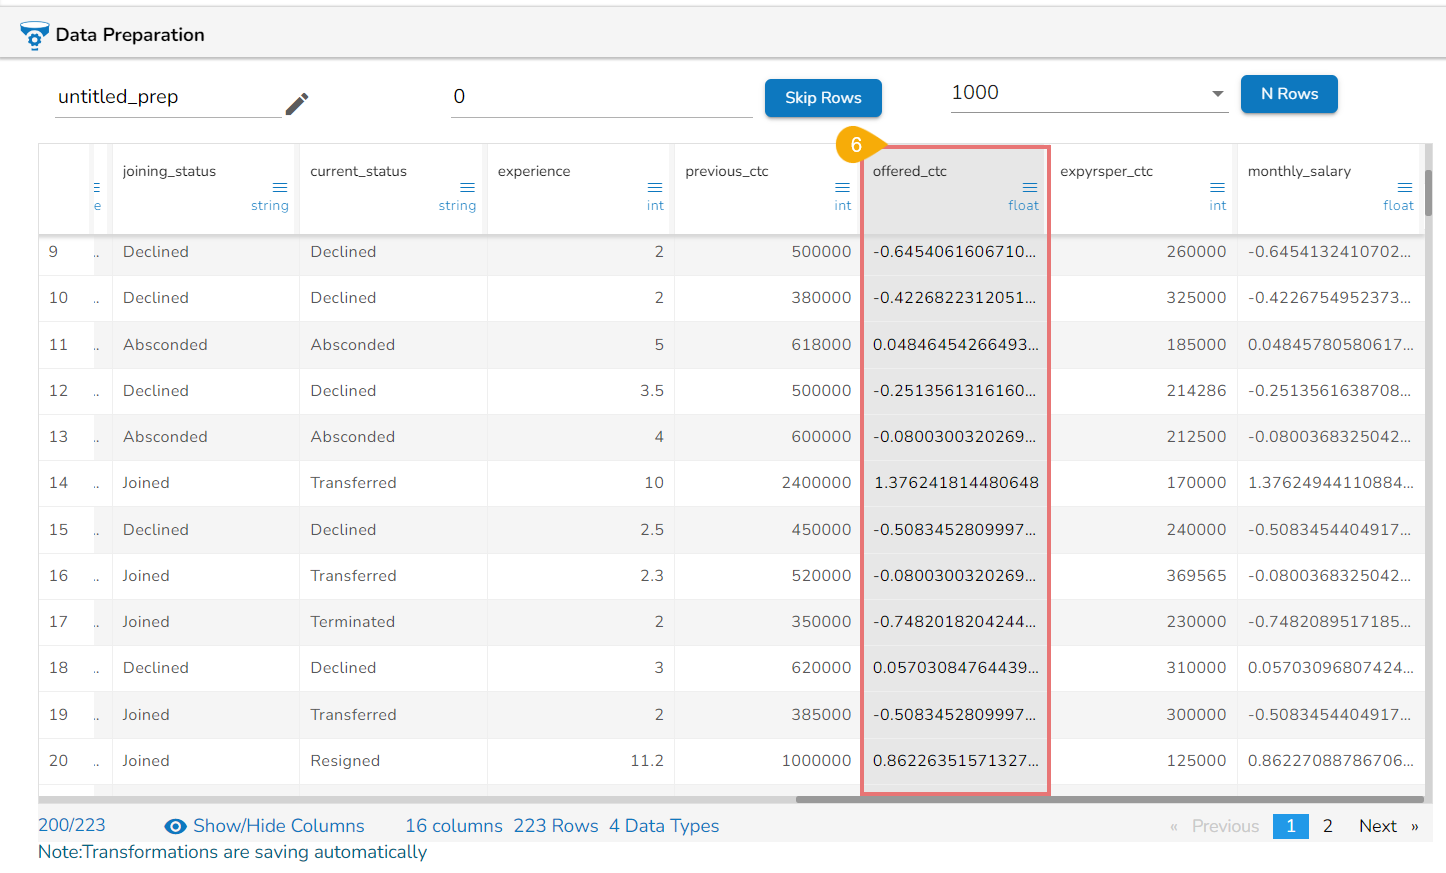
Normalization
Normalization is a process of scaling a measure or variable to a common range to facilitate comparisons or analysis. It is commonly used when dealing with measures that have different units or scales to bring them onto a consistent basis.
There are various methods to normalize measures, and the choice of method depends on the nature of the data and the specific requirements of the analysis. Here are a few commonly used normalization techniques:
Min-Max Normalization (Rescaling):
Formula: (x - min) / (max - min)
Rescales the measure to a range between 0 and 1 by subtracting the minimum value (min) and dividing by the range (max-min). This method preserves the relative ordering of the data.
Check out the given walk-through on how to apply Min-Max Normalization method.
Z-Score Normalization (Standardization):
Formula: (x - mean) / standard deviation
Standardizes the measure by subtracting the mean and dividing it by the standard deviation. This method transforms the data to have a mean of 0 and a standard deviation of 1. It preserves the shape of the distribution but can result in negative values.
Check out the given walk-through on how to apply Z-Score Normalization method.
Steps to perform Normalization Transform with both the Method:
Navigate to a dataset within the Data Prep framework.
Open the Transforms tab.
Select the Normalization transform.
Select columns by using the check boxes given next to the column names.
Select a Normalization Method using the drop-down menu.

Click the Submit option.
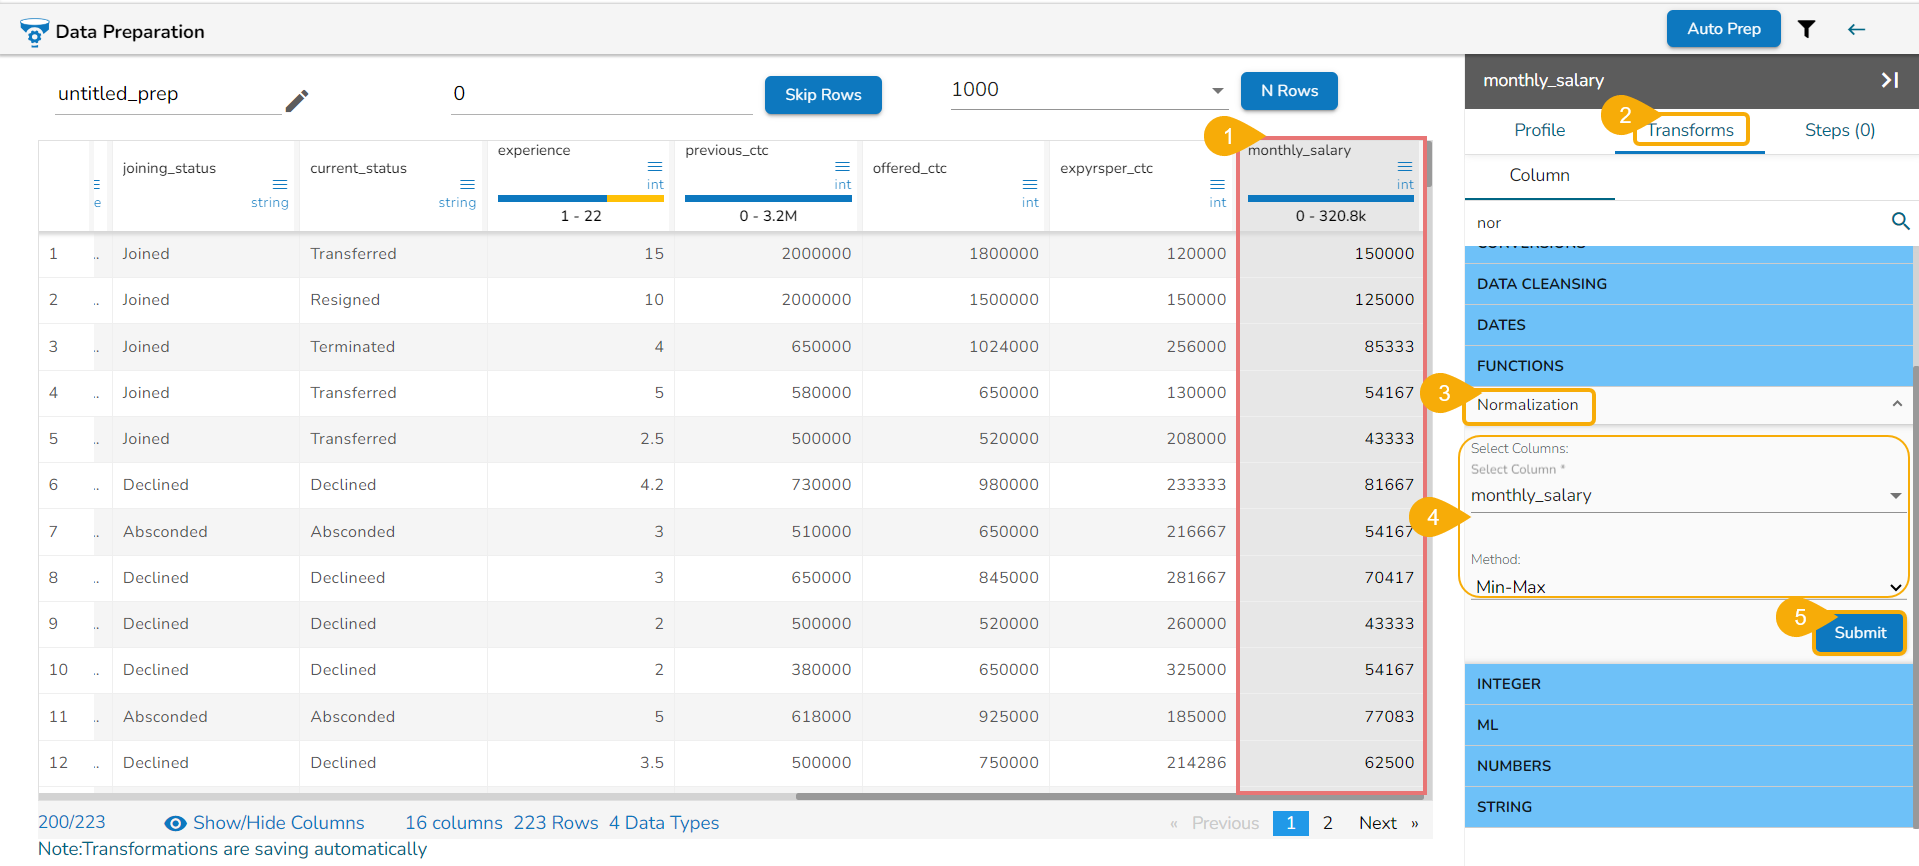
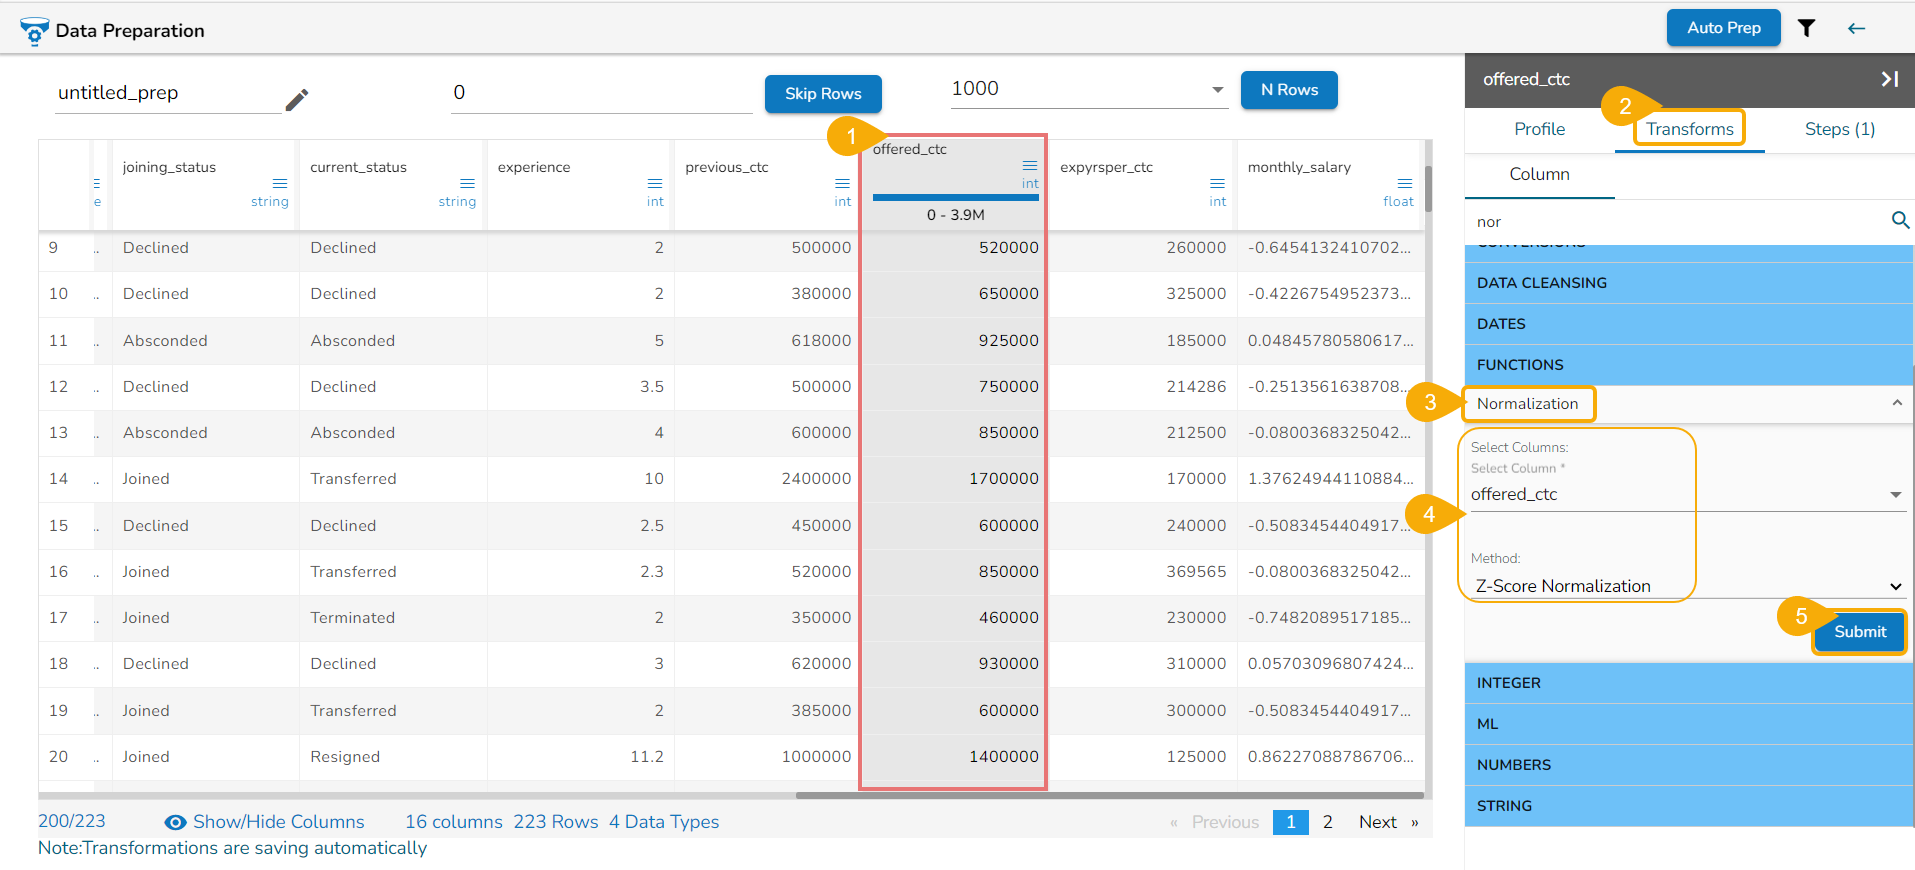
The column data will be changed based on the selected Normalization method.
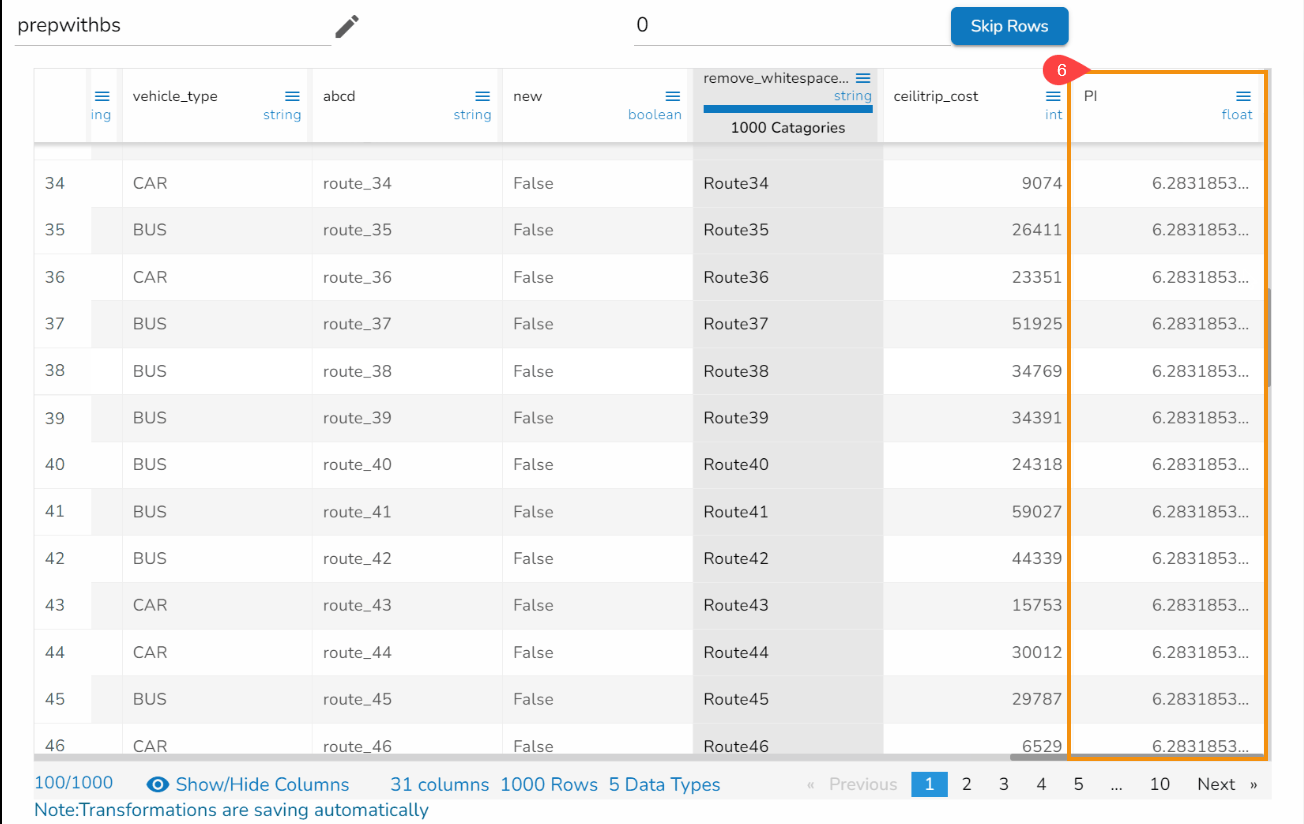
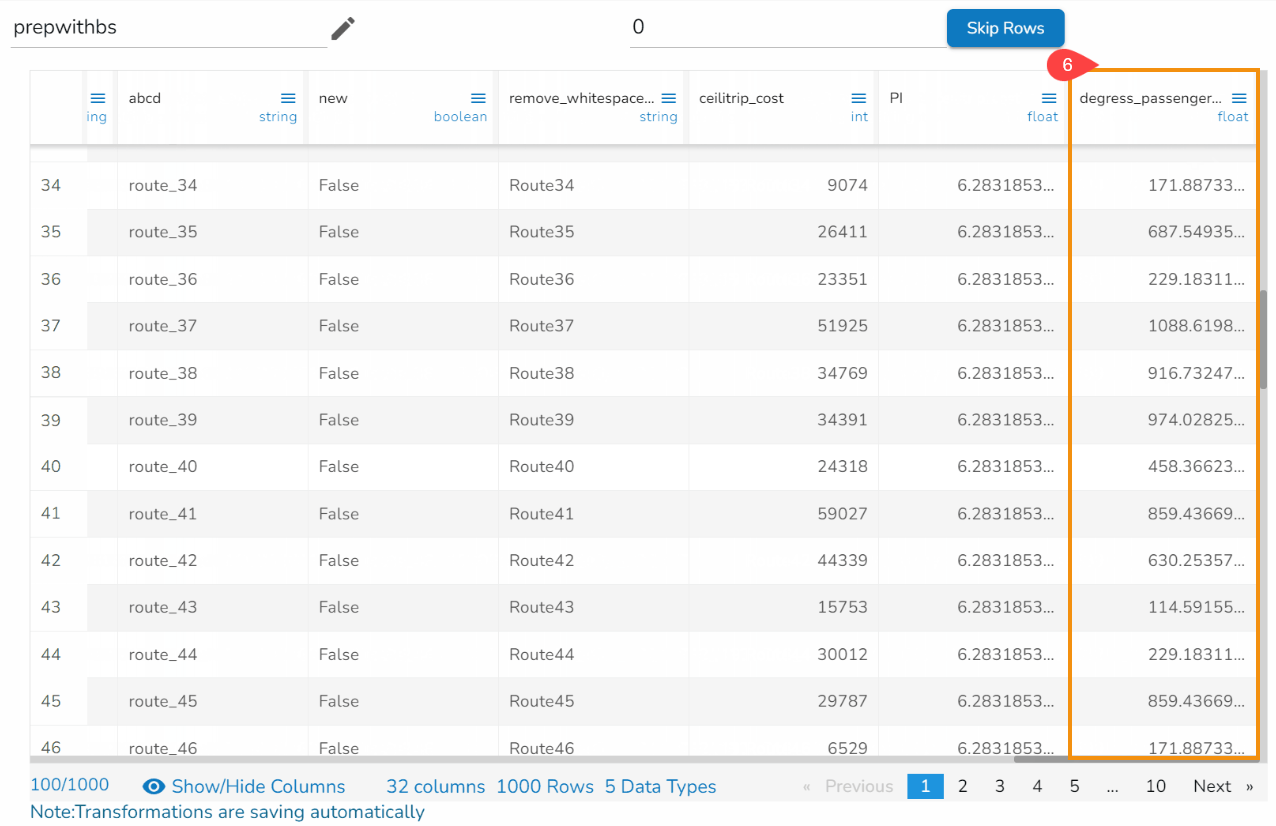
PI
The PI function generates the value of pi to 15 decimal places: 3.1415926535897932.
Check out the given illustration on how to apply the PI transformation.
Steps to perform the PI transformation:
Select the column from the dataset using the Data Preparation framework.
Open the Transforms tab.
Select the PI transform from the FUNCTIONS category.
Provide the following information:
Provide a name for the New Column.
Provide value that behaves as the multiplicand.
Click the Submit option.
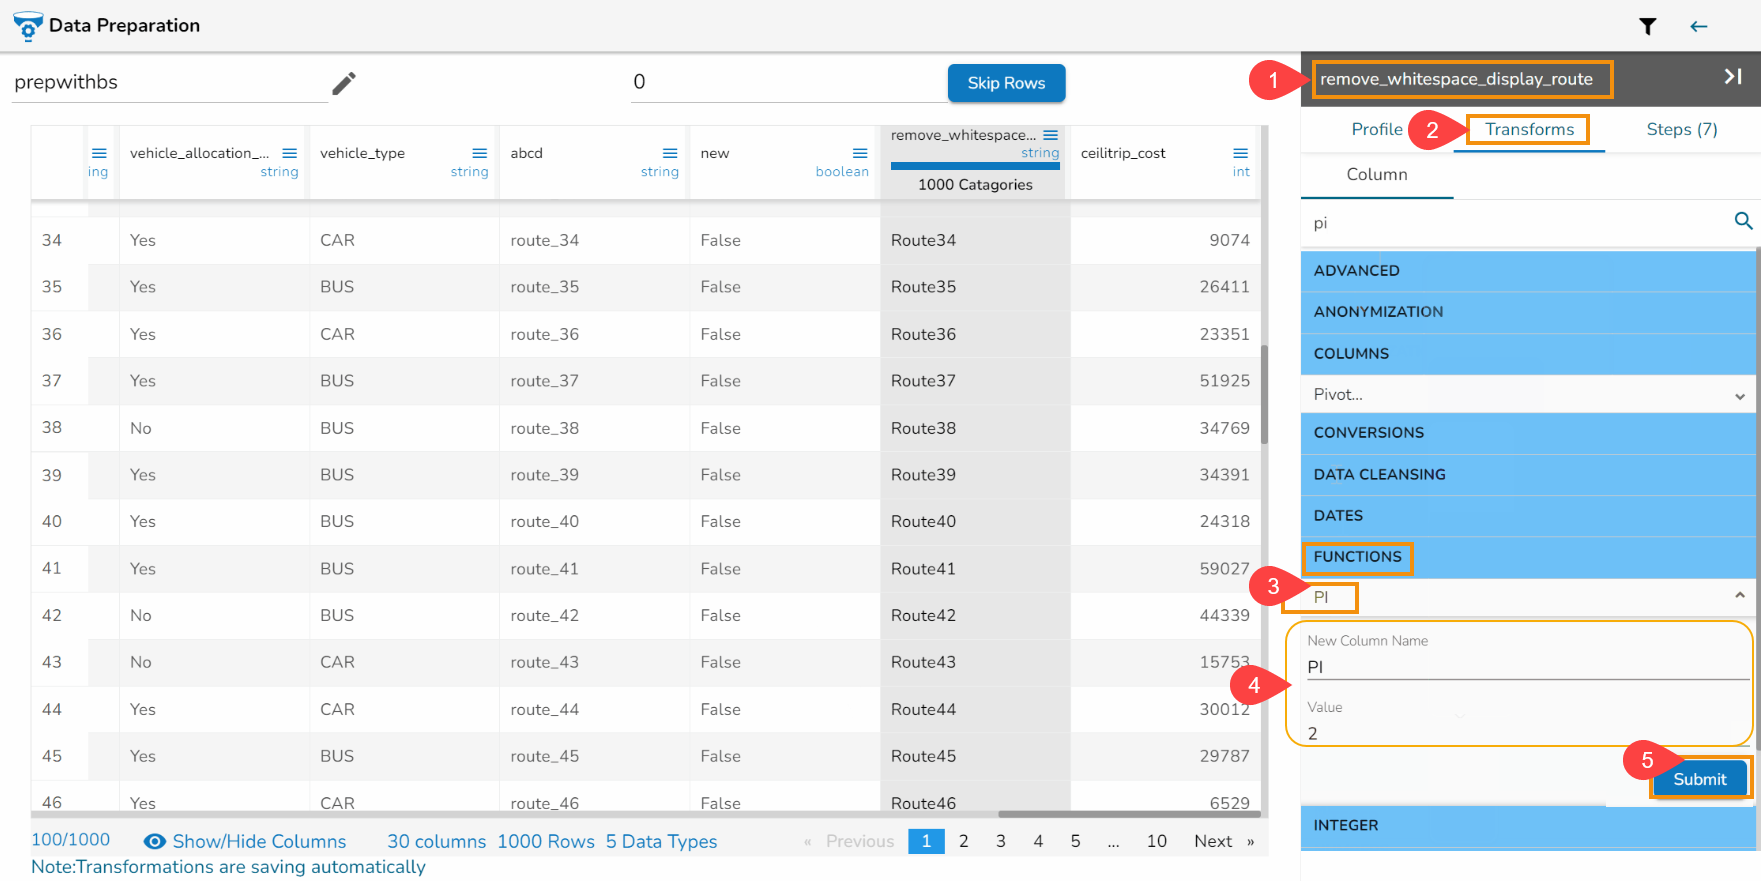
Result will come in a newly added column where it will display pi to 15 decimal places. E.g., Suppose values passed as 2 then the calculation will be as pi * 2.
Power of Column
The Power of Column data transform is a data manipulation technique used to raise a specific column of numerical data to a certain power. It is commonly employed in data preprocessing or data analysis tasks to modify the data in a meaningful way.
The general formula for the "Power of Column" transform is:
New Value=Original Value 〖^power〗
E.g., If value present in a column is 2, and the passed value as power is 3 then the result is 8.
where:
The New Value is the transformed value of the data after applying the power operation.
Original Value is the value in the original column.
Power is the exponent to which the "Original Value" is raised.
This transformation can be applied to any column in a dataset that contains numerical values. It is often used to address certain data distribution issues or to amplify or attenuate the values in the column, depending on the value of the power.
Steps to perform the Power of Column transformation:
Select a numerical column from the dataset within the Data Preparation framework.
Open the Transforms tab.
Select the Power of Column transform from the FUNCTIONS category.
Provide the following information:
Enable the Create New Column (optional) to create a new column with the result values.
Provide value that will act as power on the values of the selected column.
Click the Submit option.
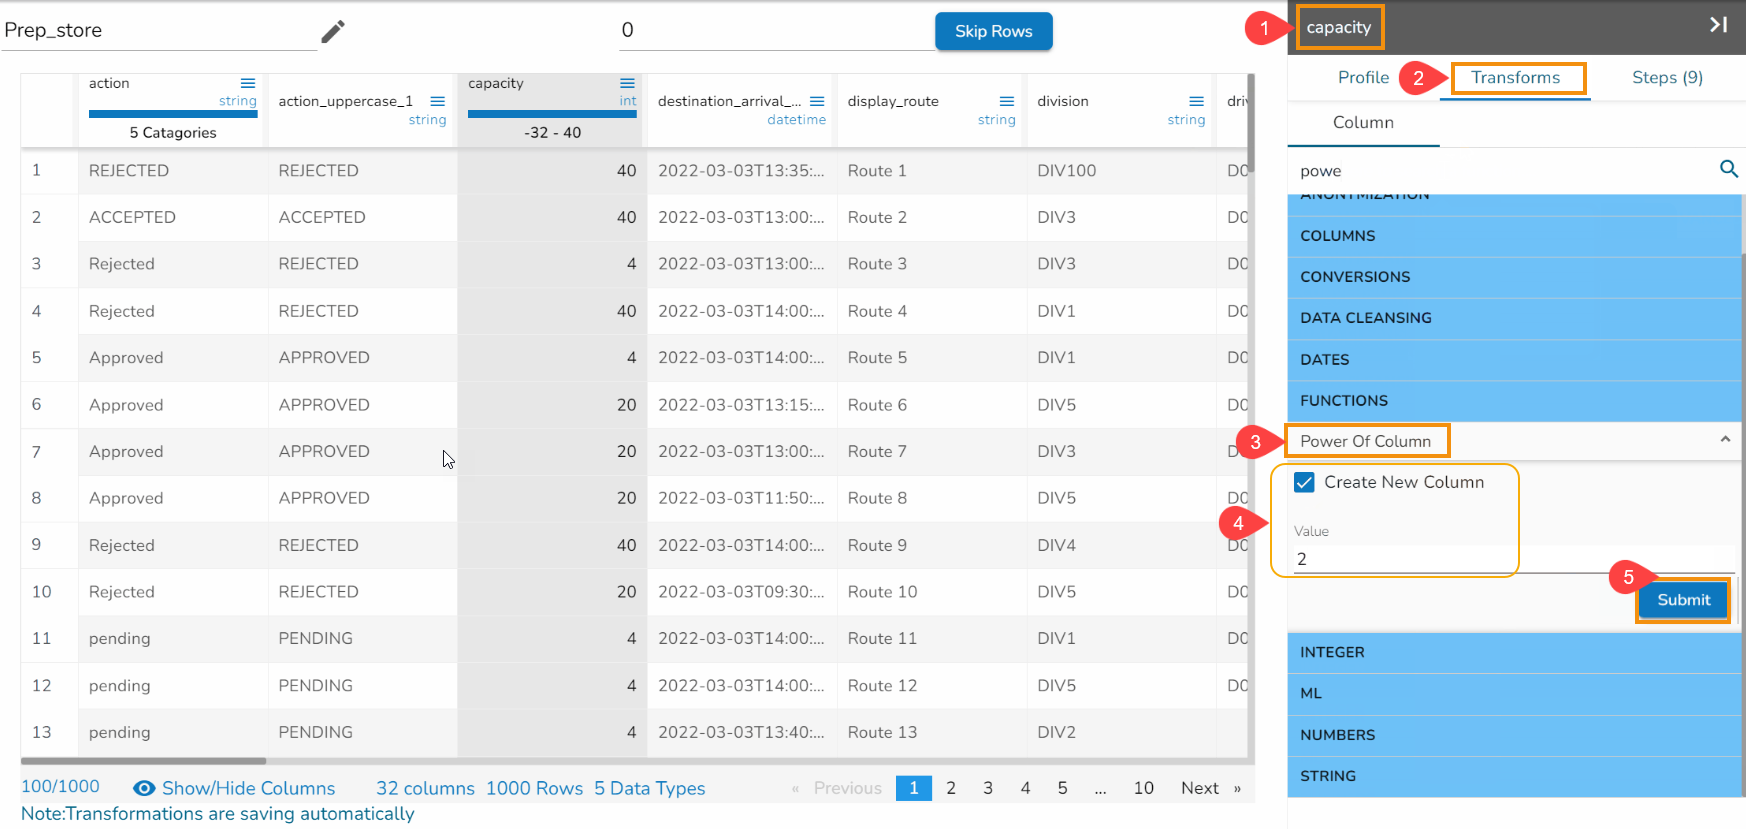
Result will come in a different column or update on the same column (based on the configuration performed for this transform.
Radians To Degree
This transformation helps to compute the degrees of an input value measuring the radians of an angle. The value can be a Decimal or Integer literal or a reference to a column containing numeric values.
Please Note: Input units are considered in radians, Multiply the value by 57.2957795
Check out the given illustration on how to use Radians To Degree transform.
Steps to perform the Radians To Degree transformation:
Select a dataset within the Data Preparation framework.
Select the Transforms tab.
Select the Radians To Degree transform from the FUNCTIONS category.
Do the required configuration for the Radians to Degree transform:
Enable the Create a New Column option to create a new column with the transformed data.
Select one or multiple columns that need to get converted (Use Numerical Columns like int, float, decimal, etc.).
Click the Submit option.
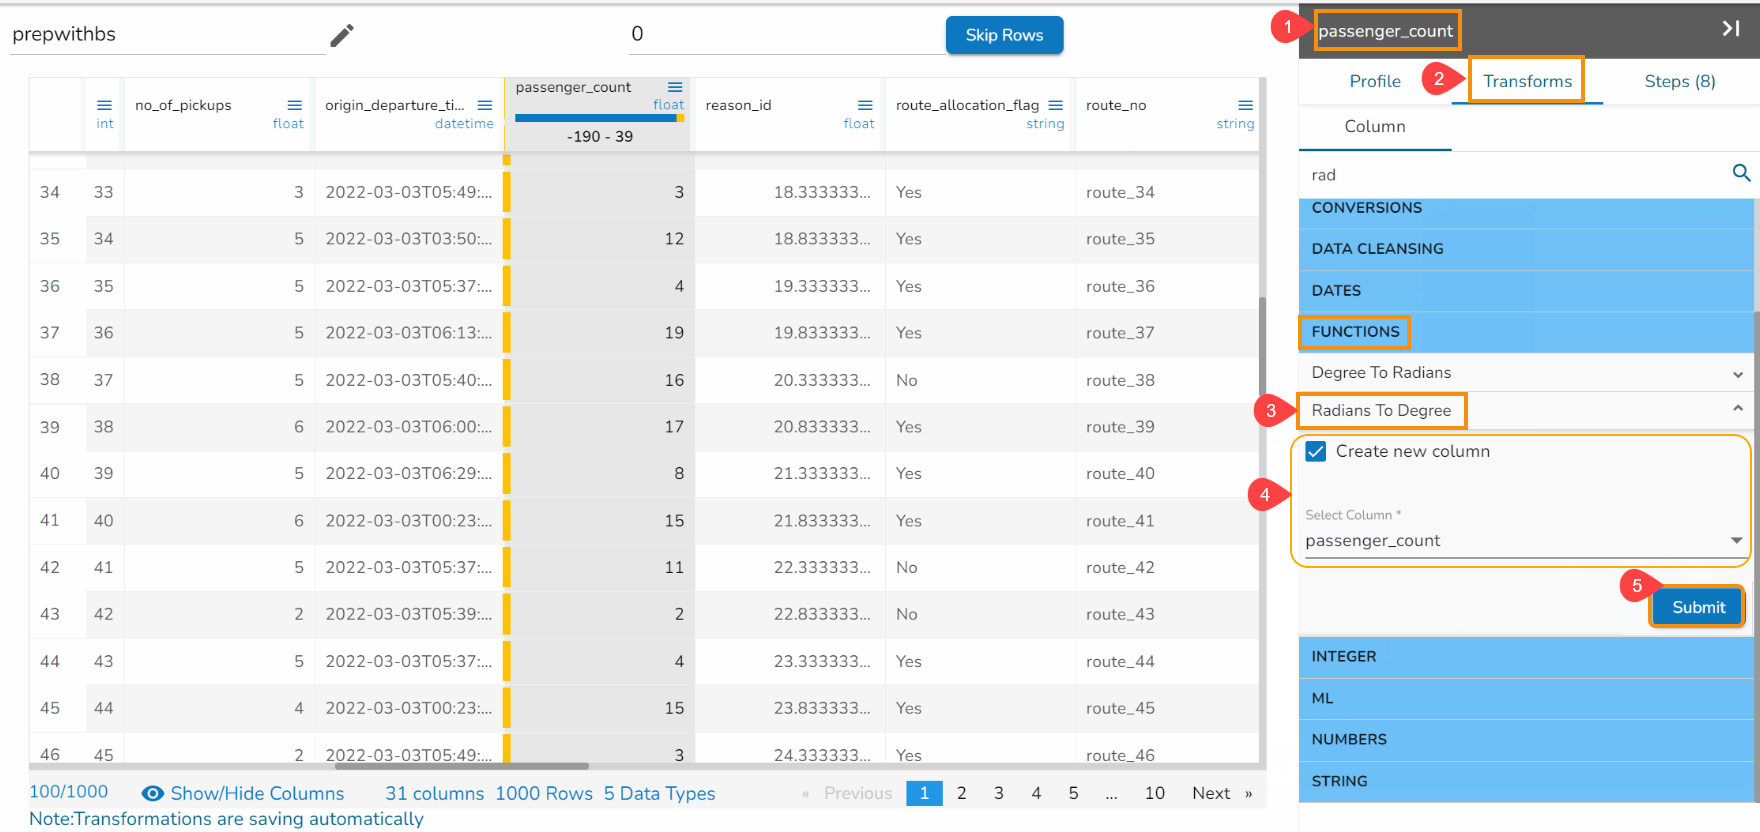
Result will come as a different column with a prefix of 'degree' for the selected column by converting it into degree (The calculation will be done by multiplying the value by 57.2957795).
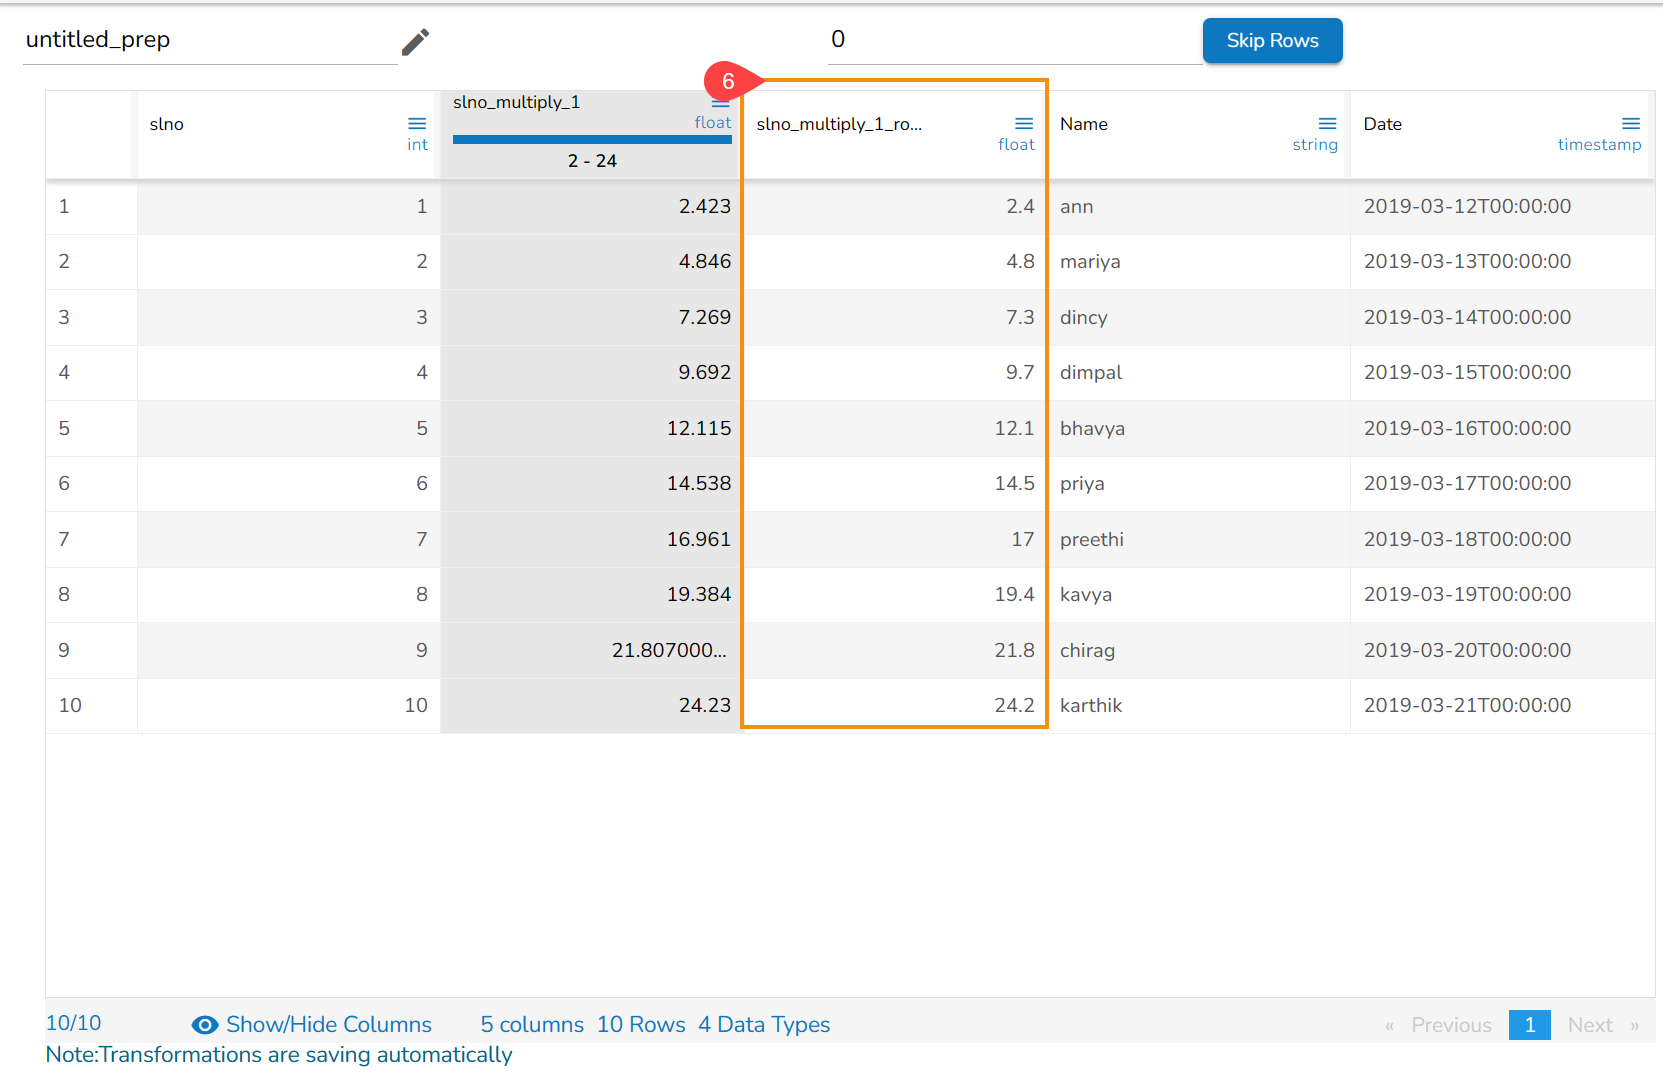
Round Values for Columns
This transformation rounds input value to the nearest integer and it supports multiple columns at a single time.
Steps to perform the transformation:
Select a dataset within the Data Preparation framework.
Select the Transforms tab.
Select one or multiple columns from the dataset where the round need to be performed.
Select required precision.
Click the Submit option.
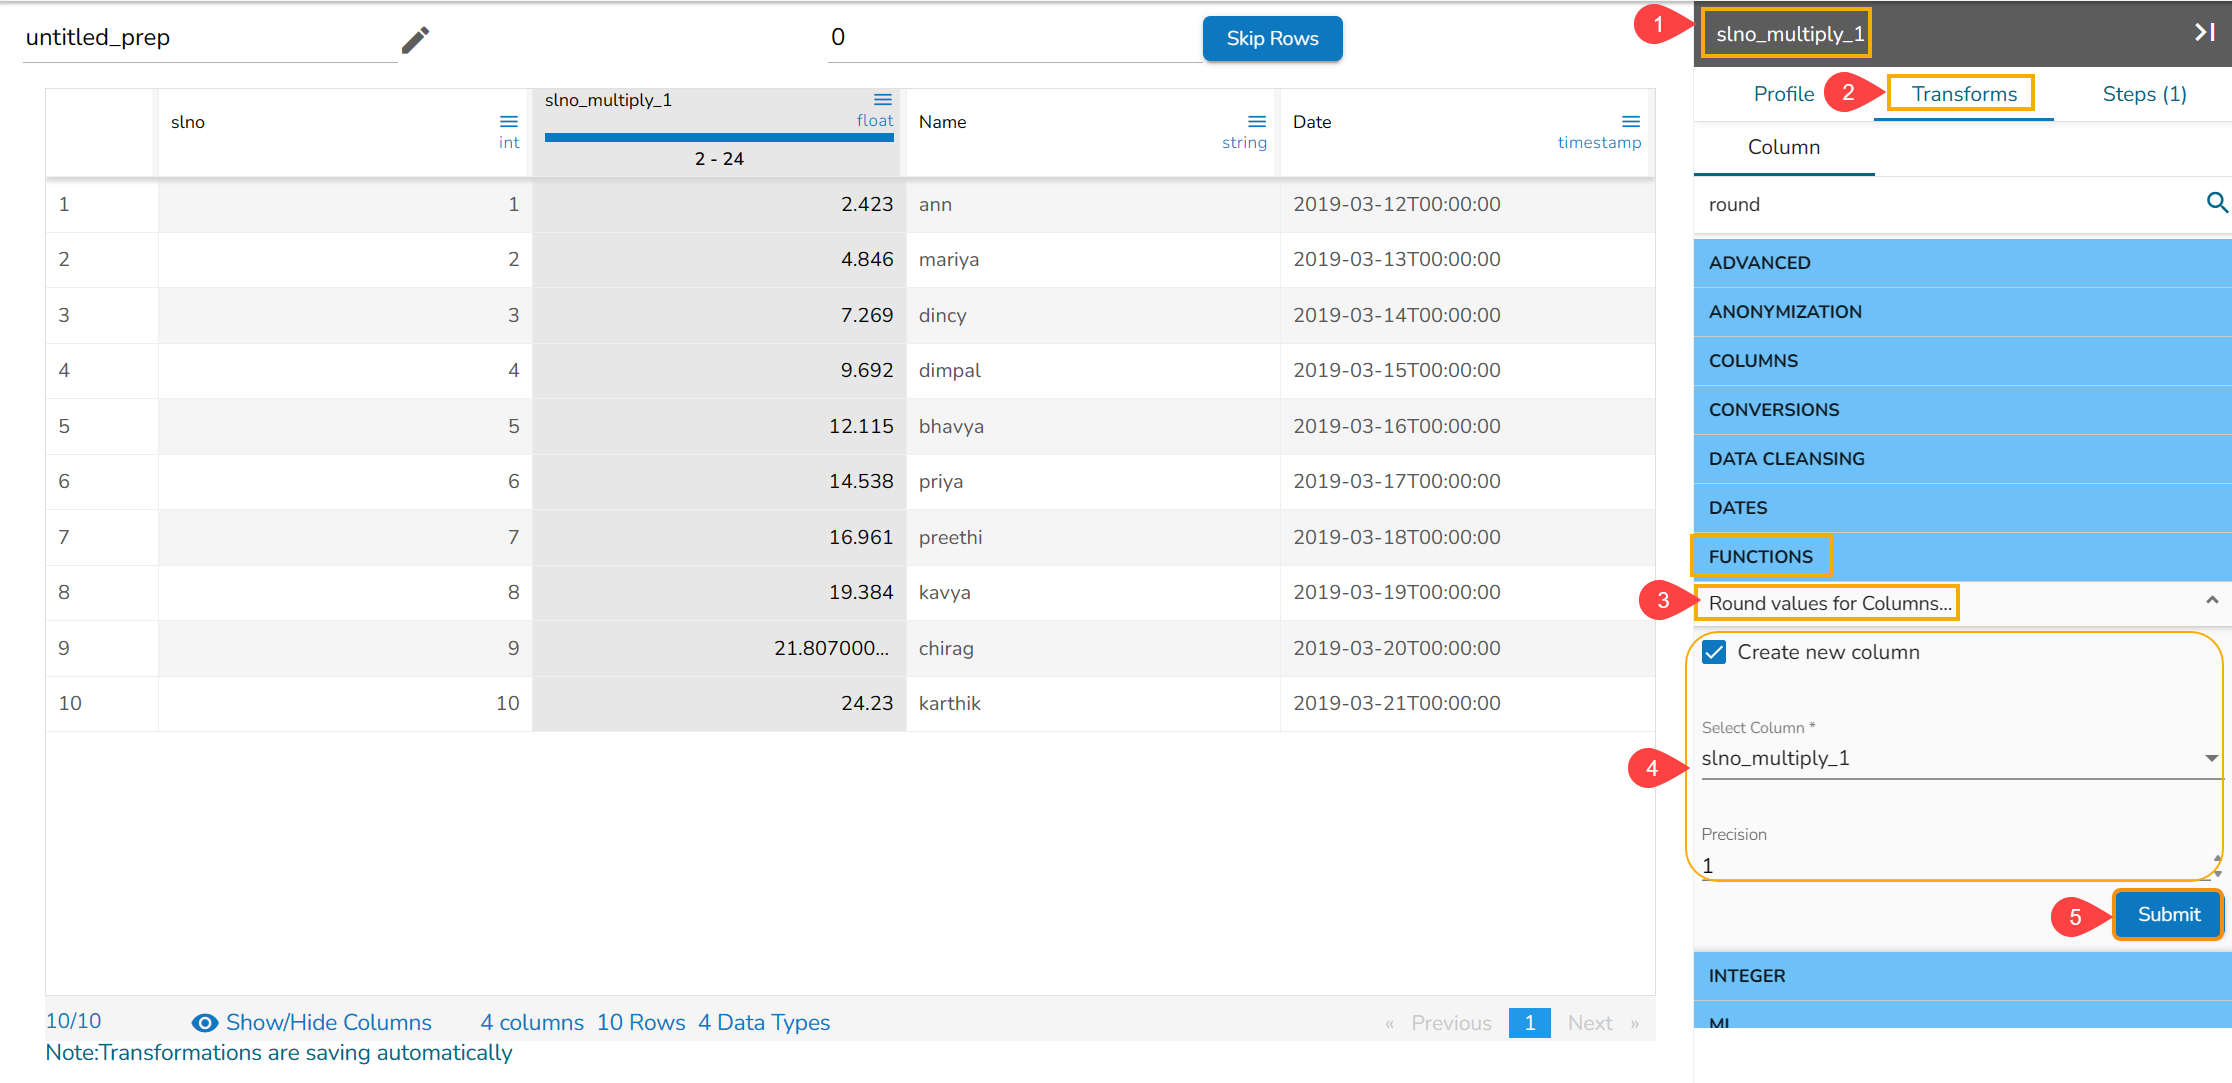
Result will come as a new column where rounded based on the precision value and input value round to the nearest integer.
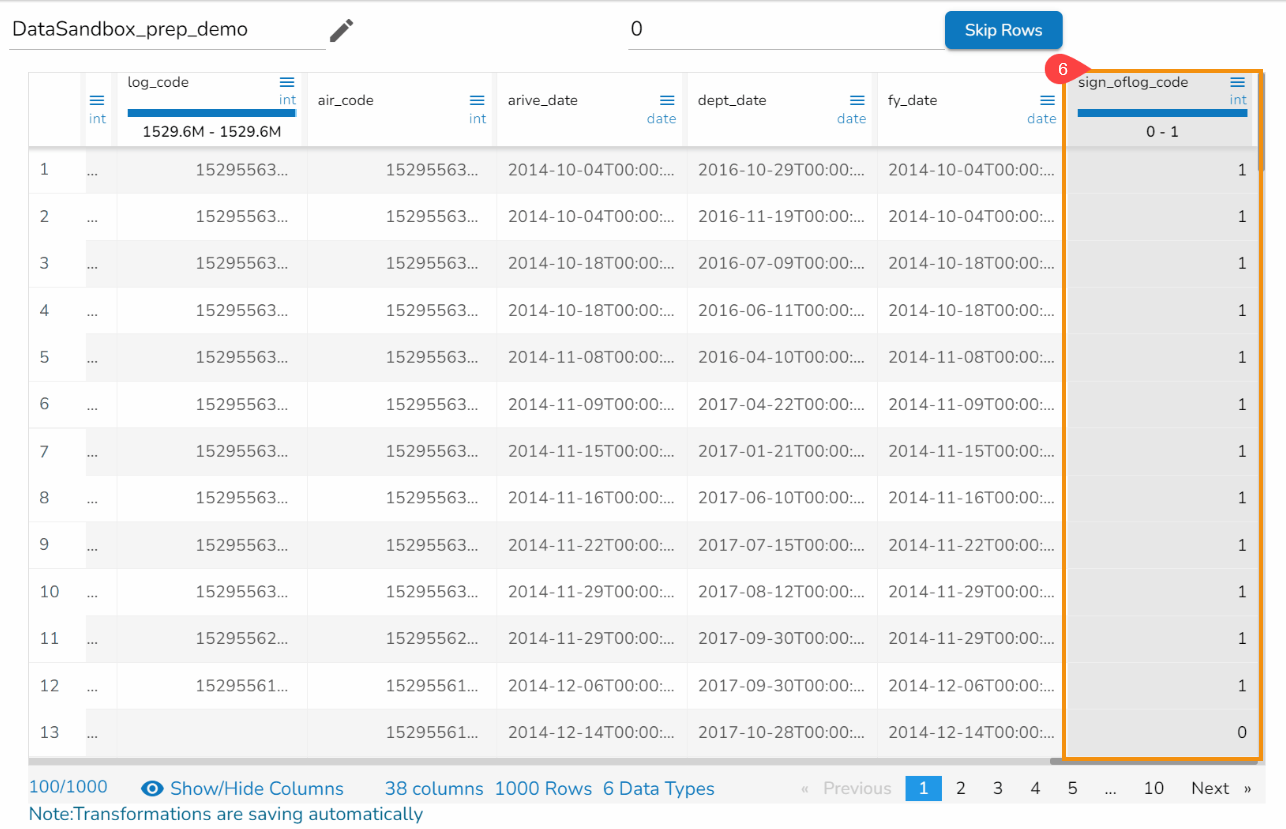
Sign of Columns
This transformation computes the positive or negative sign of a given numeric value. The value can be a Decimal or Integer. Please consider the following:
For positive values, this function returns 1.
For negative values, this function returns -1.
For the value 0, this function returns 0.
Check out the given illustration on how to use the Sign of Columns transform.

Steps to perform the transformation:
Open a dataset within the Data Preparation framework.
Open the Transforms tab.
Select the Sign of Columns transform from the FUNCTIONS.
Select one or multiple columns where the prefix is to be added (it can be any number-based columns).
Click the Submit option.
The result will appear as a new column where the function returns 1 for positive values, -1 for negative values, and 0 for value 0.
Simplify Text
The Simplify Text transform allows the user to perform various simplifications on a text column.
The supported transforms under this Transformation are:
1. Normalize text: By selecting this option the text gets transformed to lowercase, remove punctuation and accents, and perform Unicode NFD normalization (Café -> cafe).
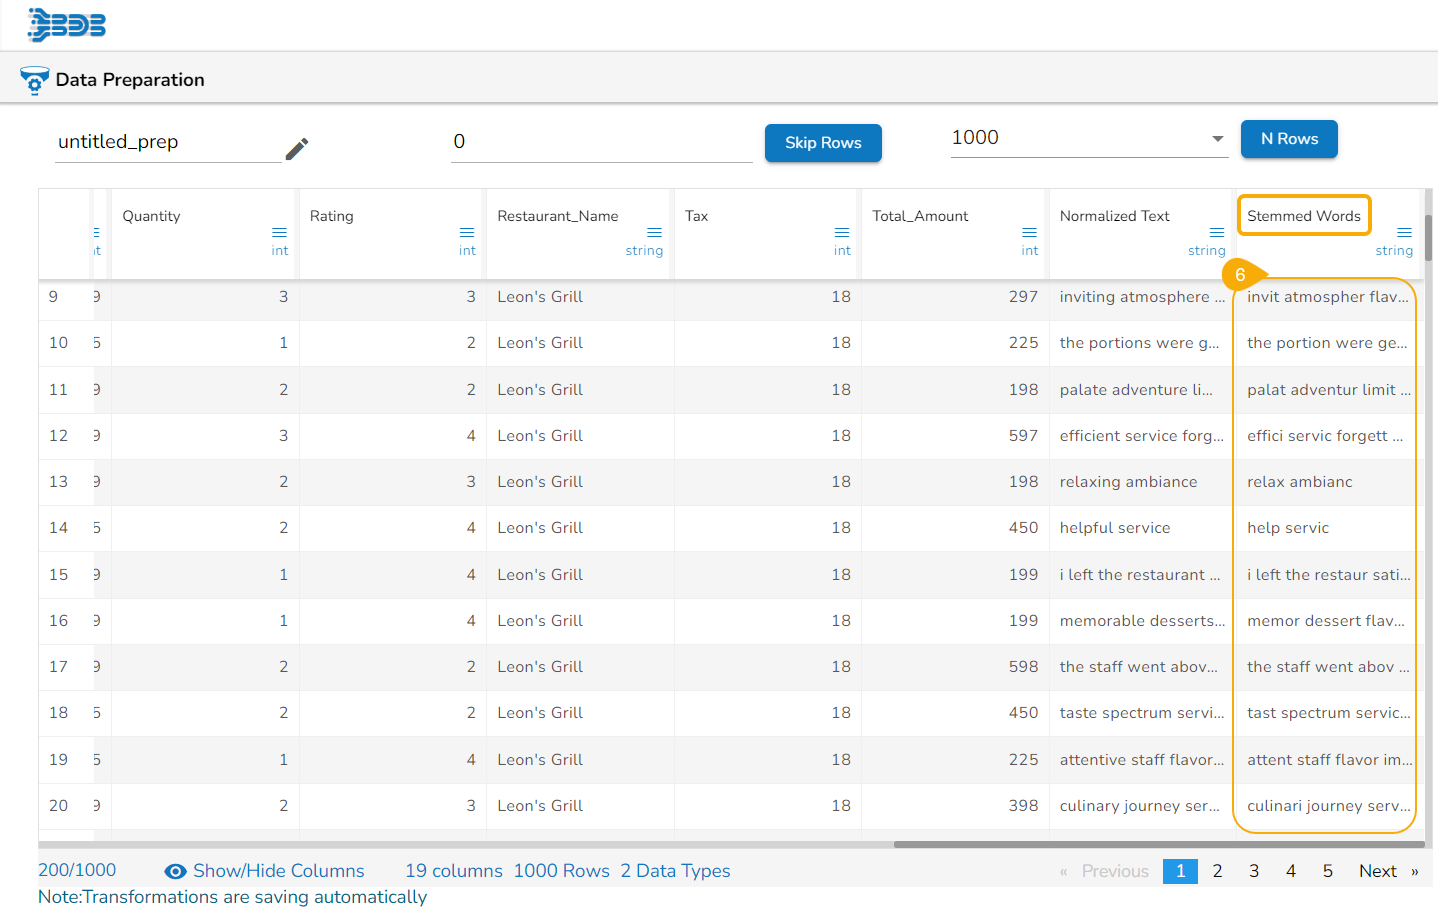
2. Stem words: Transform each word into its “stem”, i.e. its grammatical root. For example, the word grammatical is transformed into 'grammat'. This transformation is language-specific.
3. Stop words: Remove so-called “stop words” (the, I, a, of, …). This transformation is language-specific.
4. Sort words alphabetically: Sort all words of the text. For example, 'the small dog' is transformed into 'a dog small the', allowing strings containing the same words in a different order to be matched.
Check out the given walk-through on how to use the Simplify Text transform.
Steps to perform transformation:
Select a text containing a column (string datatype).
Open the Transforms tab.
Provide a name for the new column.
Select the required method using the given check box.
Click the Submit option.
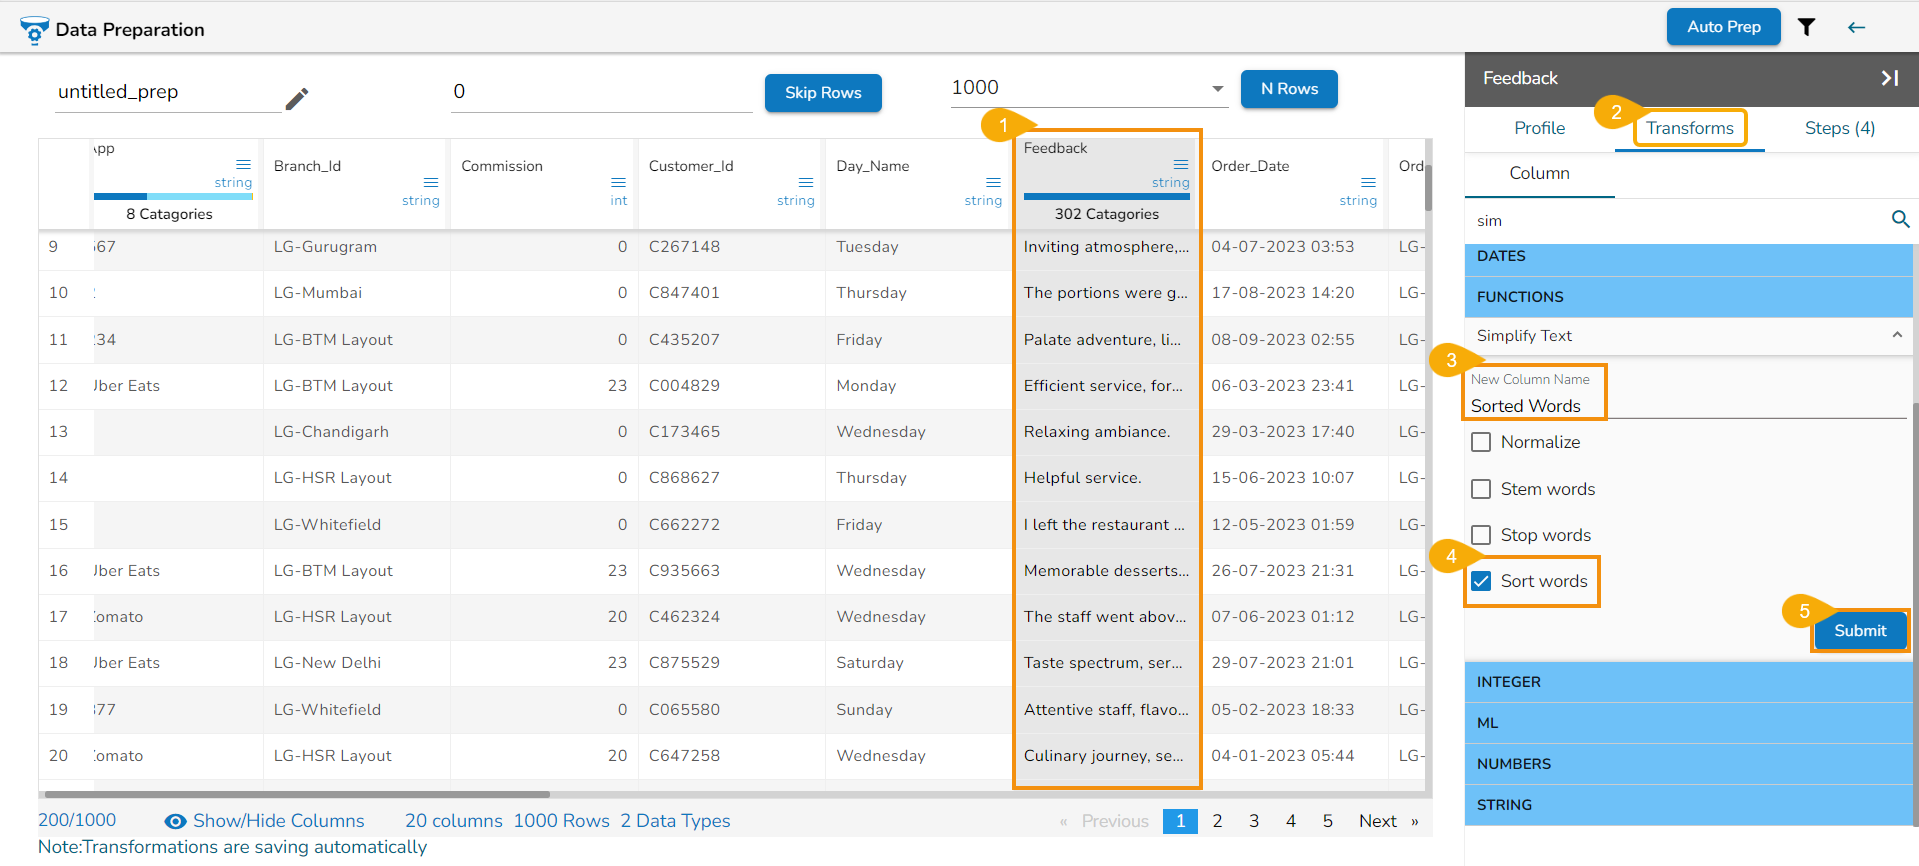
The result column will be created with the given name by making the required changes based on the selected method.
Split Email
The Split Email transformation splits an e-mail address into the local part (before the @) and the domain part (after the @).
Check out the given walk-through on how to use Split Email transform.
Steps to perform the transform:
Select a Column containing the Email values.
Navigate to the Transforms tab and click on the Split Email transform.
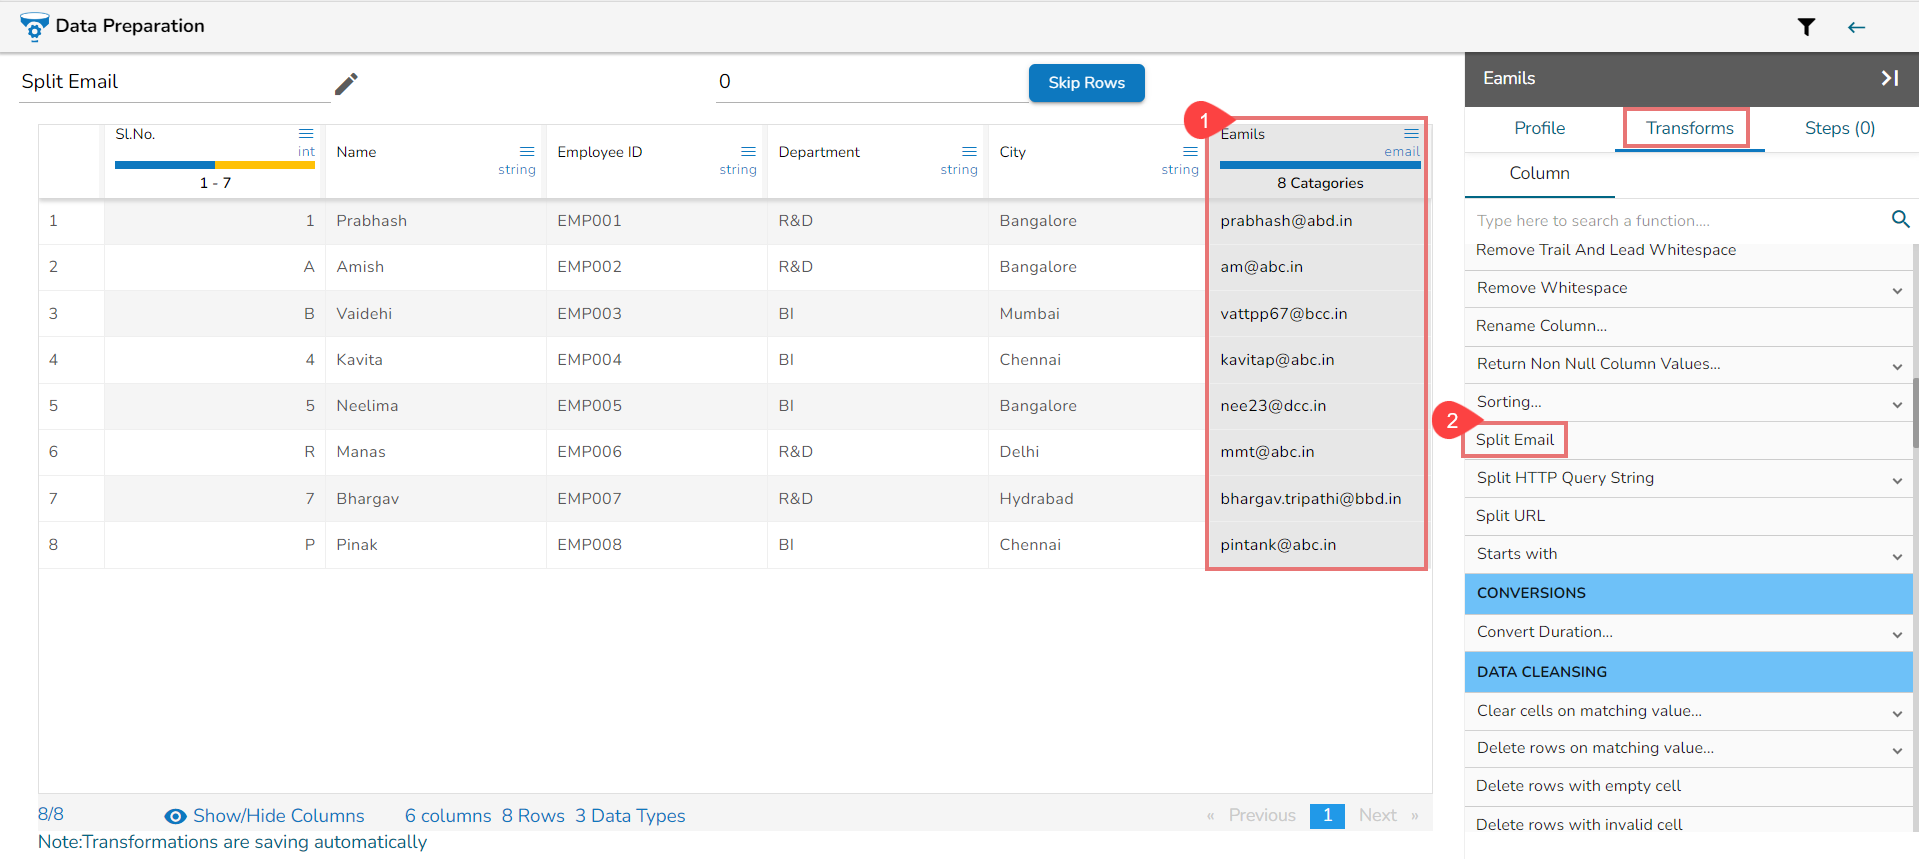
It will create two new columns as local_part and domain_part.
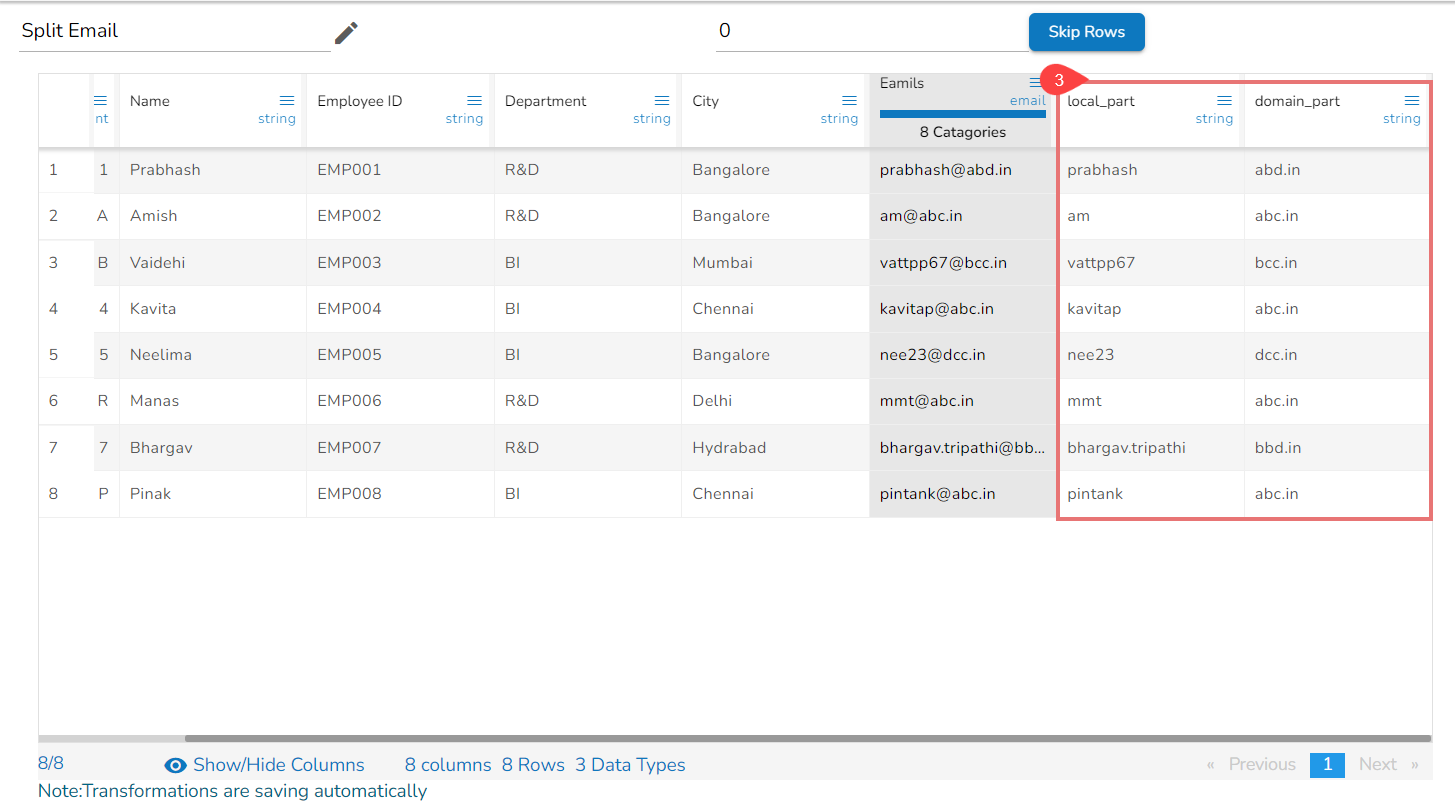
Please Note: If the input does not contain a valid email address, it will throw an error.
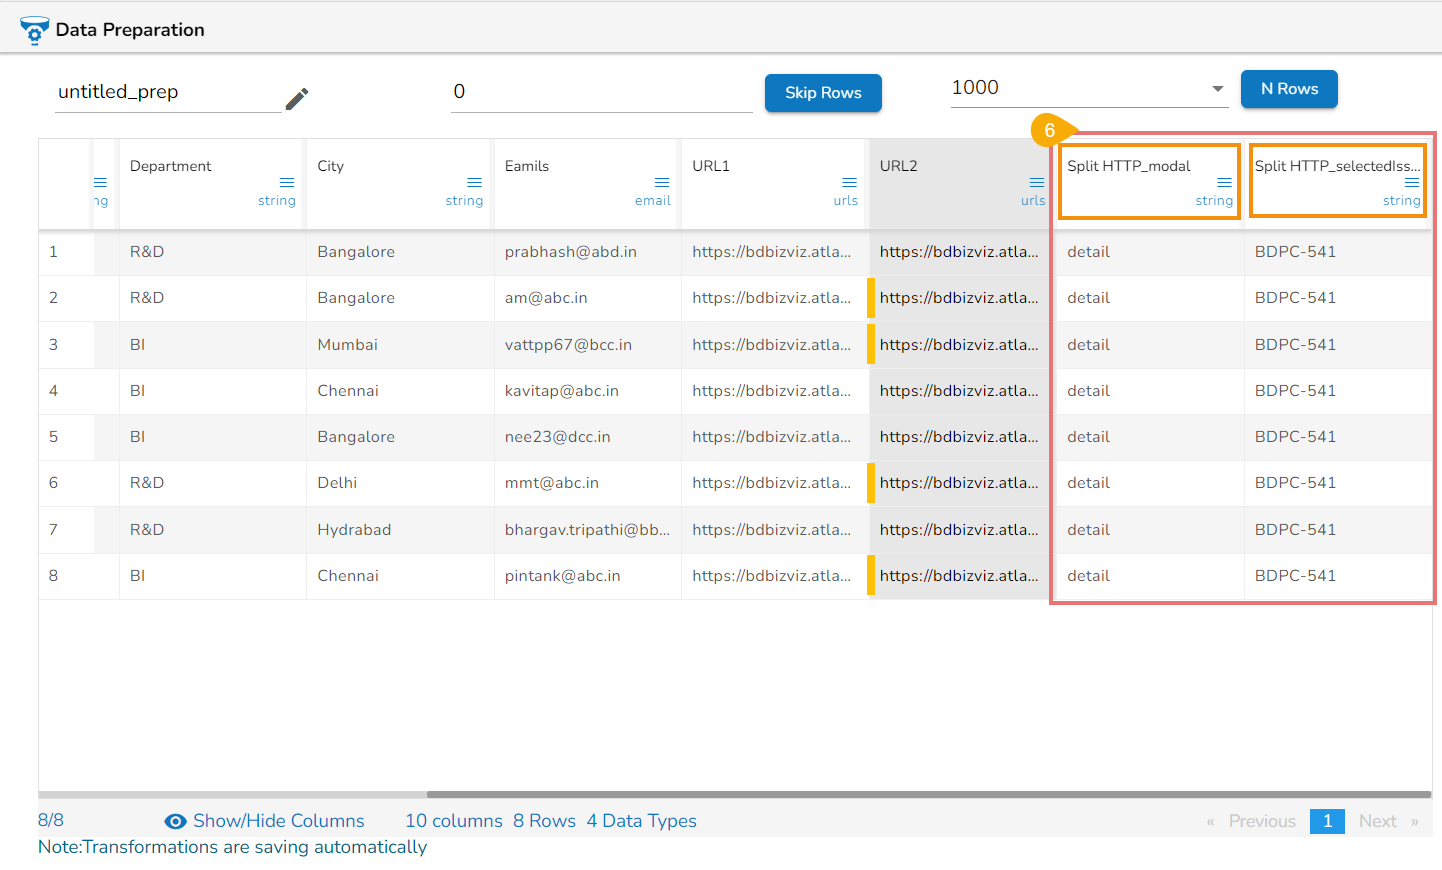
Split HTTP Query String
This transformation splits the elements of an HTTP query string. The query string is the part of the URL that comes after the `?` in the string.
Consider the following URL as an example in this context:
Query String: modal=detail&selectedIssue=BDPC-541
Output Column prefix: SplitURL_
Then the Output comes as: SplitURL_modal SplitURL_selectIssue
detail BDPC-541
Check out the given walk-through on how to use the Split HTTP Query String data transform.
Steps to perform the Split HTTP Query String transform:
Select a URL column with query string.
Open the Transforms tab.
Select the Split HTTP Query String transform from the Functions category.
Provide a Prefix for the Output Column.
Click the Submit option.
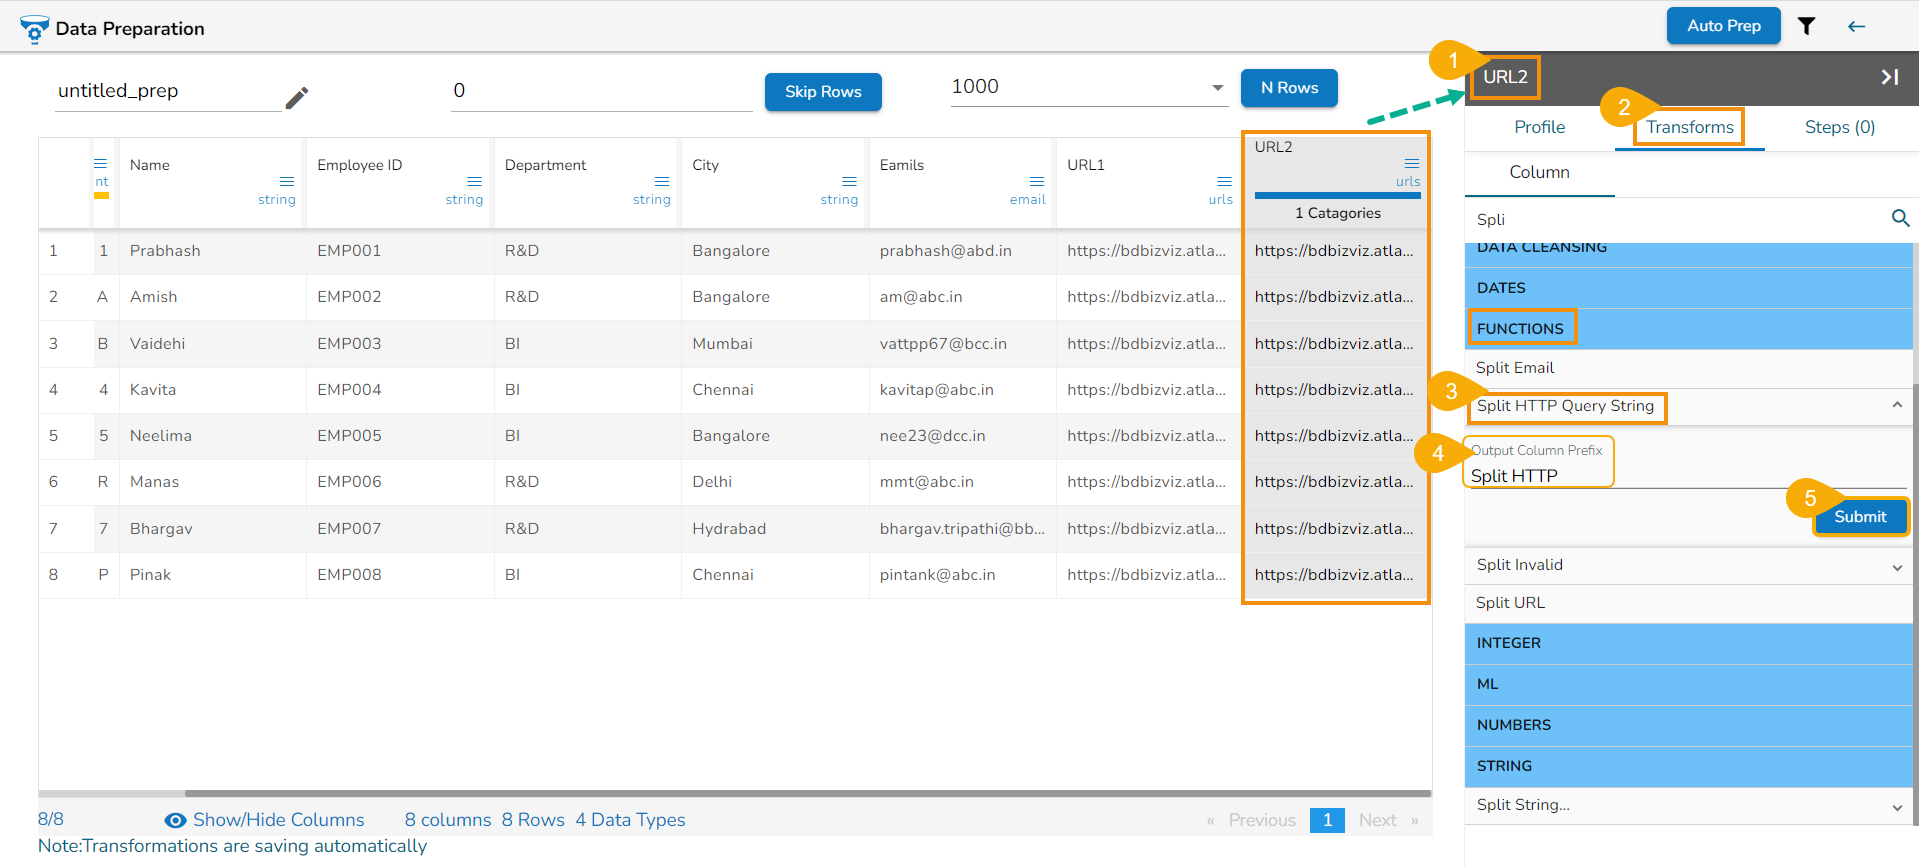
New columns will get created with the given prefix and the key of the HTTP Query string chunk.
Given Prefix for the output column: Split HTTP_
Then the Output comes as: Split HTTP_modal Split HTTP_selectIssue
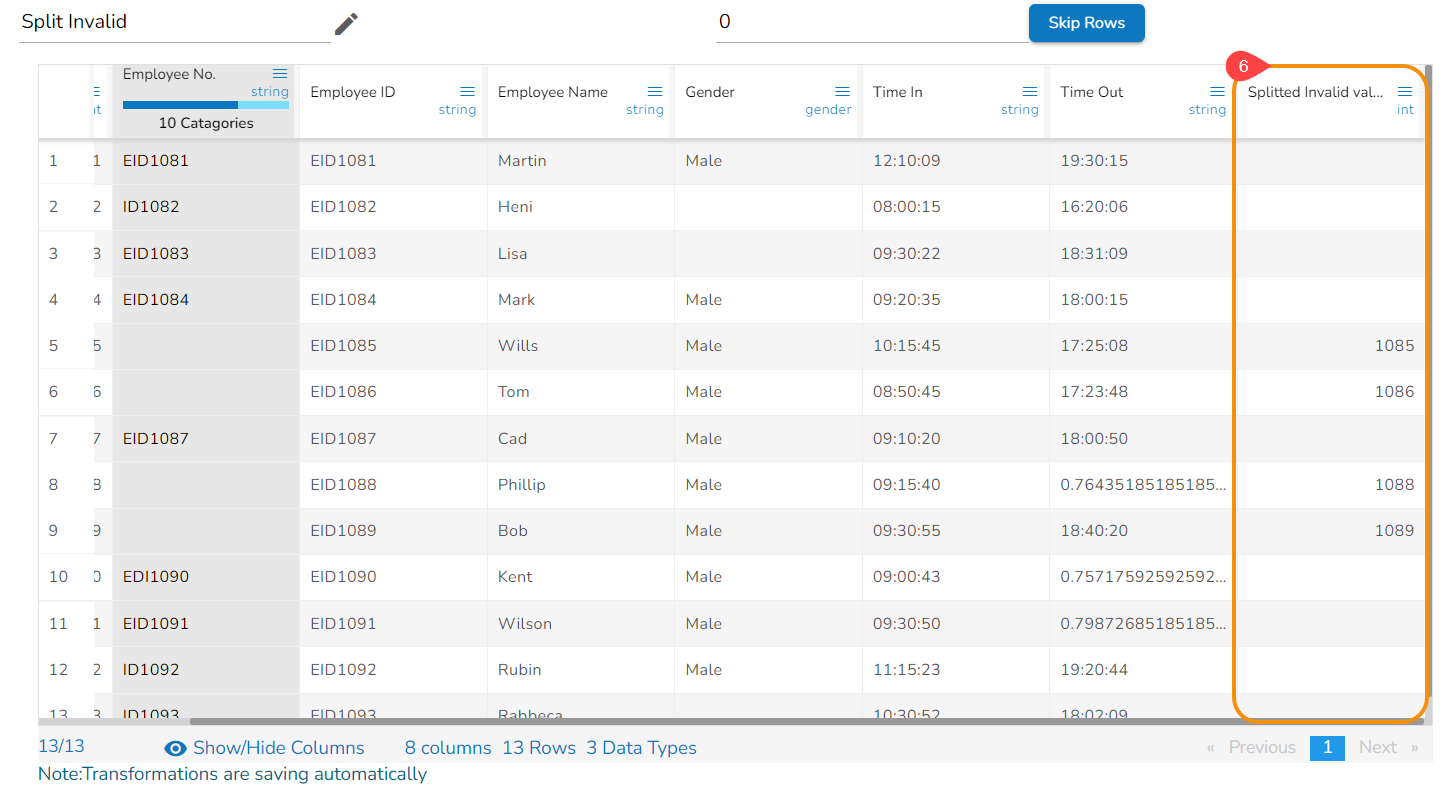
Split Invalid
The Split Invalid data transform refers to a data preprocessing technique where the input data is validated for correctness and completeness. During this step, the data is checked against predefined rules or constraints to identify and segregate the invalid or inconsistent records.
Check out the given walk-through on how to use the Split Invalid data transform.
Navigate to a dataset in the Data Preparation framework.
Open the Transforms tab.
Click the Split Invalid transform from the FUNCTIONS category.
Provide the following information:
Data Type
New Column Name
Click the Submit option.
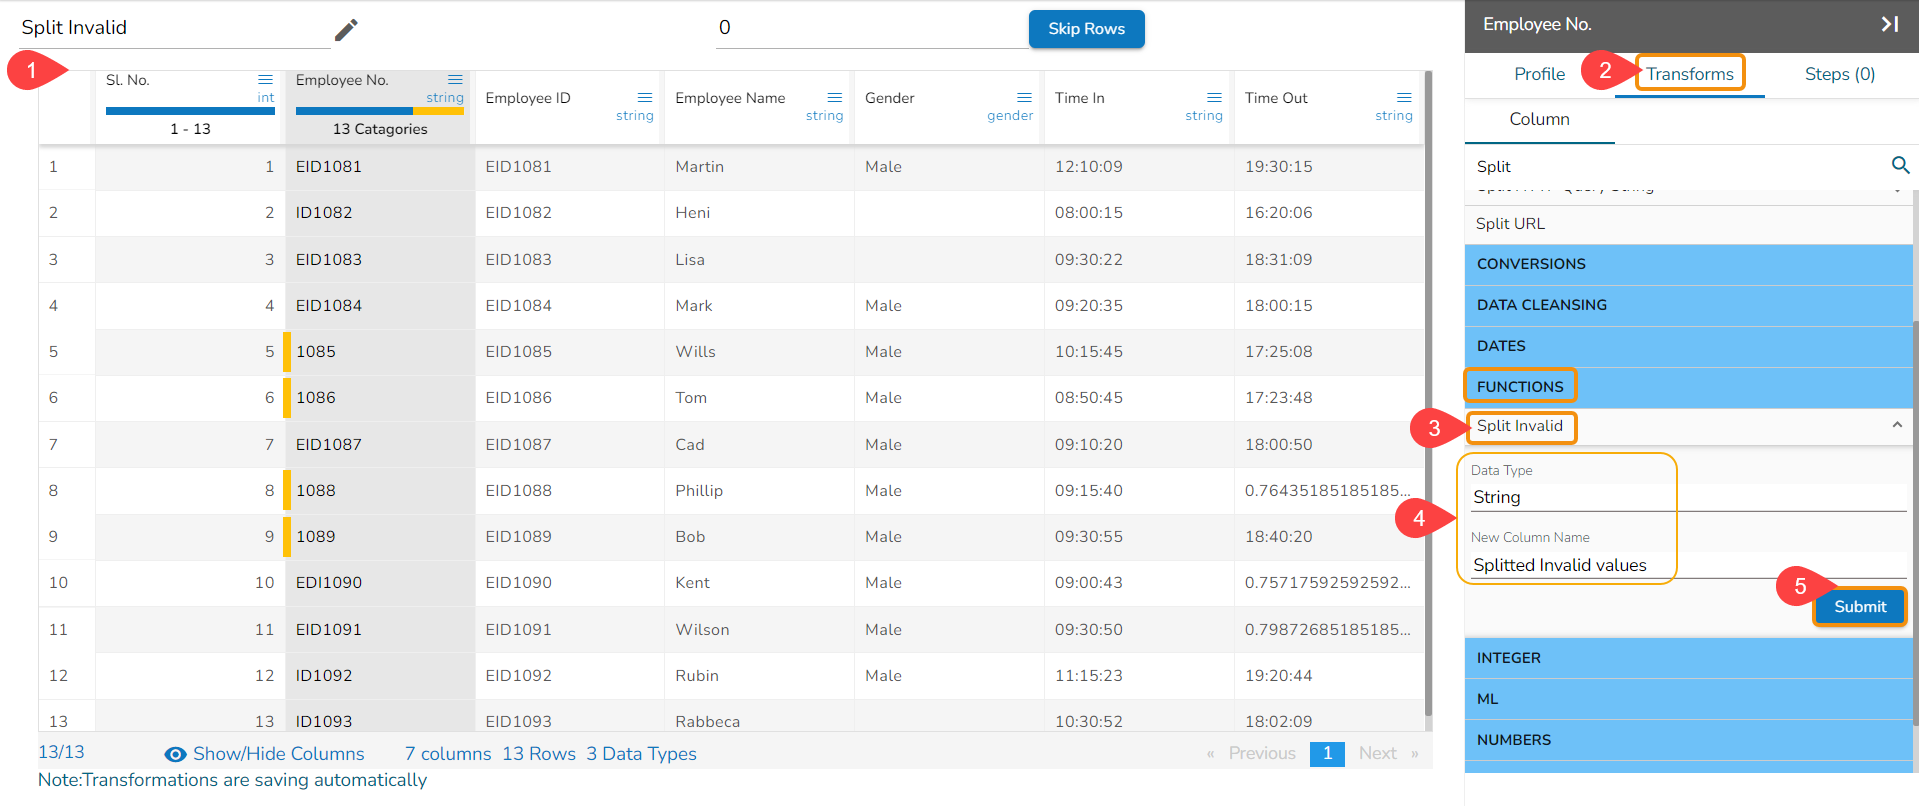
As a result, the invalid values will be extracted in the newly added column from the concerned column.
Split URL
This transform splits the elements of an URL into multiple columns. A valid URL contains the following format scheme ://hostname[:port][/path][?query string][#anchor]
Output -> It will split into multiple columns prefixed by the input column name.
E.g., URL -> https://www.google.com/search?q=query#results
Then Output as:
URL_scheme
URL_domain
URL_path
URL_querystring
http
www.google.com
/search
q=query
Check out the given walk-through on how to use Functions Split URL.
Steps to perform the Split URL transformation:
Select a URL column.
Open the Transforms tab.
Click the Split URL transform.
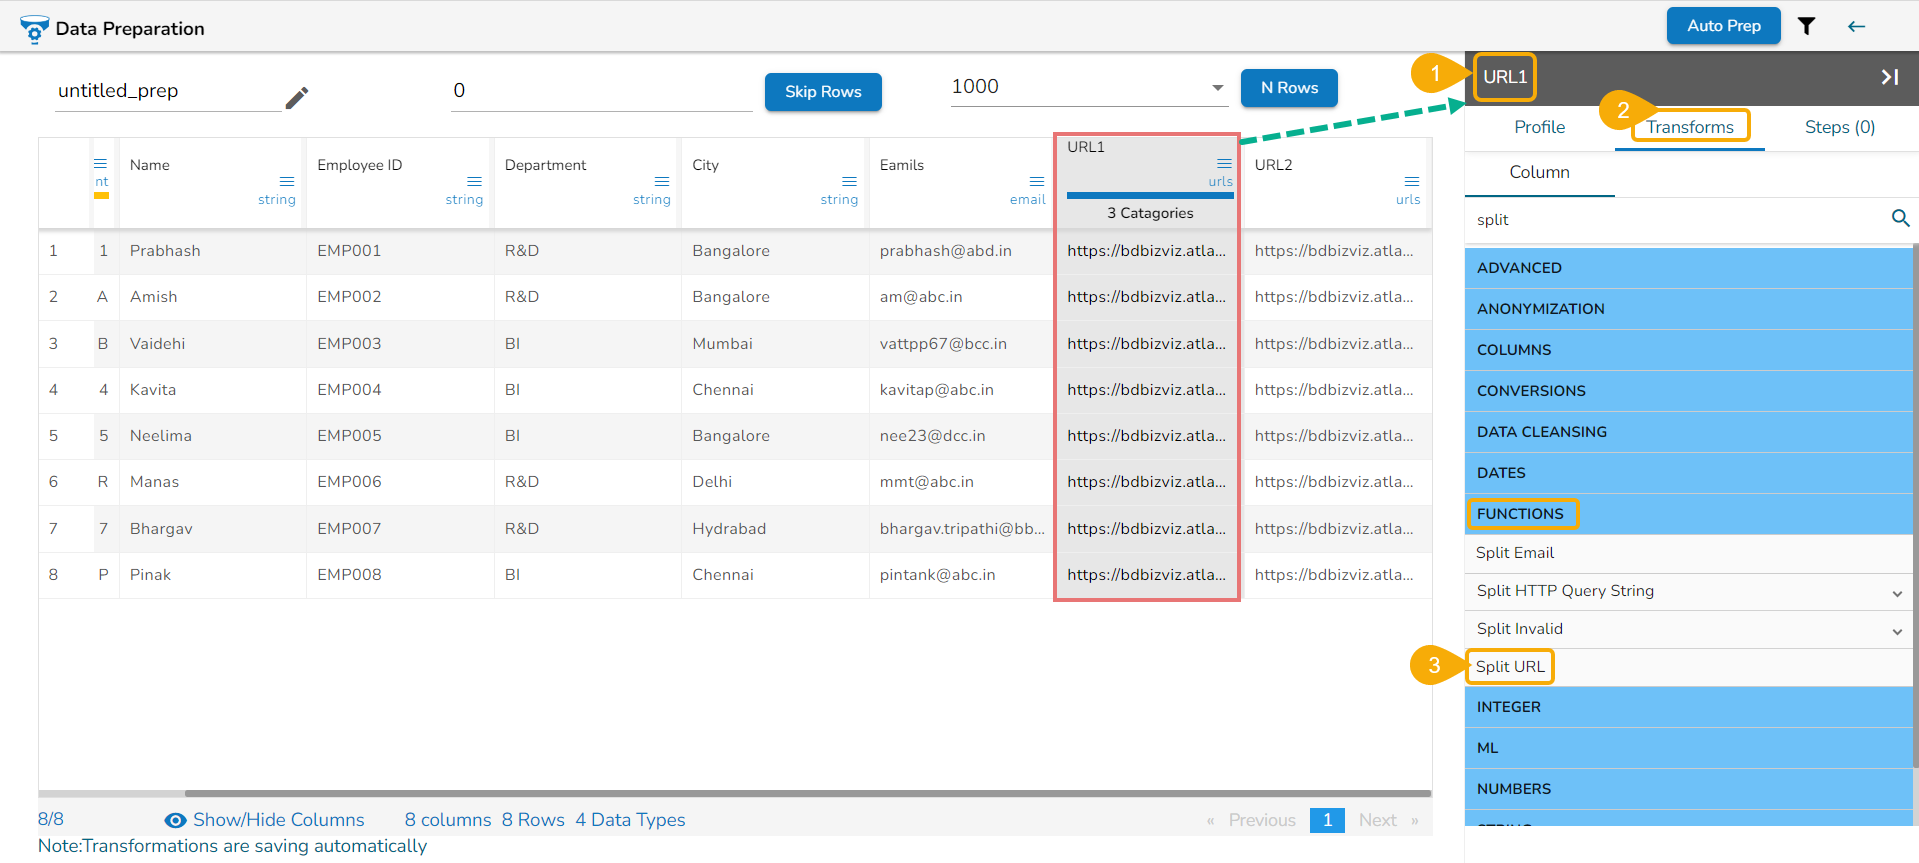
The source column with URL will get splitted into four columns displaying URL_scheme, URL_domain, URL_path, and URL_querystring.
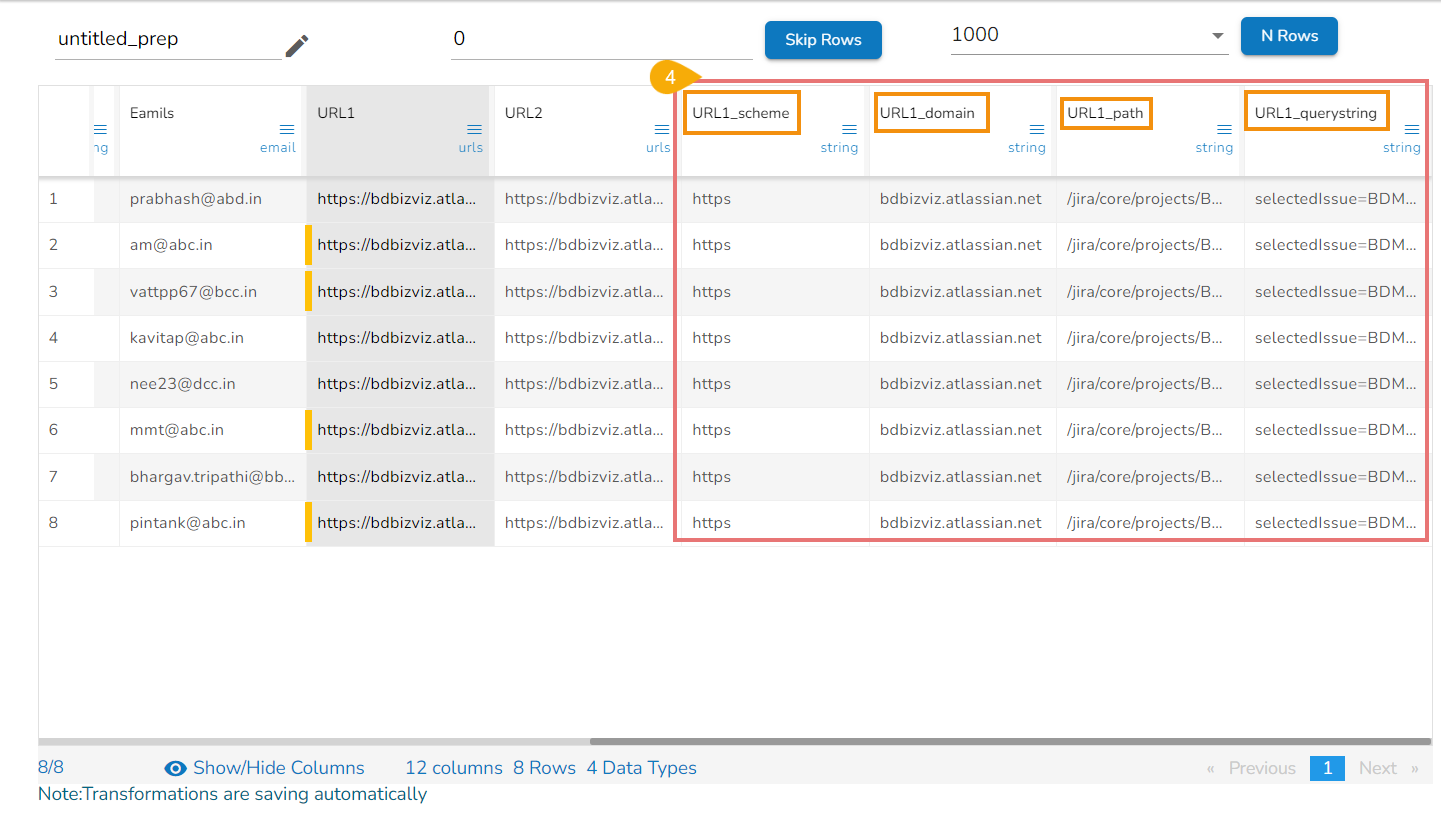
Please Note: The output of the Split URL will be displayed into multiple columns with the prefix of the input column name.
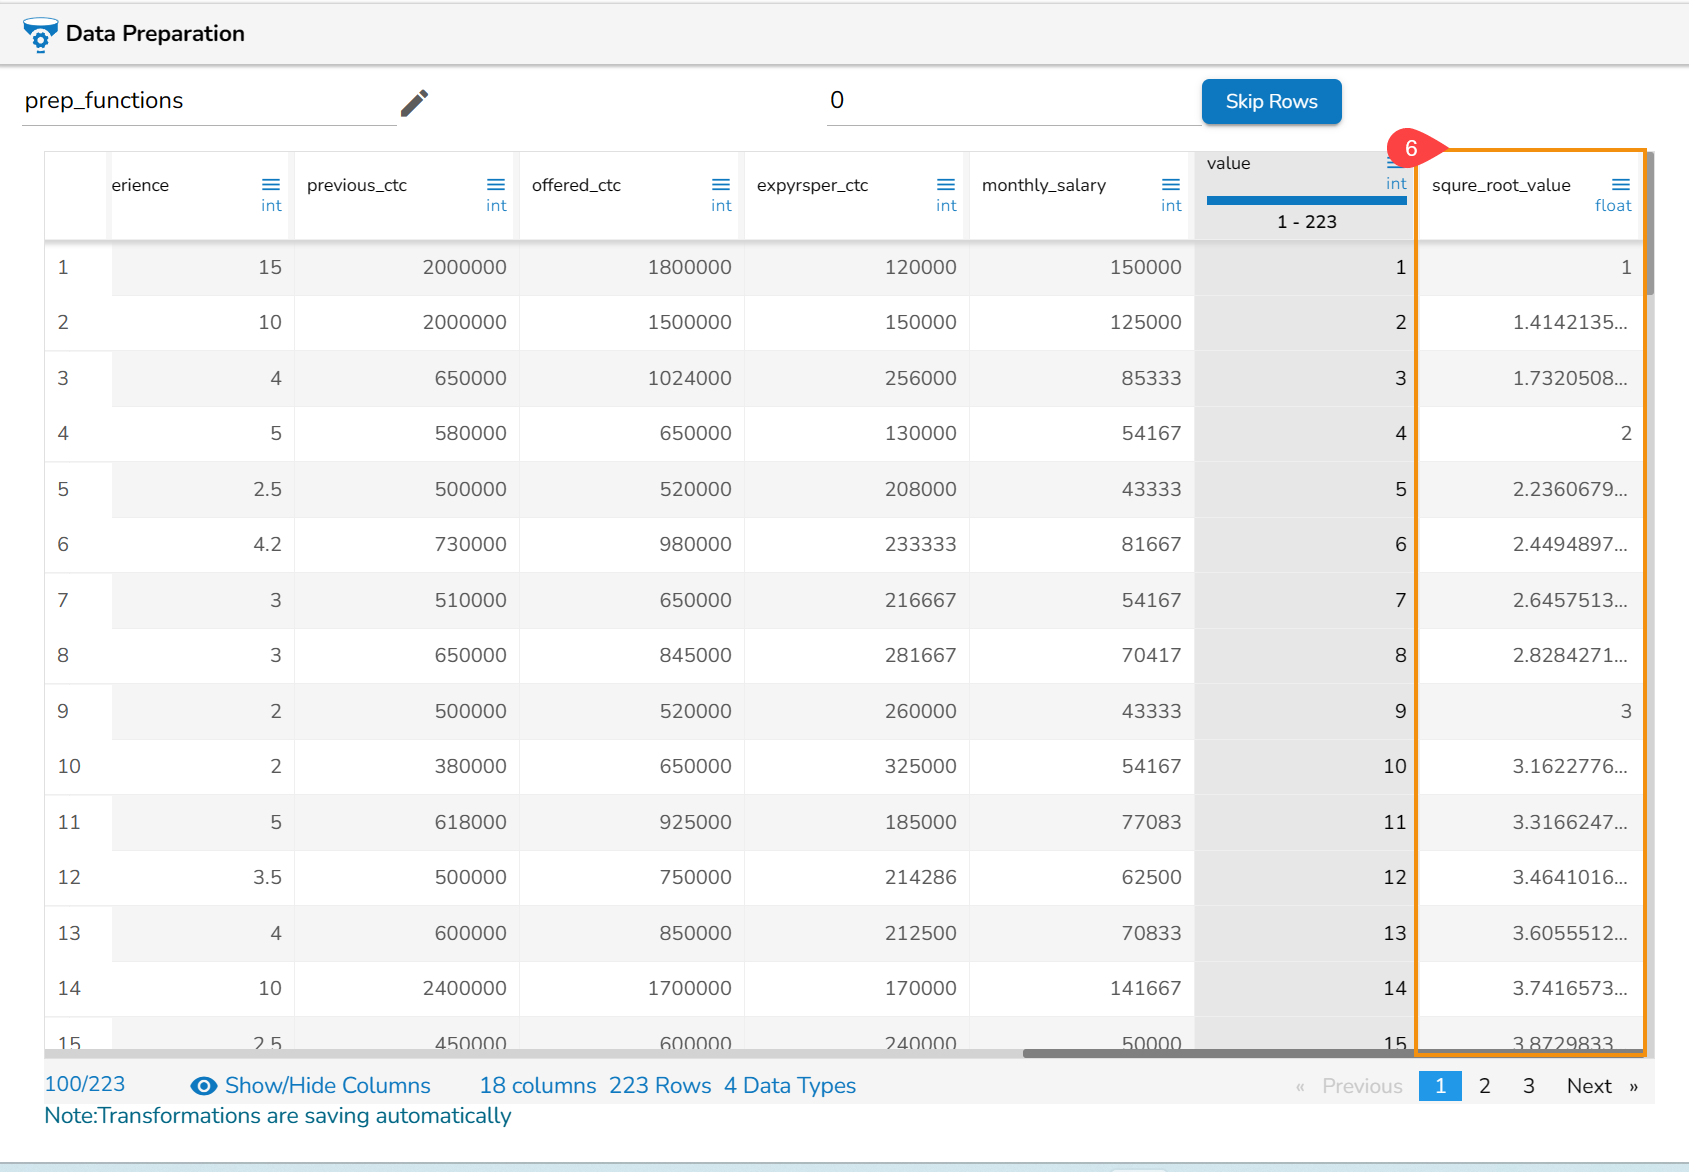
Sqrt of Column
Computes the square root of the input parameter.
Steps to perform the Sqrt of Column transformation:
Select a column from a dataset within the Data Preparation framework.
Select the Transforms tab.
Select the Sqrt of Column transform from the FUNCTIONS category.
Select the Create new column (optional) to get the result data in a new column.
Click the Submit option.
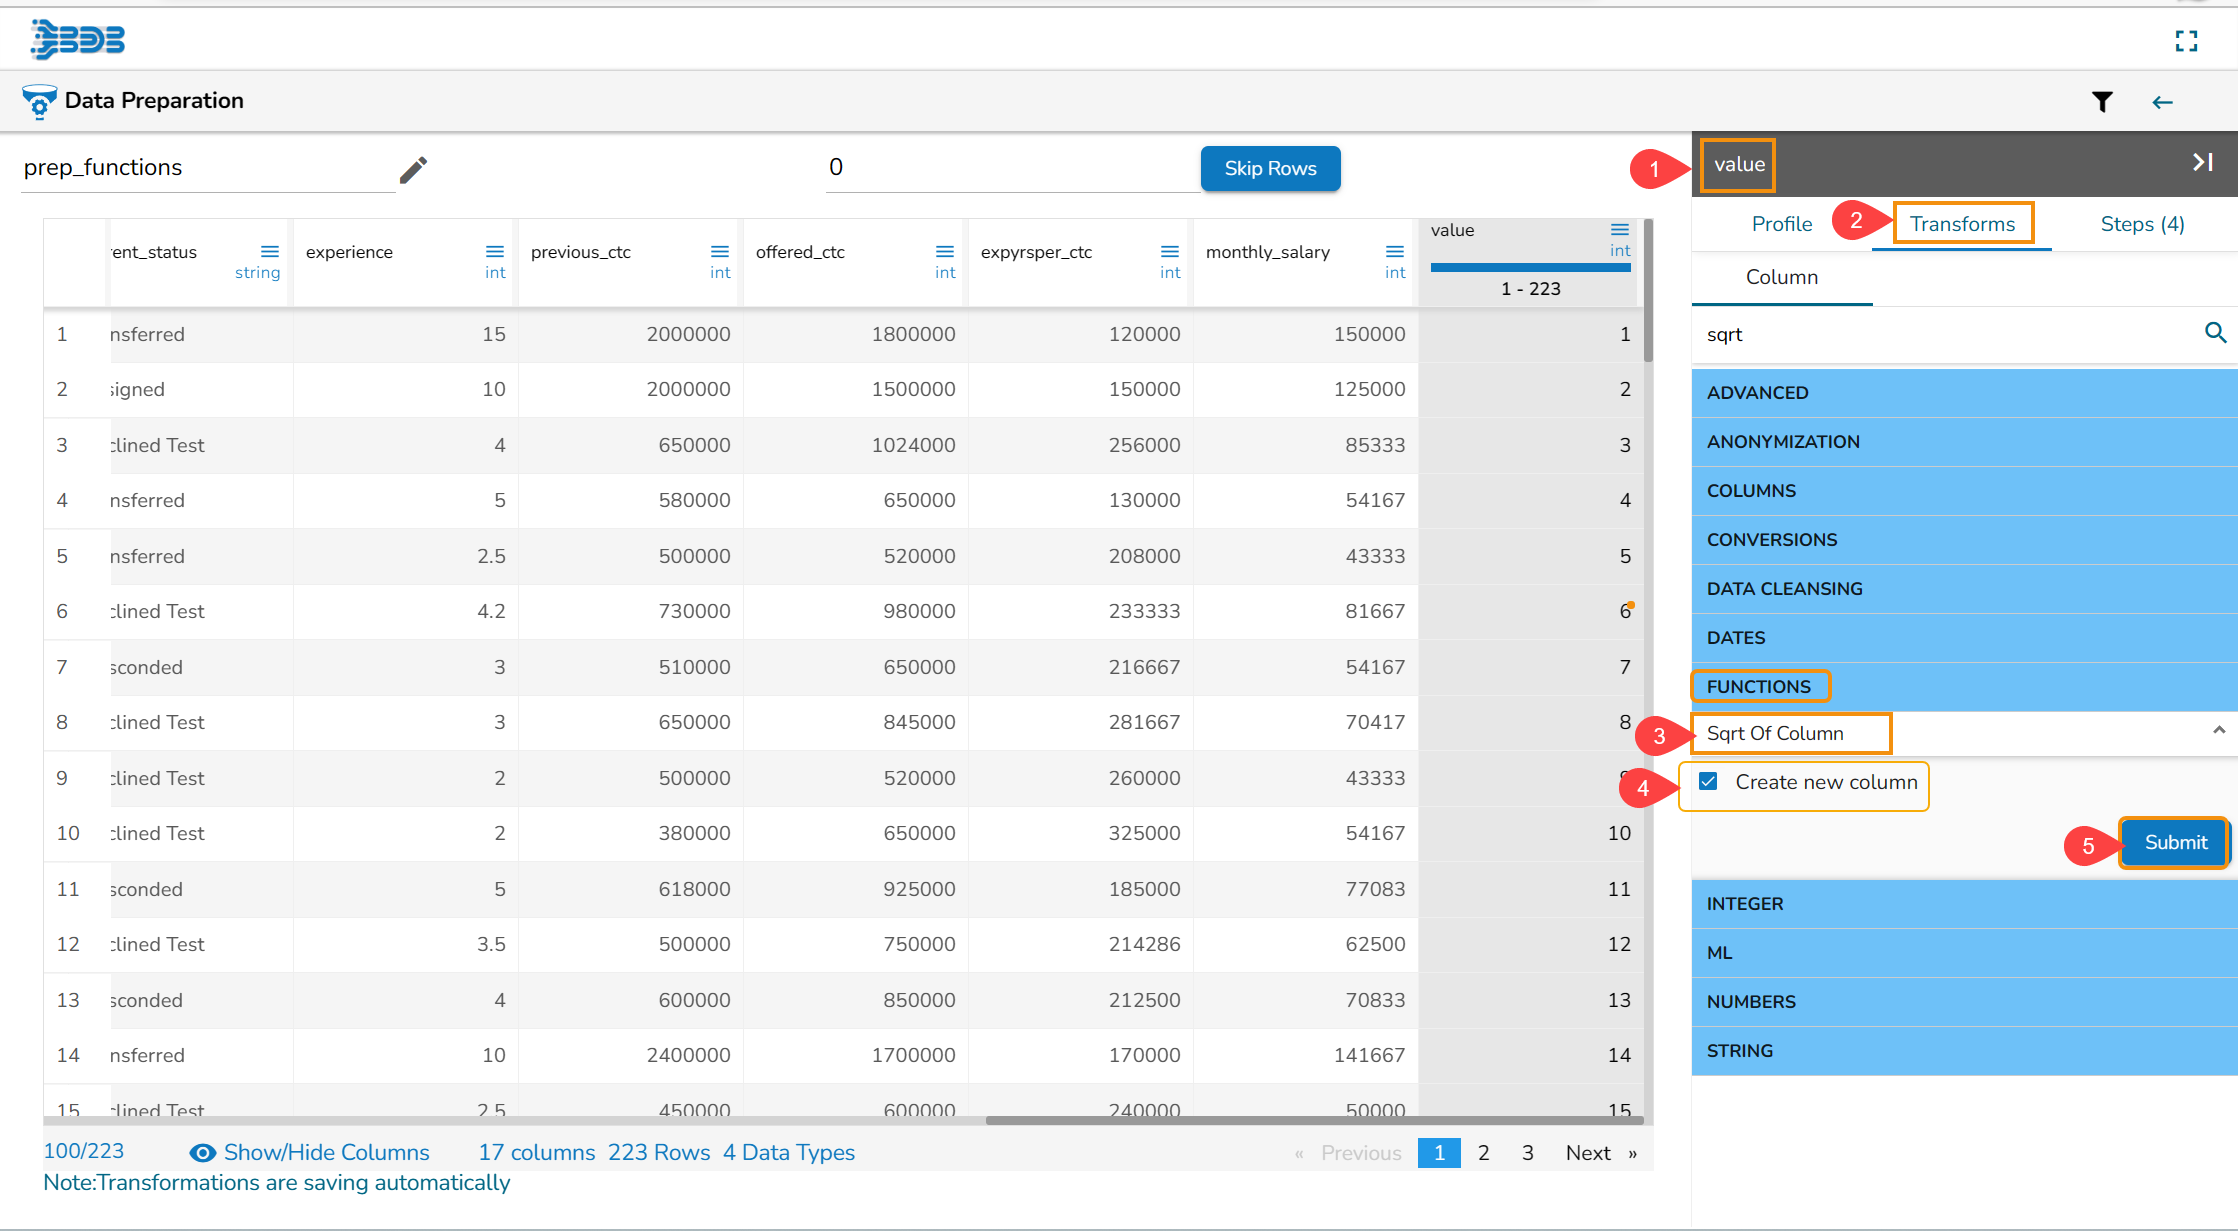
The result will come as a new column or update the same column with the sqrt of present value of the selected column.
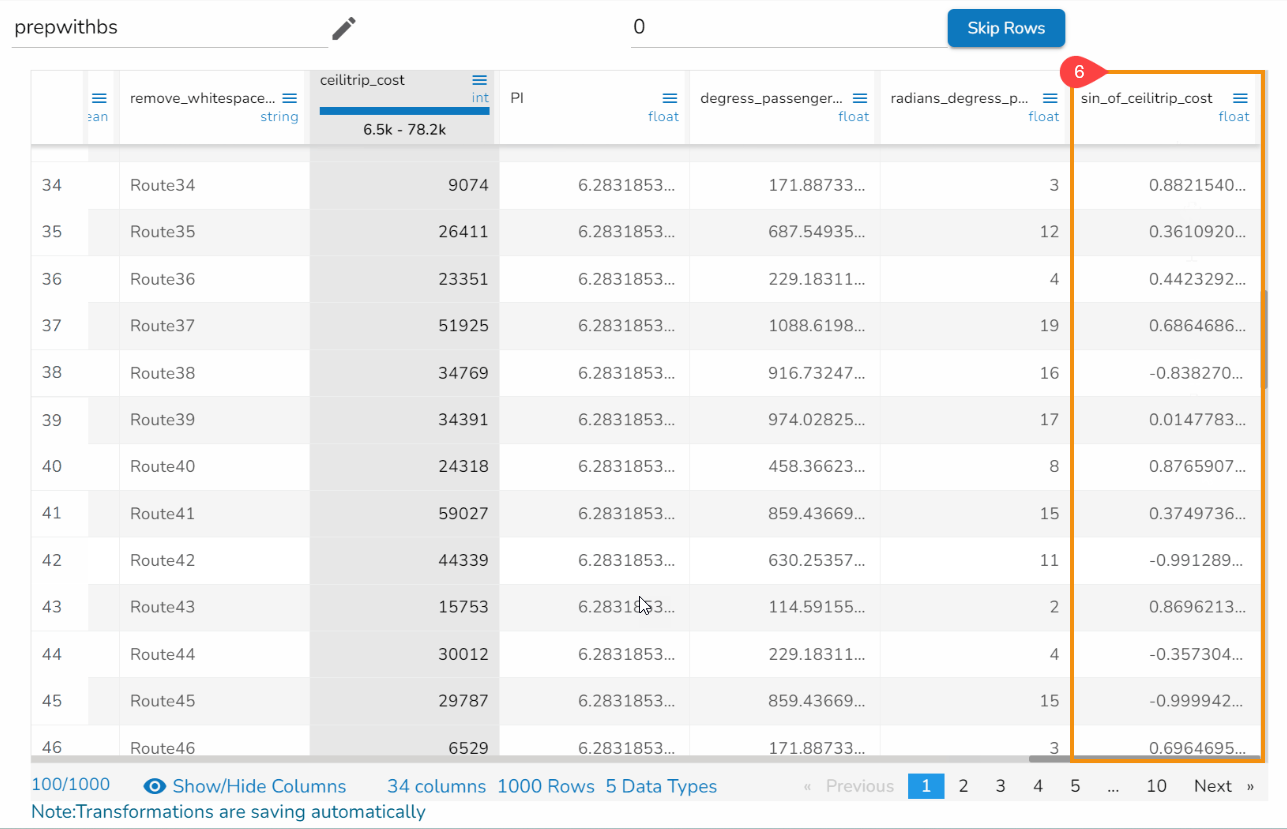
Trigonometric Functions
This transformation can be defined as the function of an angle of a triangle. It means that the relationship between the angles and sides of a triangle is given by these trig functions. The basic trigonometric functions are SIN, COS, TAN, SINH, COSH, and TANH.
Check out the given walk-through on how to use Trigonometric Functions transform.
Steps to perform the Trigonometric transformation:
Navigate to a dataset within the Data Preparation framework.
Open the Transforms tab.
Select the Trigonometric Functions transform from the FUNCTIONS method.
Provide the required information to apply the Transform:
Select one or multiple columns where the trigonometric functions need to be applied.
Select a Method from the drop-down menu.
The Supported methods are: SIN, COS, TAN, SINH, COSH, TANH
Click the Submit option.
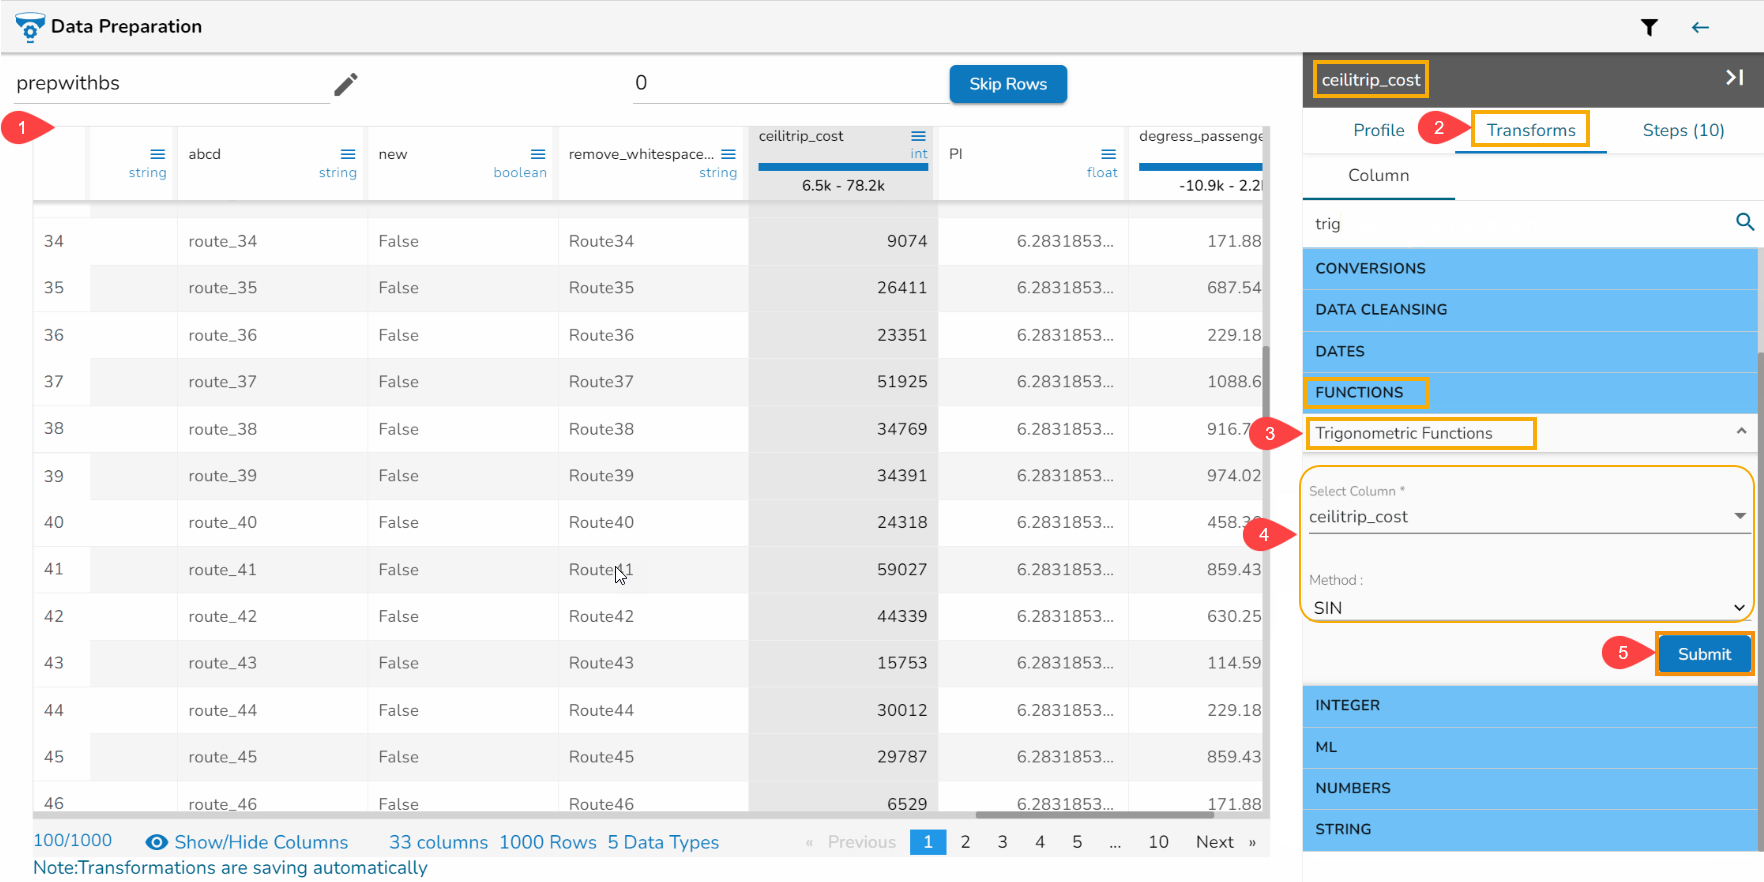
The result will come in a new column by converting to the respective (selected) trigonometric value.
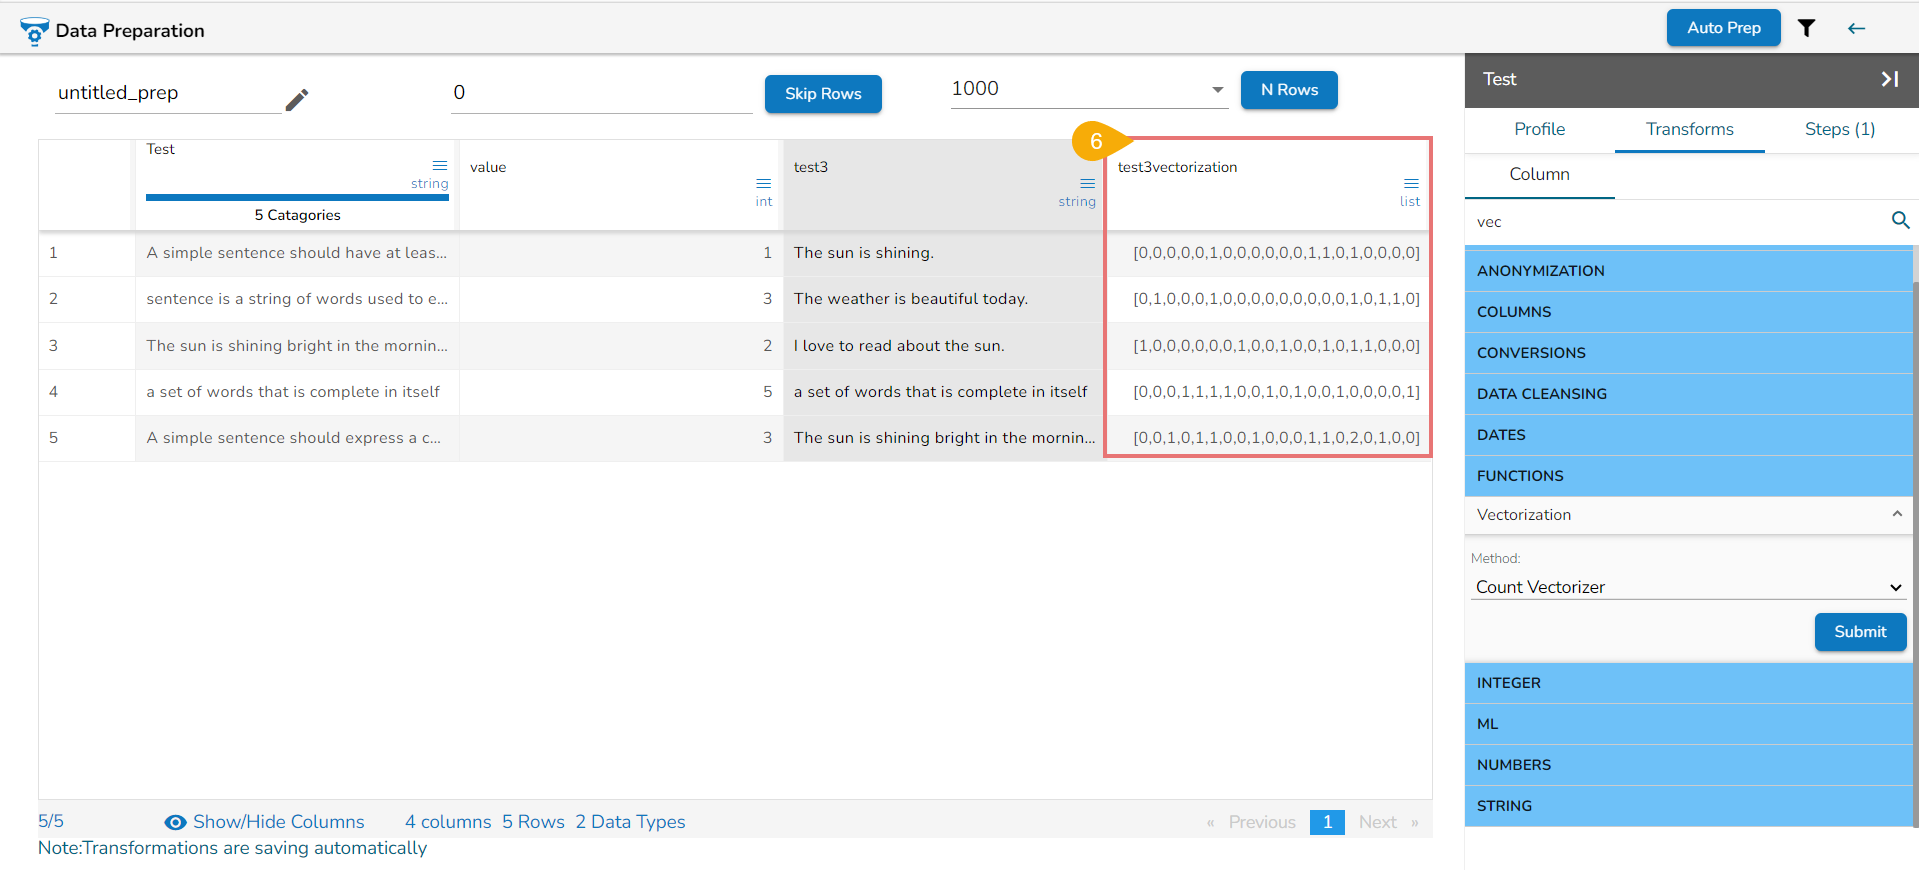
Vectorization
Vectorization is a process of converting textual data into numerical vectors or arrays, which can then be used as input for machine learning models or other algorithms that require numerical data. Vectorizing text allows us to represent the textual information in a format that can be easily understood by the models.
Check out the given walk-through on how to use the Vectorization transform with the Count and TFIDF Vectorization methods.
Steps to use the Vectorization Transform:
Navigate to a dataset within the Data Preparation framework.
Open the Transforms tab.
Select the Vectorization transform from the FUNCTIONS method.
Select a Vectorization method using the drop-down option.
Click the Submit option.
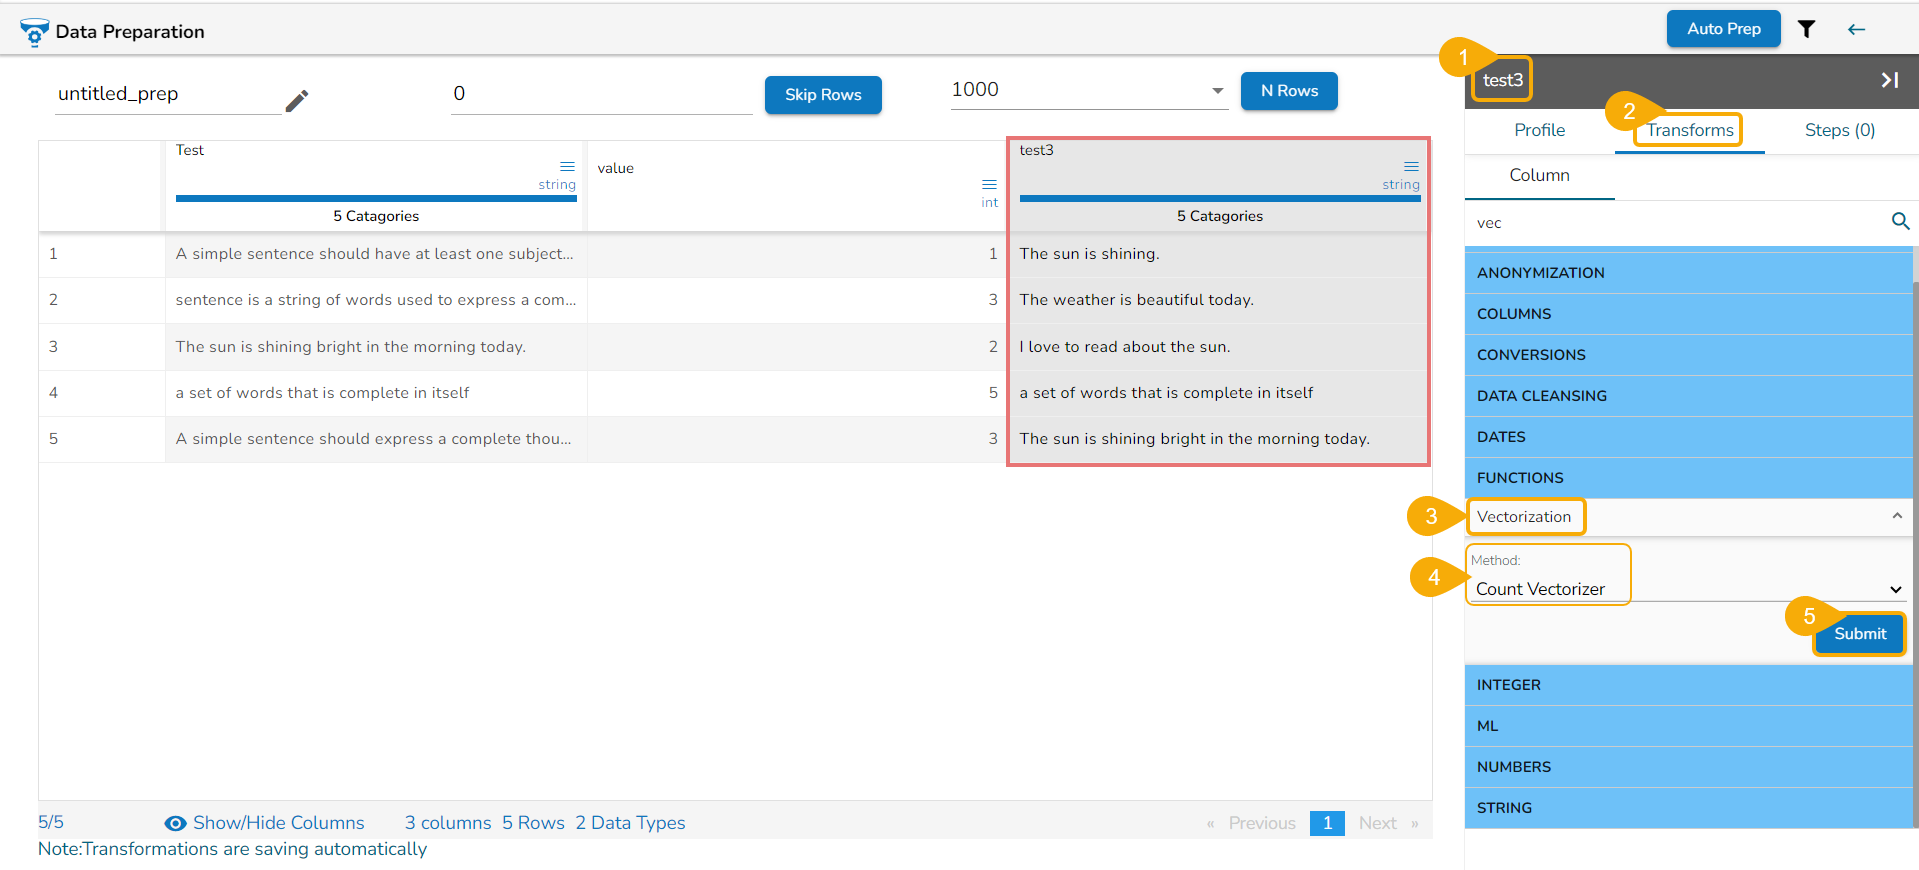
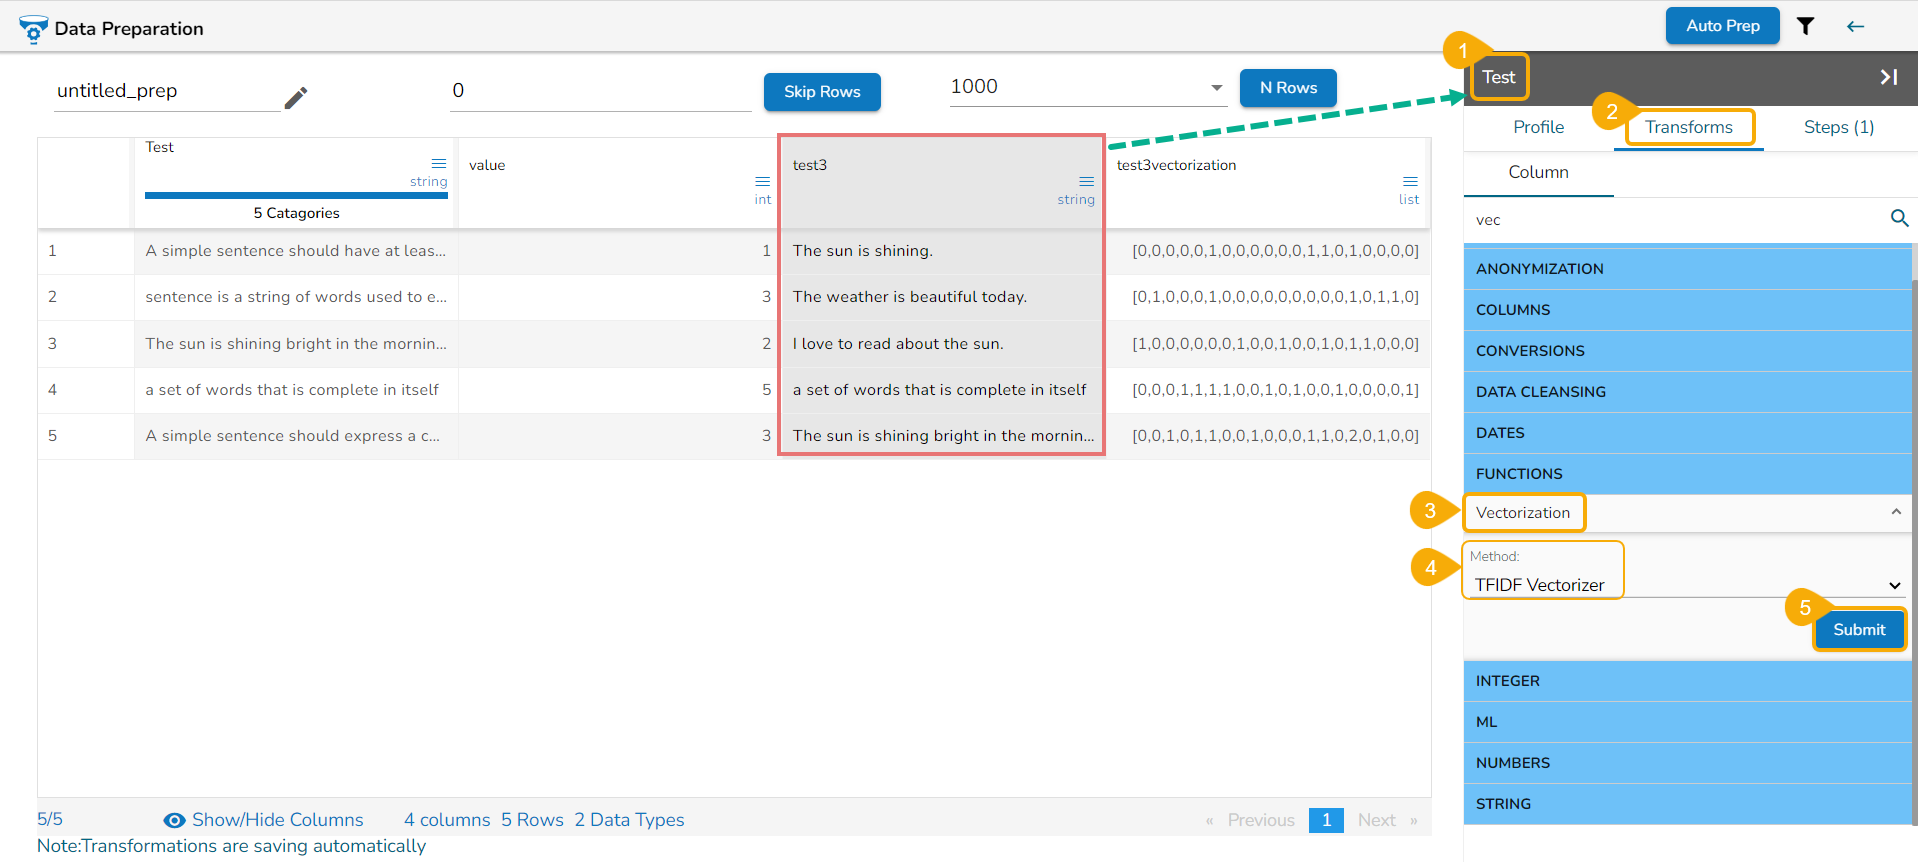
The output gets displayed in a new column based on the selected Vectorization method.
E.g., If the selected Input data is The sun is shining.
Output gets displayed as below:
For Count Vectorizer: [0,0,0,0,0,1,0,0,0,0,0,0,1,1,0,1,0,0,0,0]
For TFIDF Vectorizer: [0,0,0,0,0,0.42780918076667973,0,0,0,0,0,0,0.6126454381809064,0.5085510562171804,0,0.42780918076667973,0,0,0,0]
Last updated