Data Pipeline
  • Data Pipeline
    • About Data Pipeline
    • Design Philosophy
    • Low Code Visual Authoring
    • Real-time and Batch Orchestration
    • Event based Process Orchestration
    • ML and Data Ops
    • Distributed Compute
    • Fault Tolerant and Auto-recovery
    • Extensibility via Custom Scripting
  • Getting Started
    • Homepage
      • List Pipelines
      • Create
        • Creating a New Pipeline
          • Adding Components to Canvas
          • Connecting Components
            • Events [Kafka and Data Sync]
          • Memory and CPU Allocations
        • Creating a New Job
          • Job Editor Page
          • Task Components
            • Readers
              • HDFS Reader
              • MongoDB Reader
              • DB Reader
              • S3 Reader
              • Azure Blob Reader
              • ES Reader
              • Sandbox Reader
            • Writers
              • HDFS Writer
              • Azure Writer
              • DB Writer
              • ES Writer
              • S3 Writer
              • Sandbox Writer
              • Mongodb Writer
              • Kafka Producer
            • Transformations
          • PySpark Job
          • Python Job
      • List Jobs
      • List Components
      • Delete Orphan Pods
      • Scheduler
      • Data Channel & Cluster Events
      • Trash
      • Settings
    • Pipeline Workflow Editor
      • Pipeline Toolbar
        • Pipeline Overview
        • Pipeline Testing
        • Search Component in Pipelines
        • Push Pipeline (to VCS/GIT)
        • Pull Pipeline
        • Full Screen
        • Log Panel
        • Event Panel
        • Activate/Deactivate Pipeline
        • Update Pipeline
        • Failure Analysis
        • Pipeline Monitoring
        • Delete Pipeline
        • Pipeline Component Configuration
        • Pipeline Failure Alert History
      • Component Panel
      • Right-side Panel
    • Testing Suite
    • Activating Pipeline
    • Monitoring Pipeline
    • Job Monitoring
  • Components
    • Adding Components to Workflow
    • Component Architecture
    • Component Base Configuration
    • Resource Configuration
    • Intelligent Scaling
    • Connection Validation
    • Readers
      • GCS Reader
      • S3 Reader
      • HDFS Reader
      • DB Reader
      • ES Reader
      • SFTP Stream Reader
      • SFTP Reader
      • Mongo DB Reader
        • MongoDB Reader Lite (PyMongo Reader)
        • MongoDB Reader
      • Azure Blob Reader
      • Azure Metadata Reader
      • ClickHouse Reader (Docker)
      • Sandbox Reader
      • Azure Blob Reader (Docker)
    • Writers
      • S3 Writer
      • DB Writer
      • HDFS Writer
      • ES Writer
      • Video Writer
      • Azure Writer
      • ClickHouse Writer (Docker)
      • Sandbox Writer
      • MongoDB Writers
        • MongoDB Writer
        • MongoDB Writer Lite (PyMongo Writer)
    • Machine Learning
      • DSLab Runner
      • AutoML Runner
    • Consumers
      • GCS Monitor
      • Sqoop Executer
      • OPC UA
      • SFTP Monitor
      • MQTT Consumer
      • Video Stream Consumer
      • Eventhub Subscriber
      • Twitter Scrapper
      • Mongo ChangeStream
      • Rabbit MQ Consumer
      • AWS SNS Monitor
      • Kafka Consumer
      • API Ingestion and Webhook Listener
    • Producers
      • WebSocket Producer
      • Eventhub Publisher
      • EventGrid Producer
      • RabbitMQ Producer
      • Kafka Producer
      • Synthetic Data Generator
    • Transformations
      • SQL Component
      • File Splitter
      • Rule Splitter
      • Stored Producer Runner
      • Flatten JSON
      • Pandas Query Component
      • Enrichment Component
      • Mongo Aggregation
      • Data Loss Protection
      • Data Preparation (Docker)
      • Rest Api Component
      • Schema Validator
    • Scripting
      • Script Runner
      • Python Script
        • Keeping Different Versions of the Python Script in VCS
    • Scheduler
    • Alerts
      • Alerts
      • Email Component
  • Custom Components
  • Advance Configuration & Monitoring
    • Configuration
      • Default Component Configuration
      • Logger
    • Data Channel
    • Cluster Events
    • System Component Status
  • Version Control
  • Use Cases
Powered by GitBook
On this page
  1. Getting Started

Monitoring Pipeline

This Page explains How we can monitor the Pipelines.

PreviousActivating PipelineNextJob Monitoring

Last updated 1 year ago

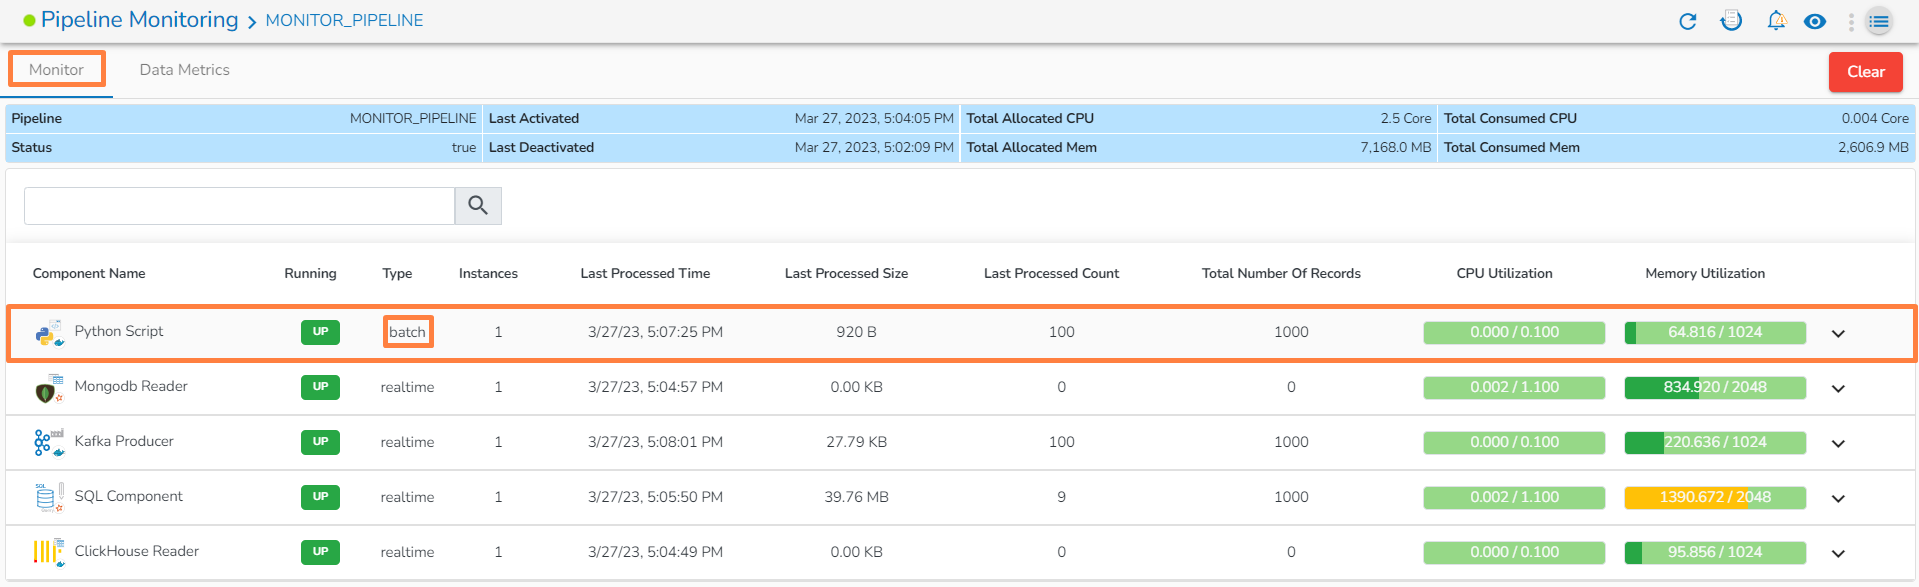
The user can monitor a pipeline together with all the components associated with the same by using the Pipeline Monitoring icon. The user gets information about Pipeline components, Status, Types, Last Activated (Date and Time), Last Deactivated (Date and Time), Total Allocated and Consumed CPU%, Total allocated and consumed memory, Number of Records, and Component logs all displayed on the same page.

Go through the below-given video to get a basic idea on the pipeline monitoring functionality.

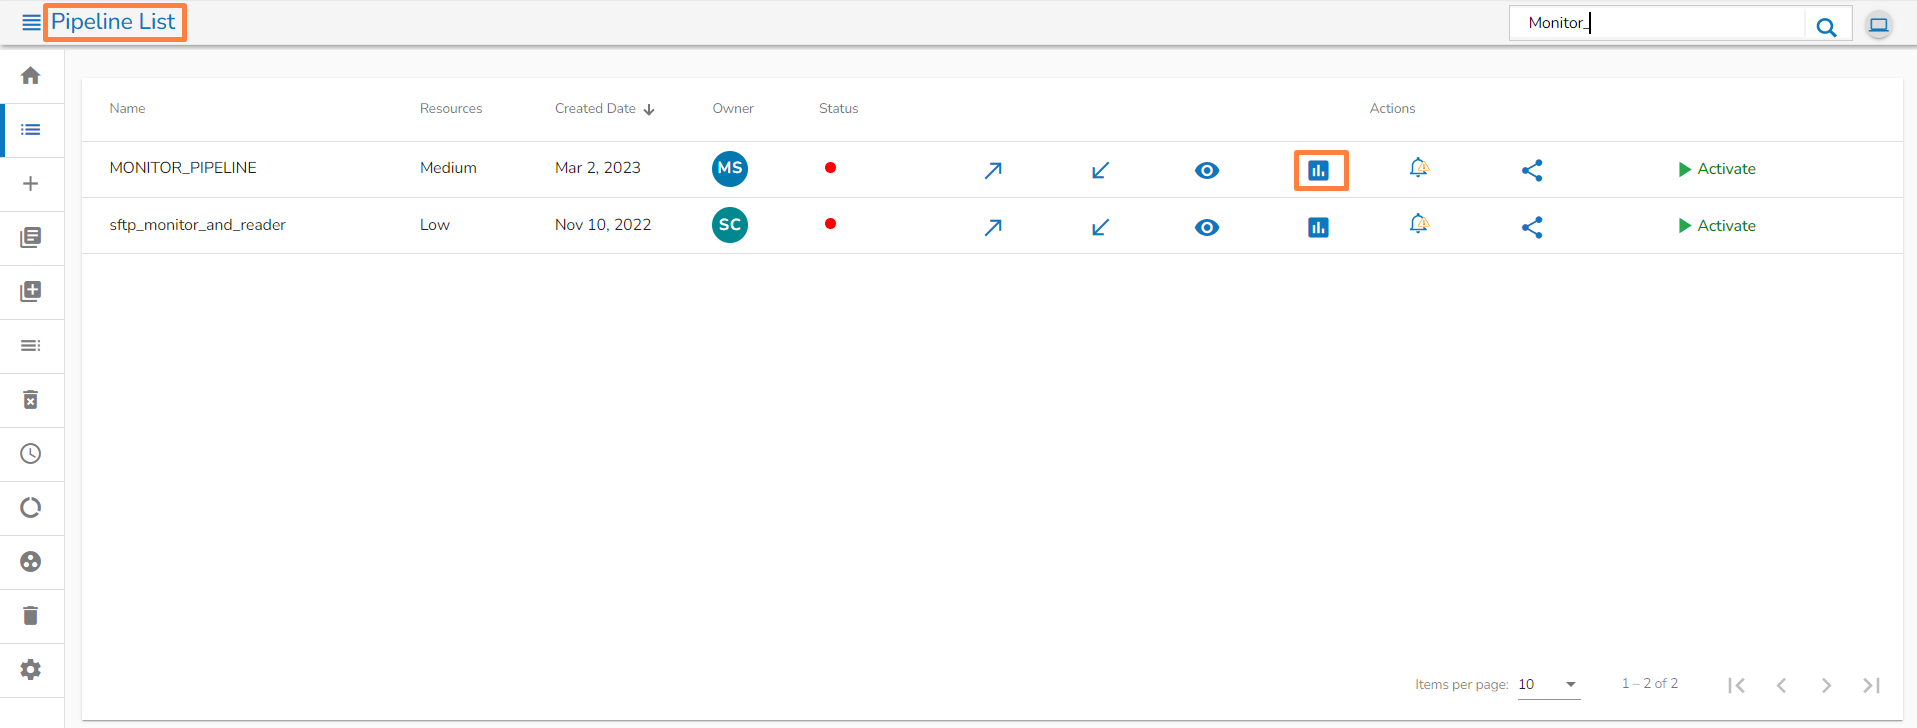
  • Navigate to the Pipeline List page.

  • Click the Monitor icon.

Or

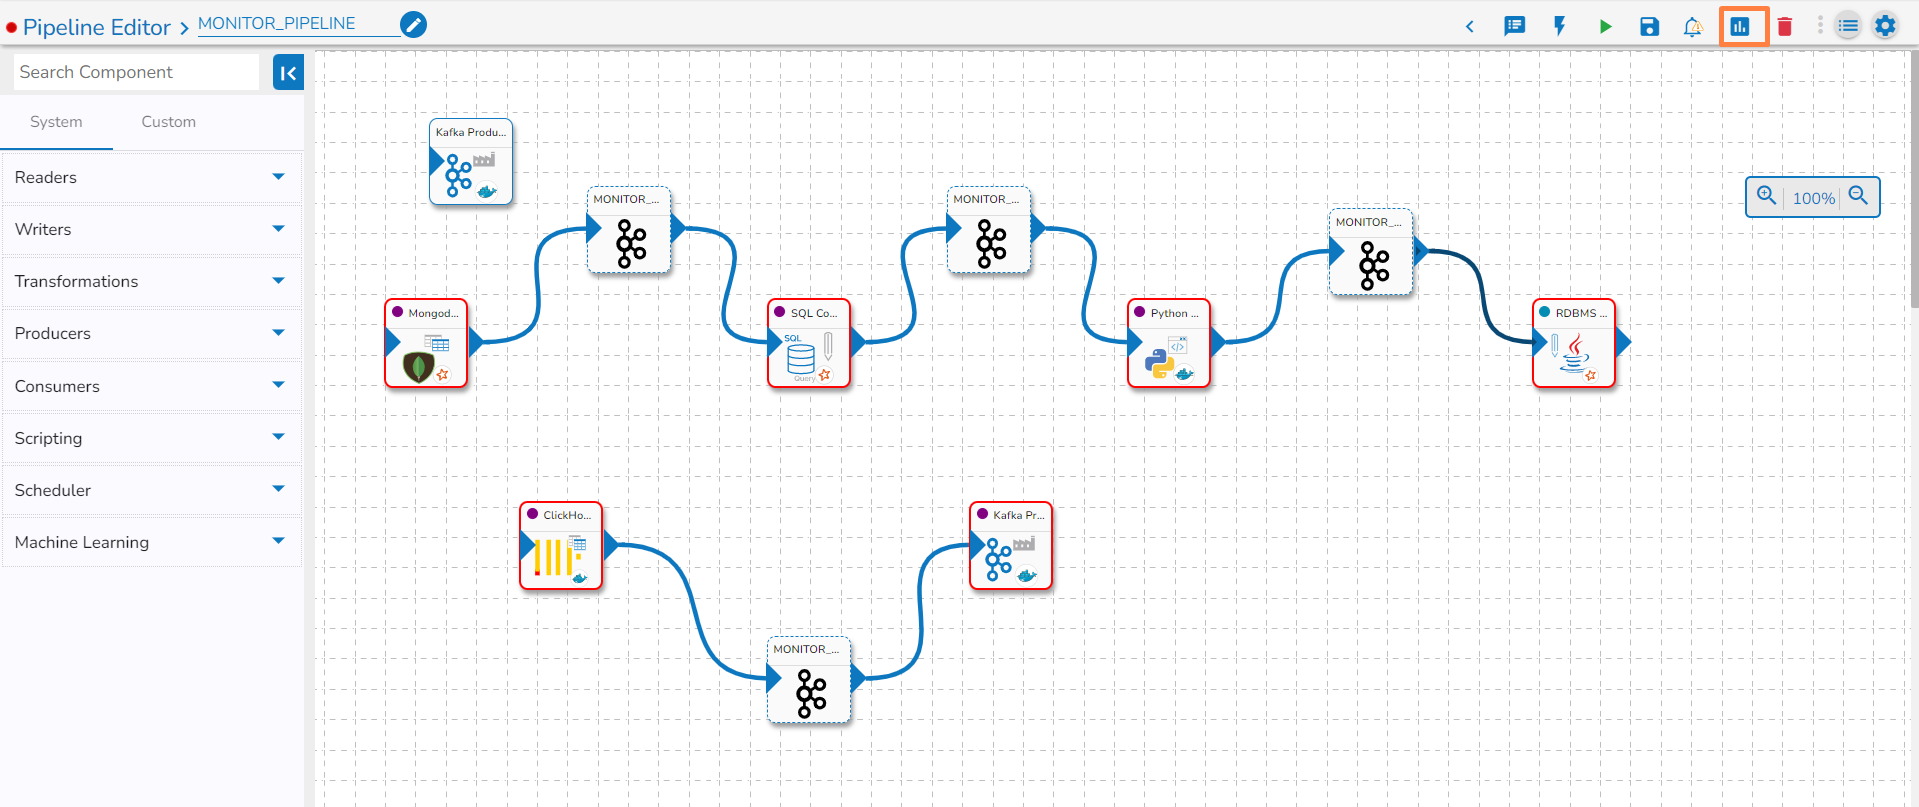
  • Navigate to the Pipeline Workflow Editor page.

  • Click the Pipeline Monitoring icon on the Header panel.

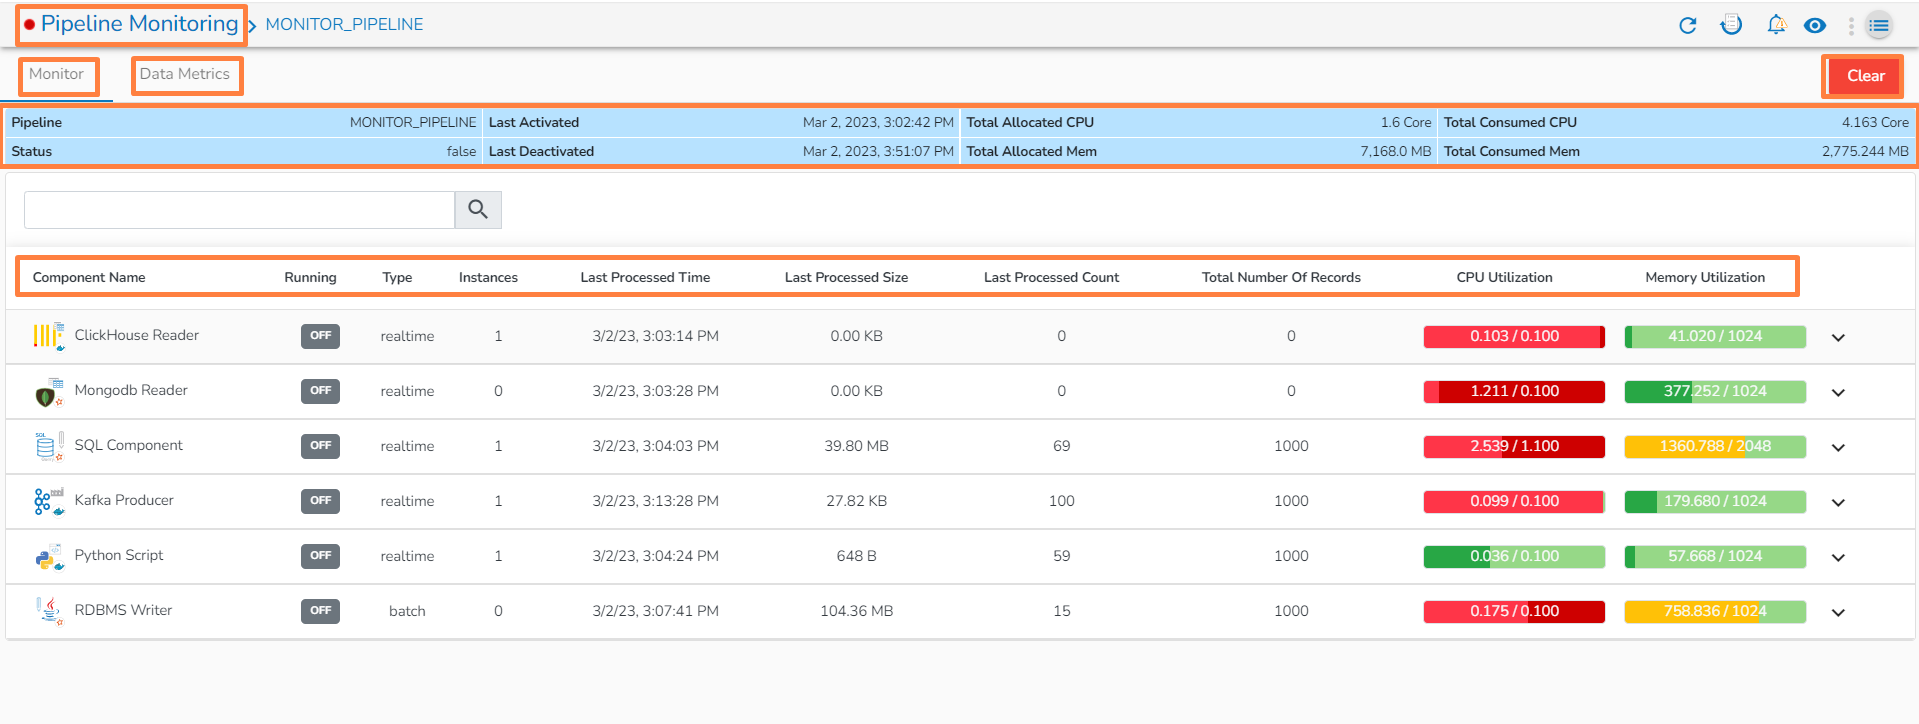
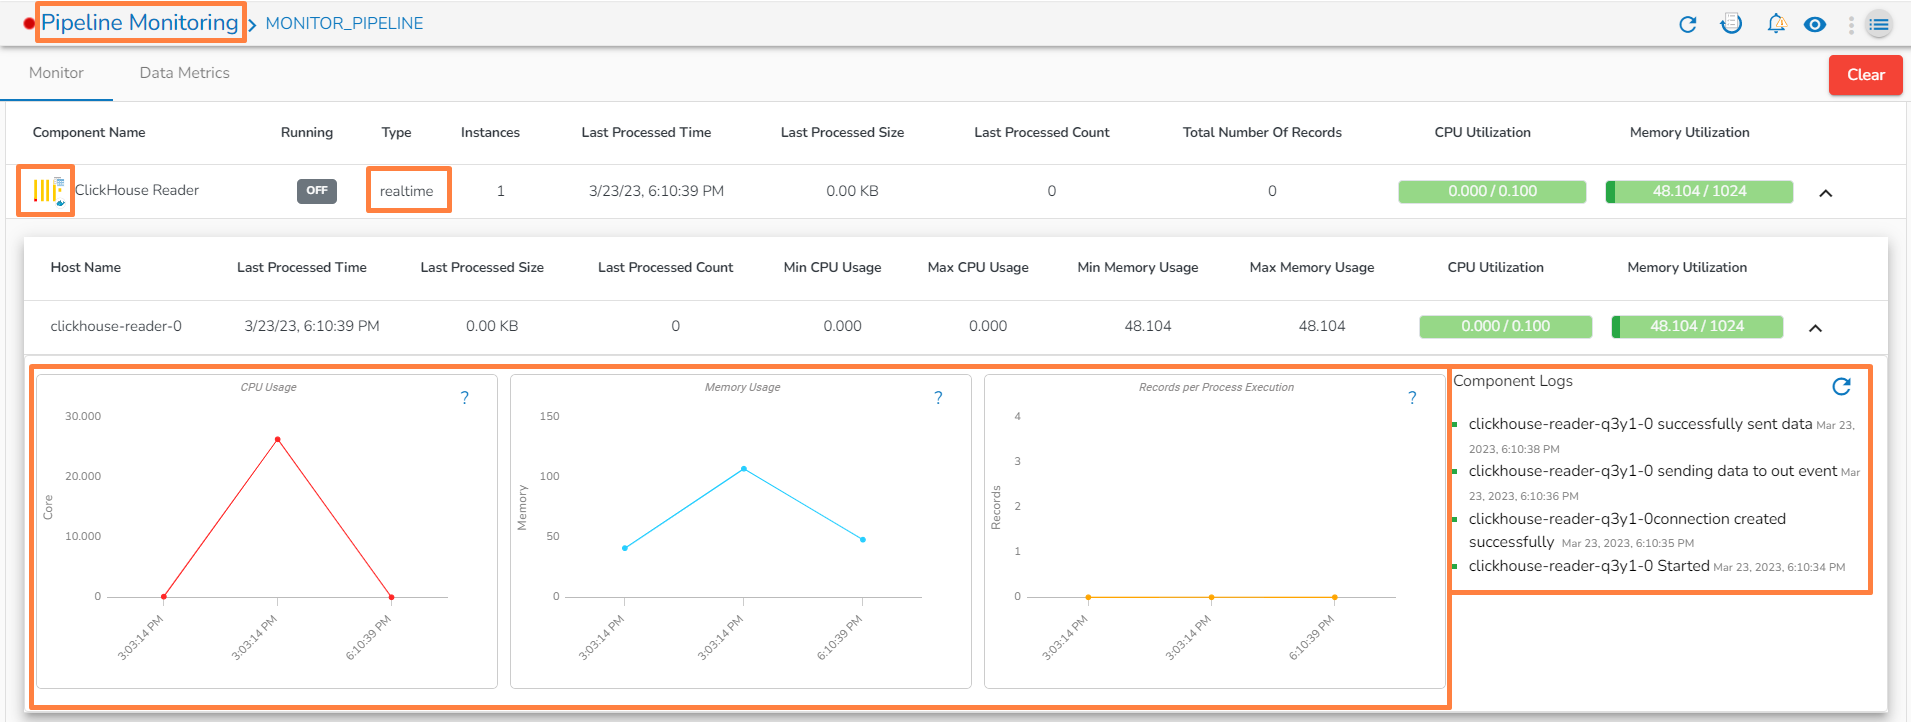
  • The Pipeline Monitoring page opens displaying the details of the selected pipeline.

  • The Monitor tab opens by default.

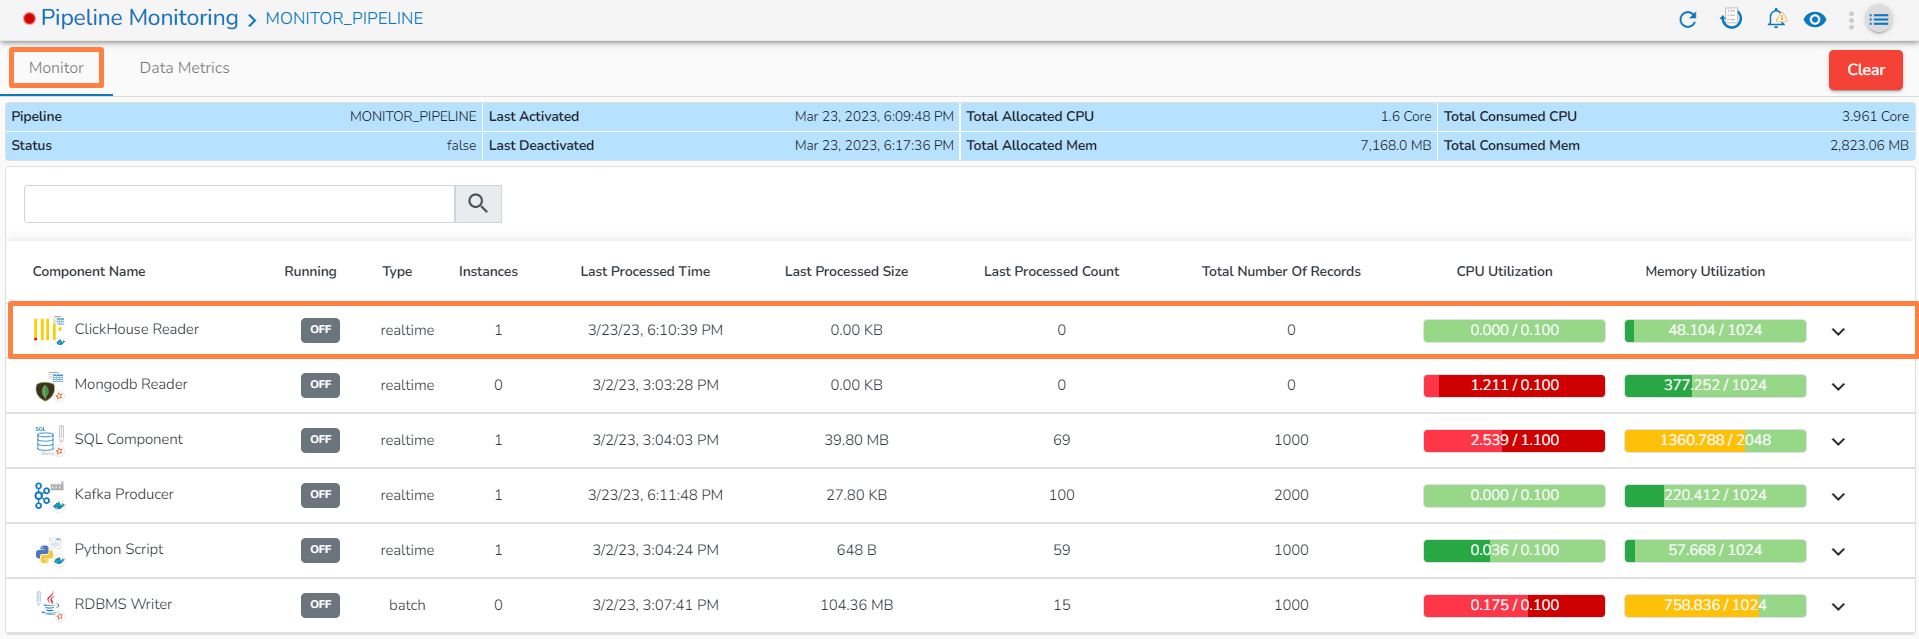
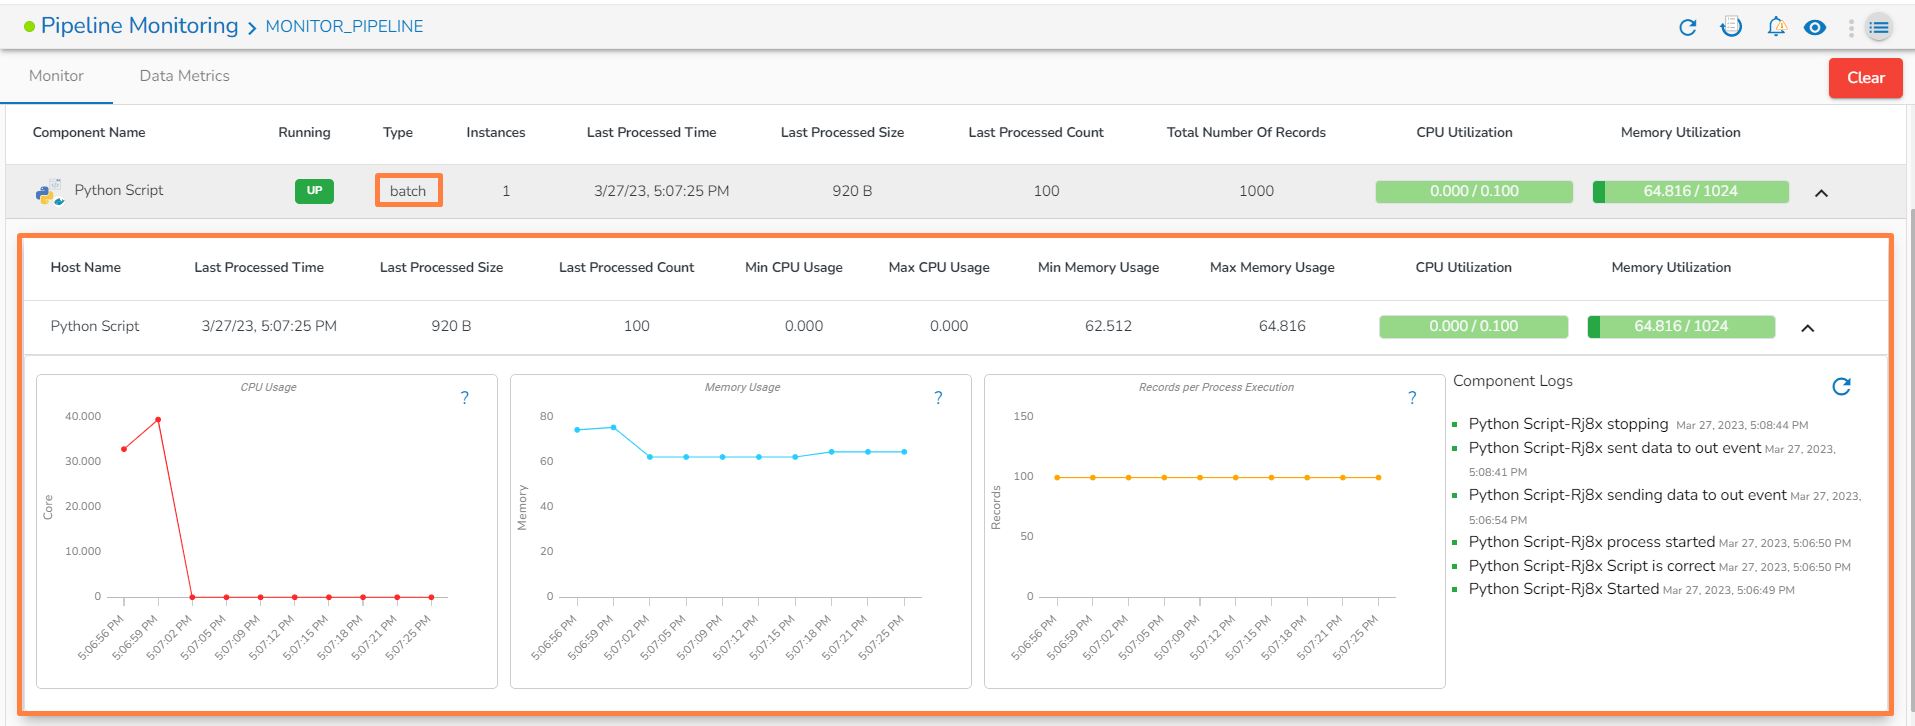
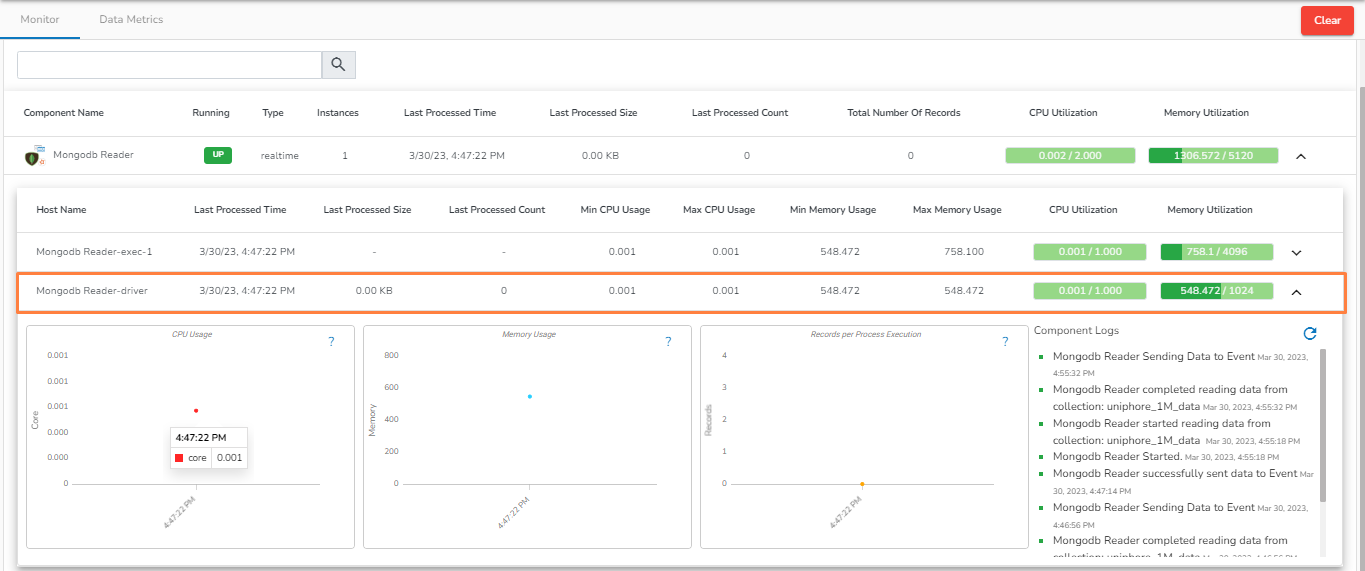
  • If there are multiple instances for a single component, click on the drop-down.

  • Details for each instance will be displayed.

Monitoring page for Docker component in Real-Time

Monitoring page for Docker component in Batch:

Monitoring page for Spark Component:

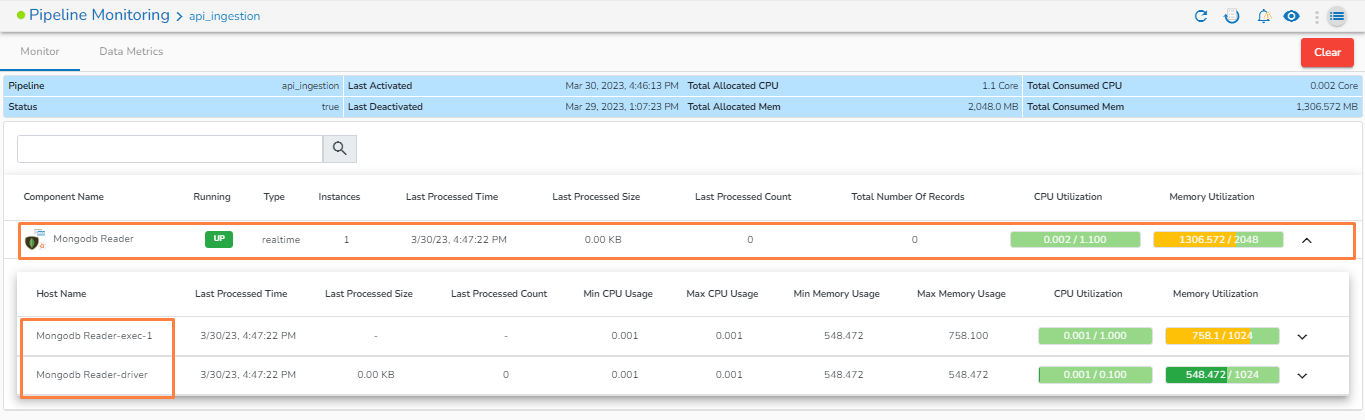
Monitoring page for Spark Component - Driver:

Monitoring page for Spark Component- Executer:

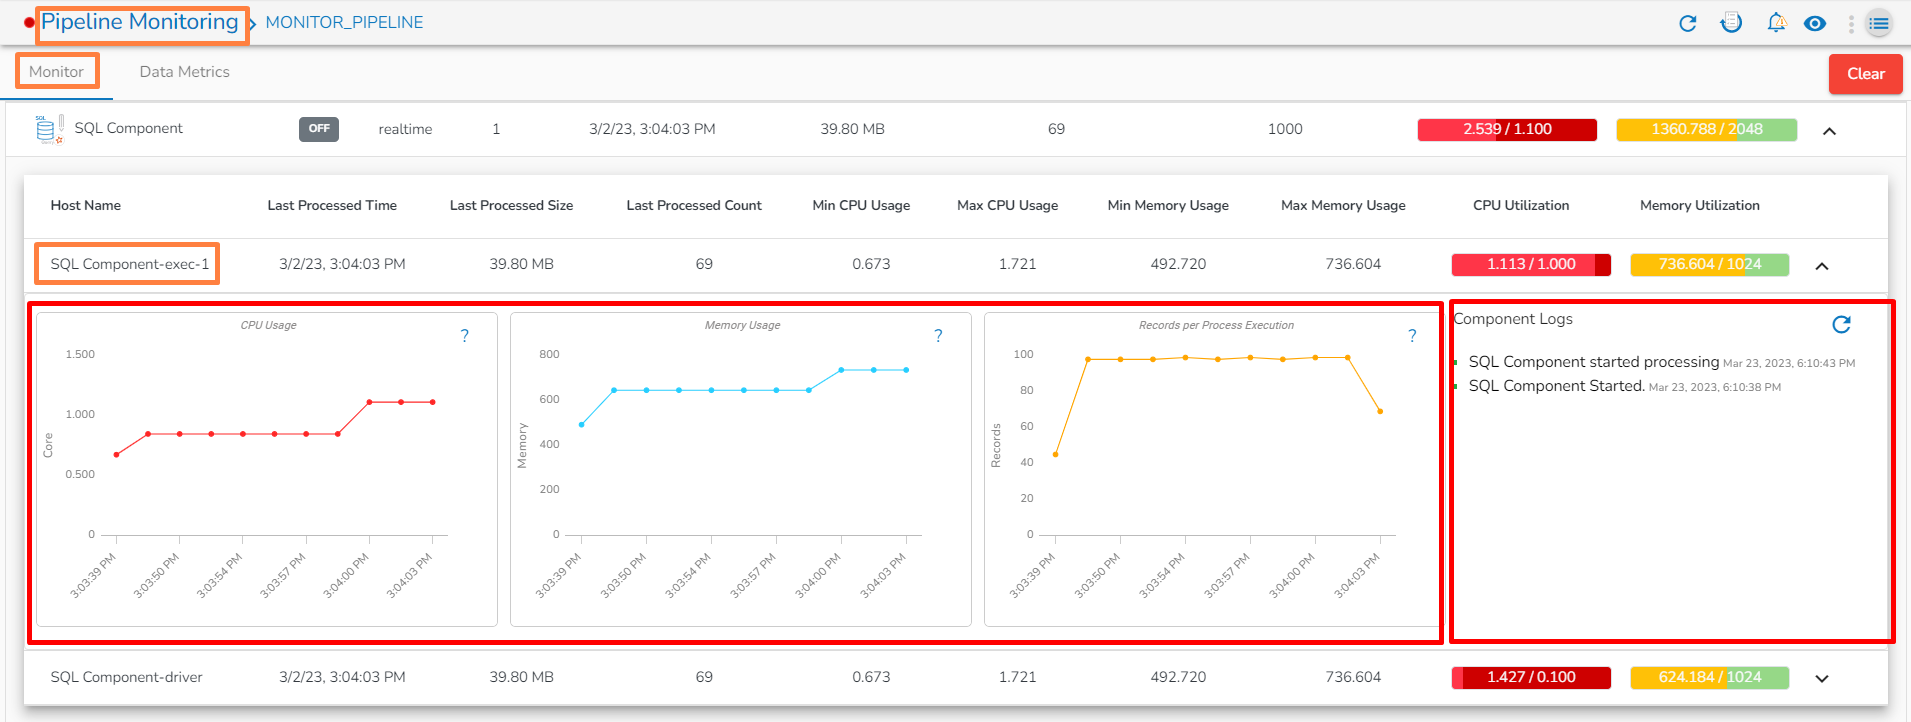
  • If memory allocated to the component is less than required, then it will be displayed in red color.

  • Open the Data Metrics tab.

  • Specify the time period by providing the from and to dates.

  • Choose an interval option or select the custom interval by dragging the pointer.

  • The component specific data metrics get displayed. The green color nodes indicate that the data has been loaded.​ Click on green color icon to get all the details of processed data as shown in the below images.

  • Once hovering on the green color icon on the data metrics page, it will display the following information.

    • Start: Window start time.

    • End: Window end time.

    • Processed: Number of processed records.

    • Produced: Number of records generated after processing.

    • Failed: Number of records that failed during processing.

    • Failed Percentage: Percentage of failed records, calculated as the ratio between Failed and Processed data.

    By default, the Start and End window times are set within the range of 30 minutes. Users can adjust this window time to 60 minutes and 90 minutes as per their convenience. If there is no failed data within the specified window, the Failed and Failed Percentage fields will not be shown when hovering over the green color icon.

  • The user can see the data metrics for all the components by enabling the Show all components on the Data Metrics page. Please refer the below given image for the reference.

  • Clear: It will clear all the monitoring and data metrics logs for all the components in the pipeline.

  • Users can visualize the loaded data in the form of charts by clicking on the green color icon. Please go through the given walk through for the reference.

  • Once the user clicks on the green color icon, the following page will be opened:

  1. Produced v/s Consumed

This chart will display the number of records produced to the out event compared to the number of records taken from the previous event over the given time window.

  1. Min v/s Max v/s Avg Elapsed Time

This chart displays the minimum, maximum, and average time taken to process a record over the given time window.

  1. Failed Records

This chart will display the number of failed records during processing over the given time window for the selected component.

  1. Consumed v/s Failed Records

This chart will display the ratio of records failed during processing by the component to the total number of records consumed by the component over the given time window.

The user can also analyze the failure for the selected component from the data metrics page by clicking on Analyze Failure option. Please see the below given image for reference.

Clicking on the "Analyze Failure" option will redirect the user to the failure analysis page.

Accessing the Pipeline Monitoring from the Pipeline List page.
Docker component- Real time
Docker component- Batch
Monitoring details for Spark component
Spark component- Driver
Spark component- Executer
Data Metrics Page
Showing Data Metrics for all the component in the pipeline
Clear option on Monitoring Page
Produced v/s Consumed
Min v/s Max v/s Avg Elapsed Time
Failed Records
Consumed v/s Failed Records
Data Metrics Page
Displaying Pipeline Monitoring and Data Metrics