Dataset Explainer
The Dataset Explainer tab provides a high-level preview of the dataset that has been used for the experiment. It redirects the user to the Data Profile page.
The Data Profile is displayed using various sections such as:
Data Set Info
Variable Types
Warnings
Variables
Correlations
Missing Values
Sample
Let us see each of them one by one.
Data Info
The Data Profile displayed under the Dataset Explainer section displays the following information for the Dataset.
Numbers of variables
Number of observations
Missing cells
Duplicate rows
Total size in memory
Average record size in memory
Variable Types
This section mentions variable types for the data set variables. The selected Data set contains the following variable types:
Numeric
Categorical
Boolean
Date
URL
Text (Unique)
Rejected
Unsupported
Warnings
This section informs user about the warnings for the selected dataset.

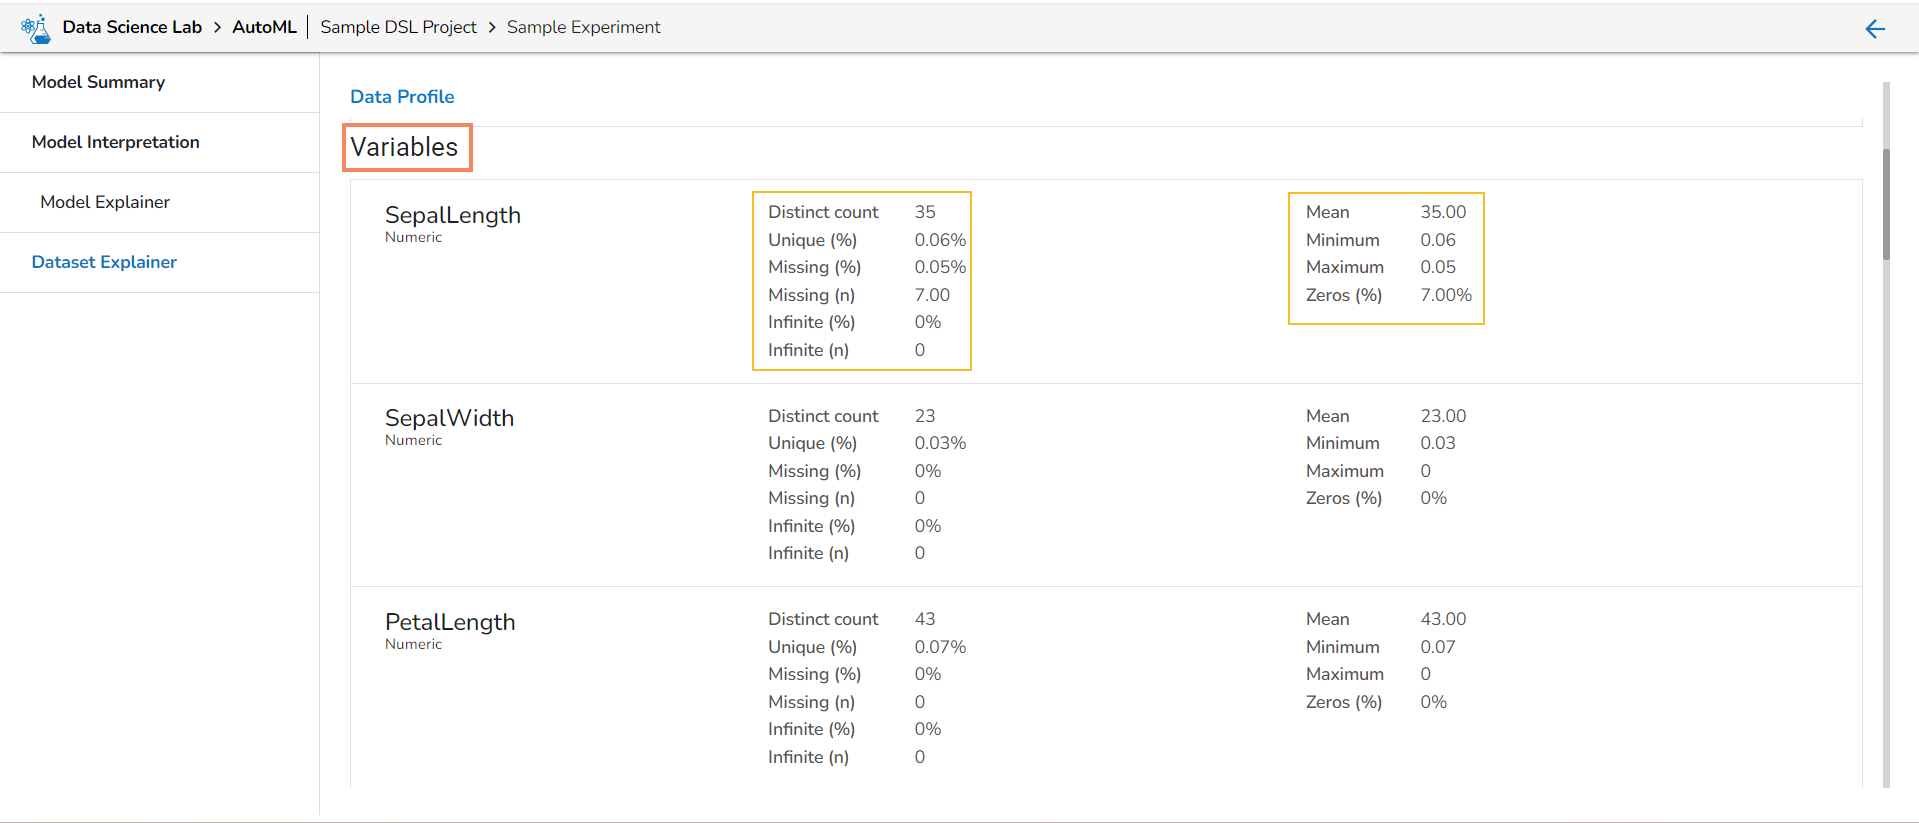
Variables
It lists all the variables from the selected Data Set with the following details:
Distinct count
Unique
Missing (in percentage)
Missing (in number)
Infinite (in percentage)
Infinite (in number)
Mean
Minimum
Maximum
Zeros (in percentage)
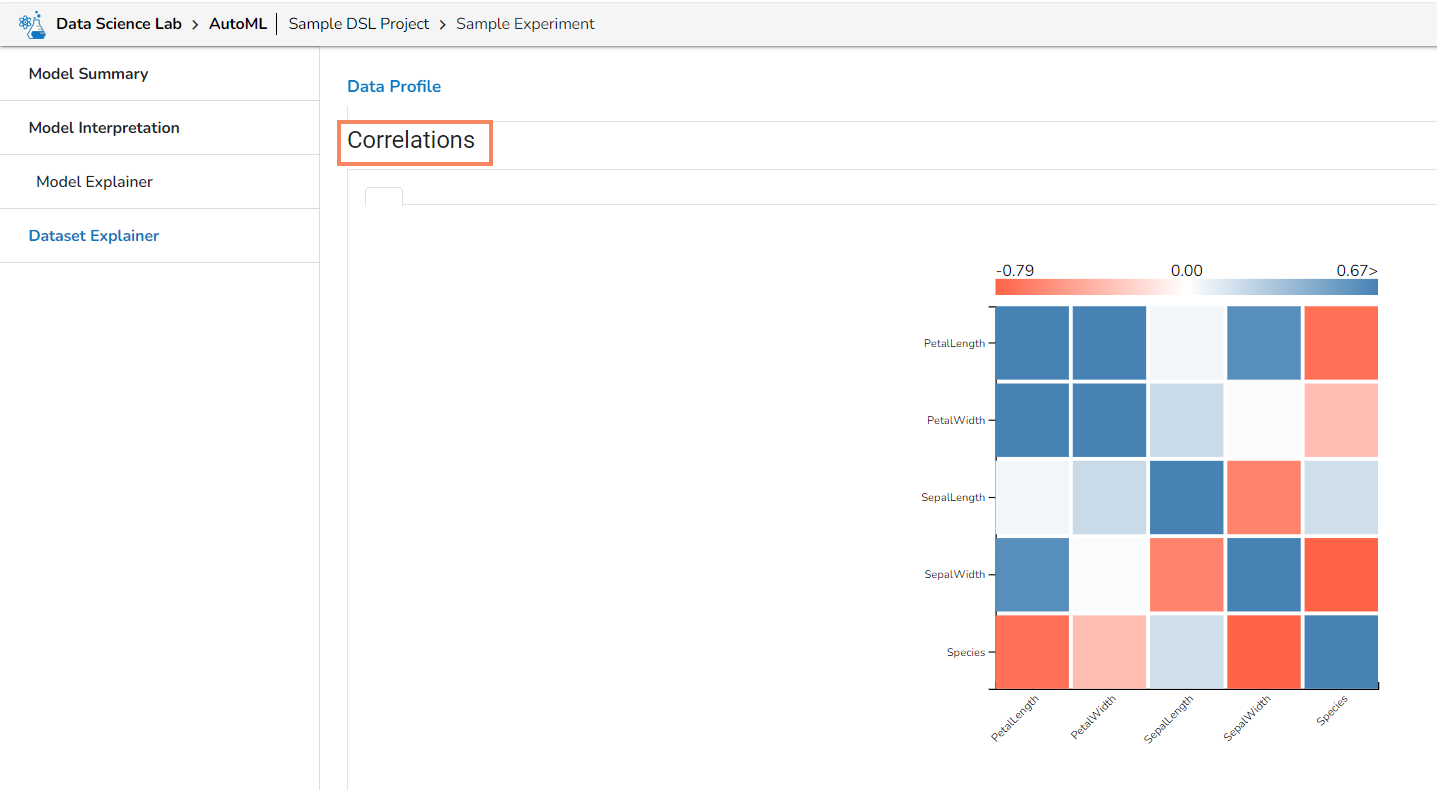
Correlation
It displays the variables in the correlation chart by using various popular methods.
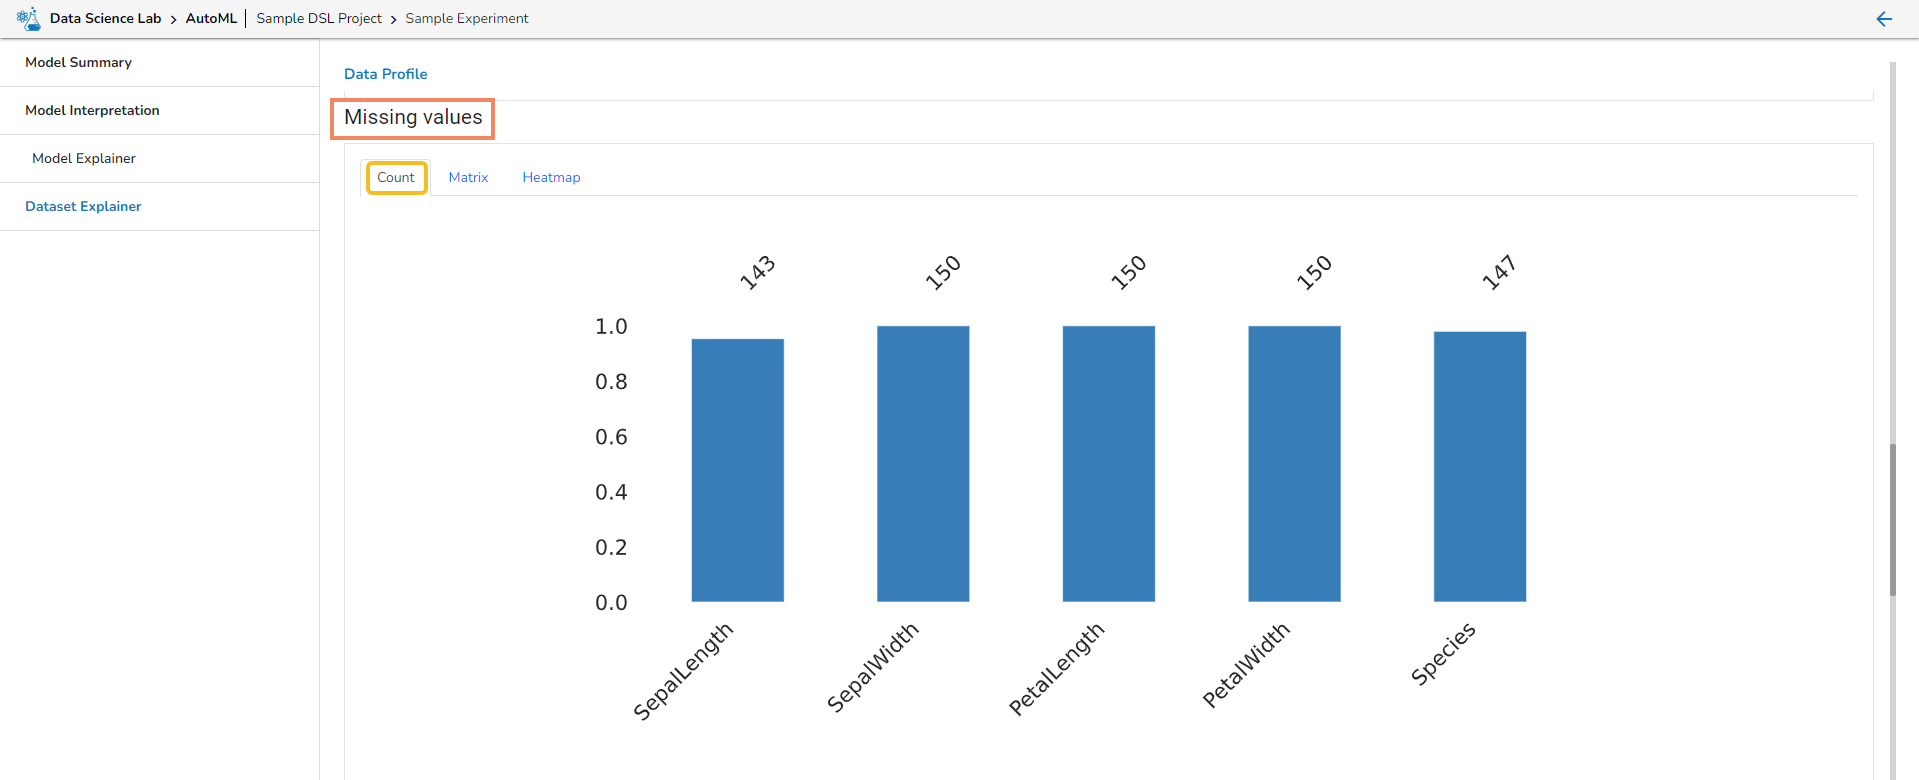
Missing Values
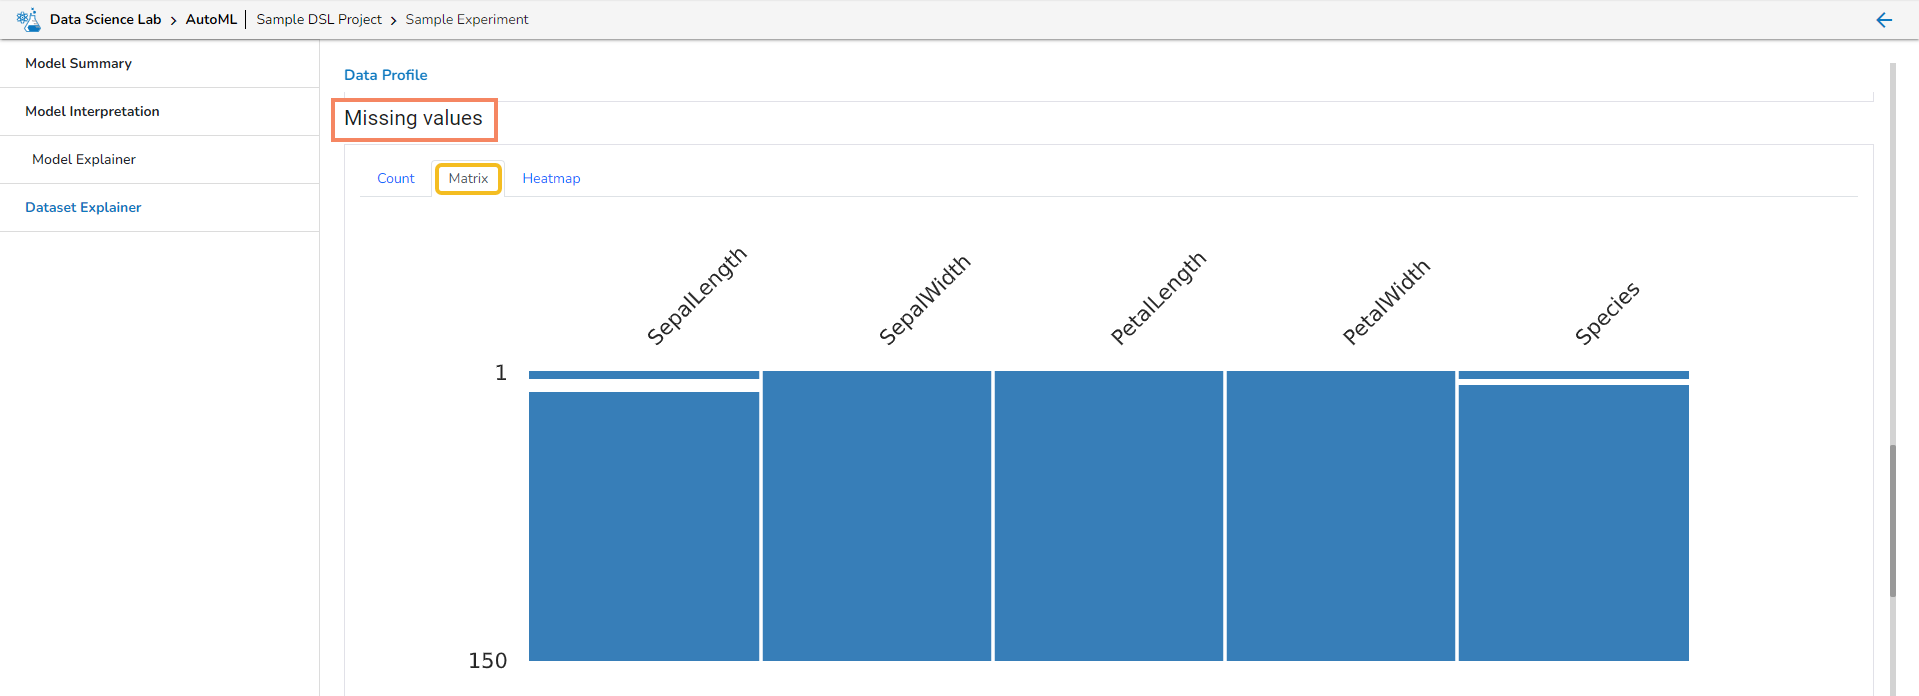
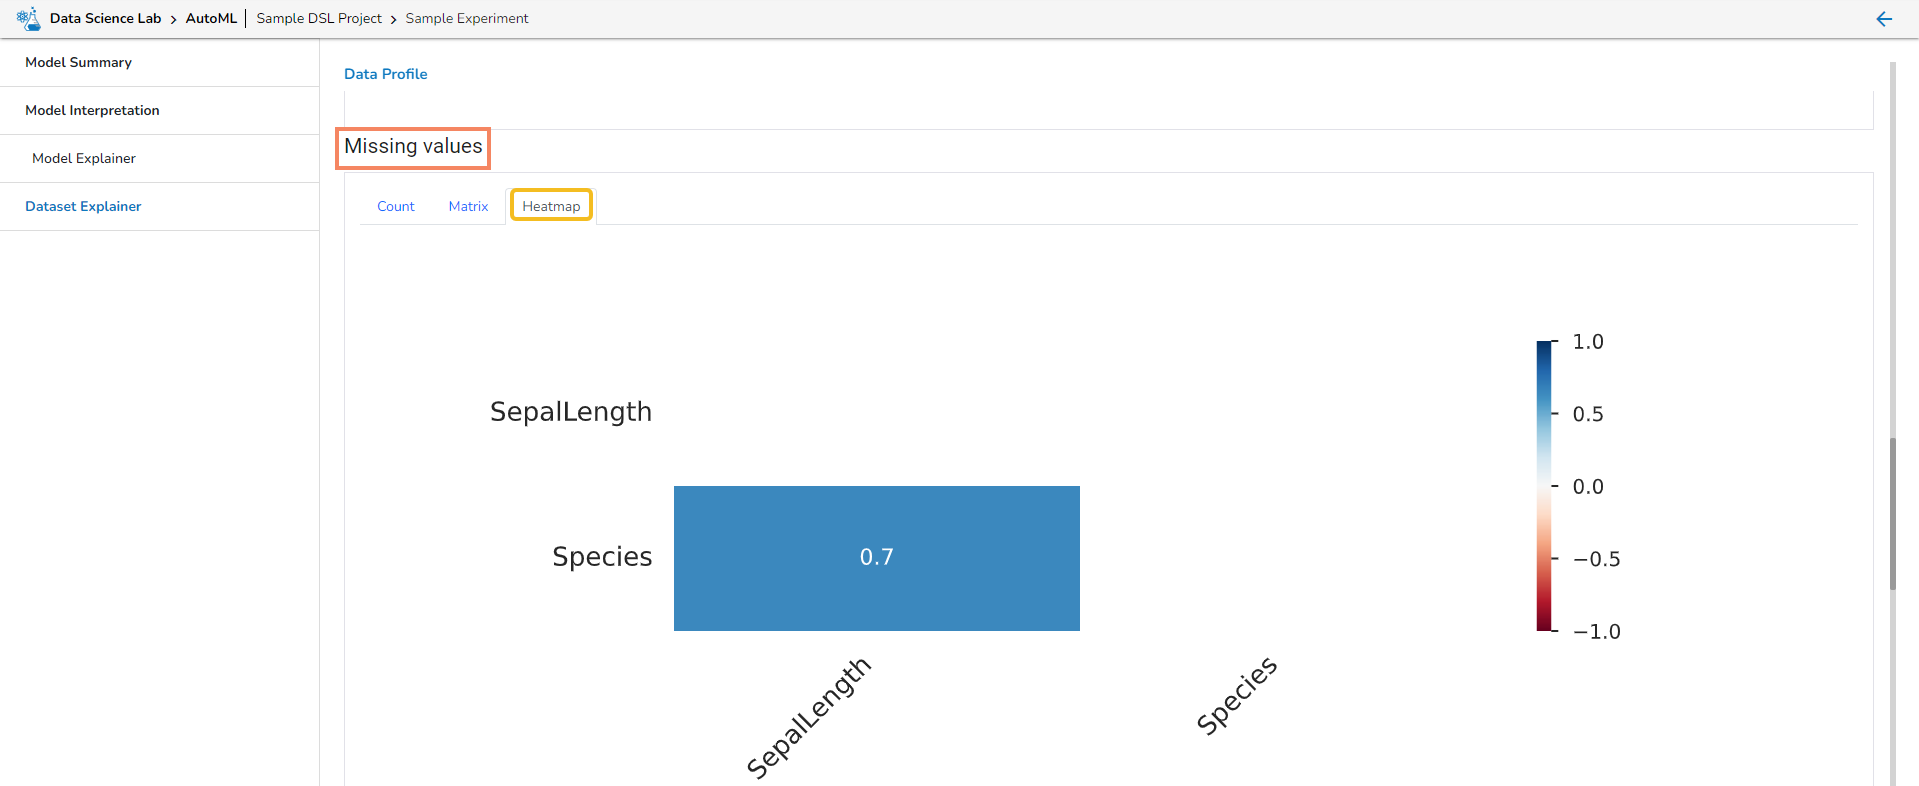
This section provides information on the missing values through Count, Matrix, and Heatmap visualization.
Count: The count of missing values is explained through column chart.
Matrix
Heatmap
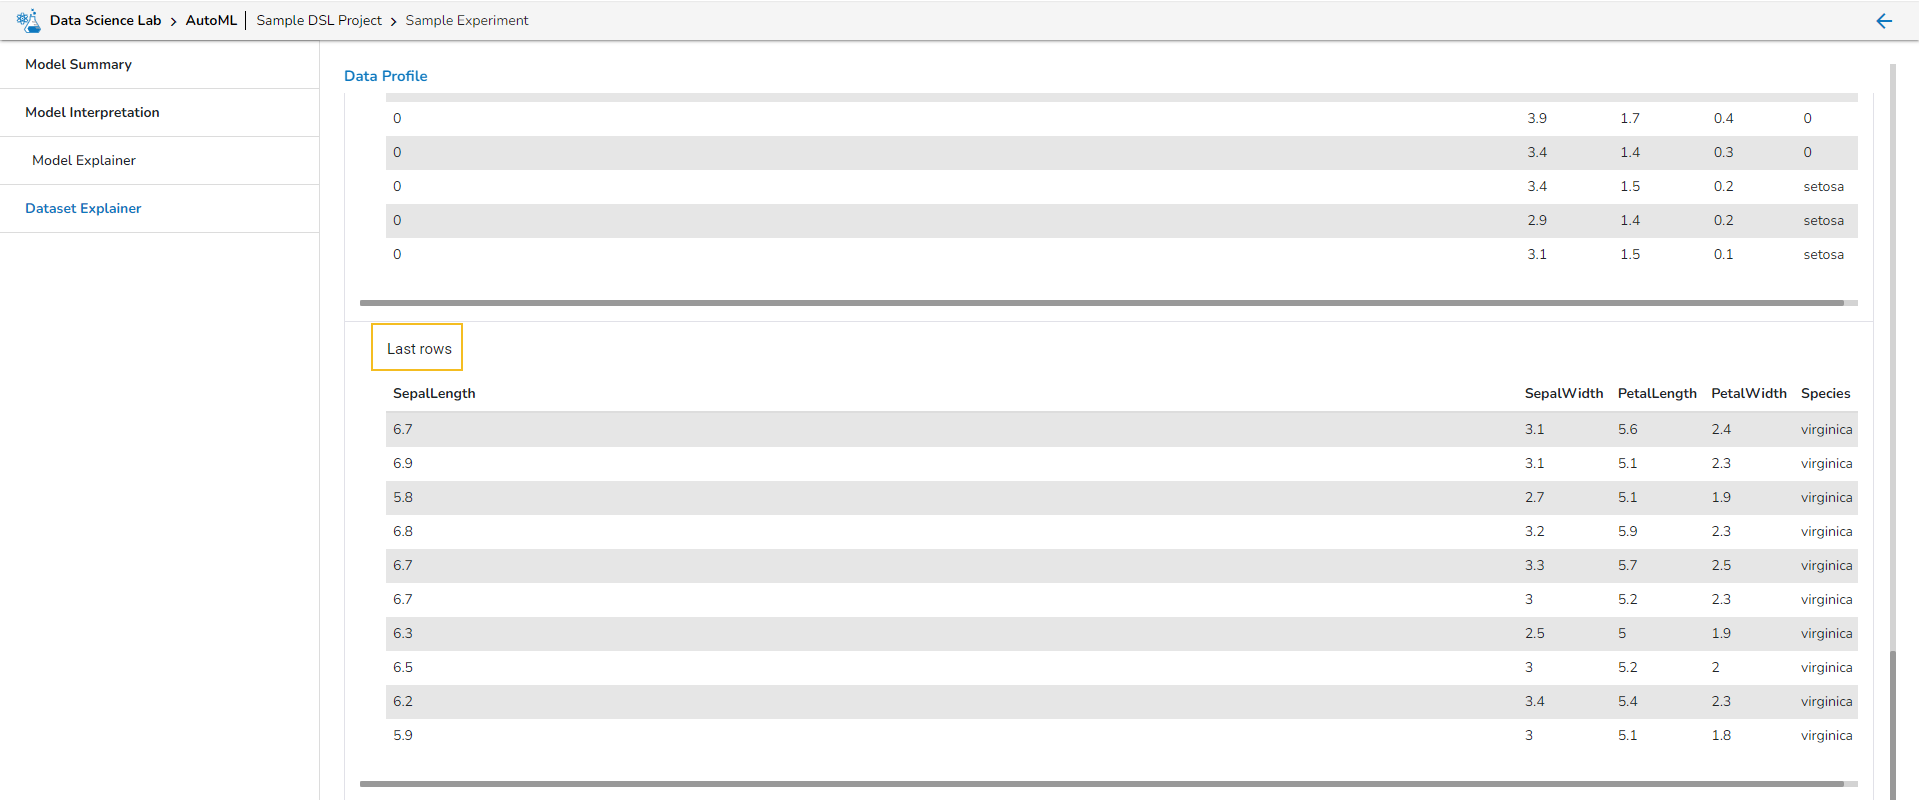
Sample
This section describes the first 10 and last 10 rows of the selected dataset as a sample.
First rows

Last Rows
