Failure Analysis
The Failure Analysis page allows users to analyze the reasons for the failure of the component used in the pipeline.
Check out the below given walk-through for failure analysis in the Pipeline Workflow editor canvas.
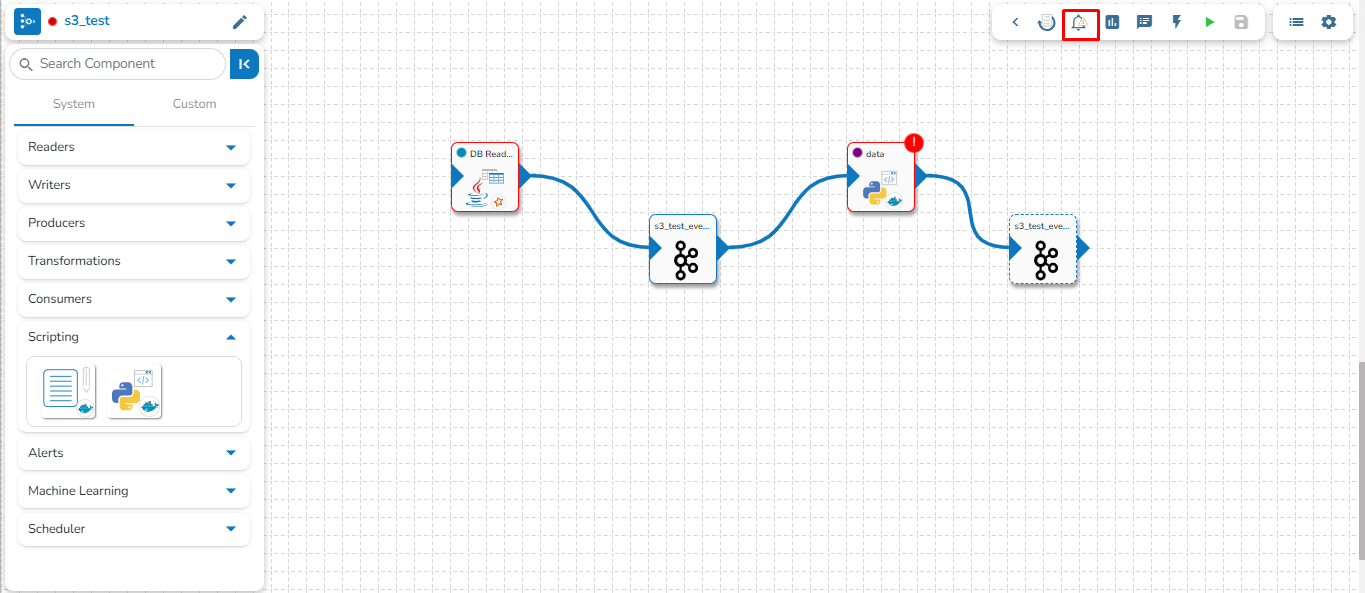
Navigate to the Pipeline Editor page.
Click the Failure Analysis icon.

The Failure Analysis page opens.
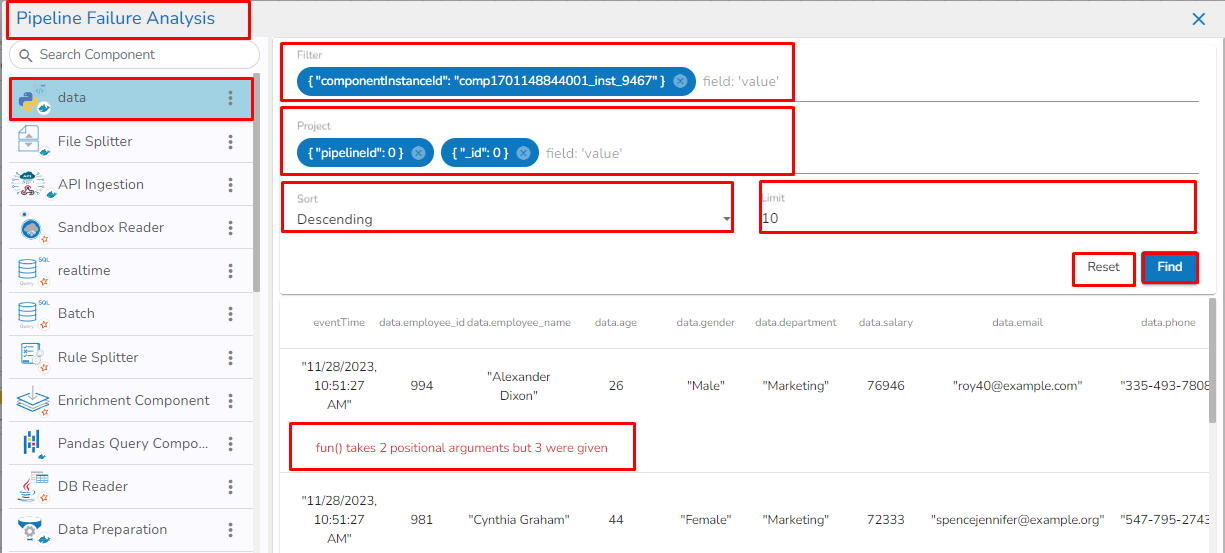
Search Component: A Search bar is provided to search all components associated with that pipeline. It helps to find a specific component by inserting the name in the Search Bar.
Component Panel: It displays all the components associated with that pipeline.
Filter: By default, the selected component instance Id will be displayed in the filter field. Records will be displayed based on the instance id of the selected component. It filters the failure data based on the applied filter.
Please Note the Filter Format of some of the field types.
Field Value Type
Filter Format
String
data.data_desc:” "ignition"
Integer
data.data_id:35
Float
data.lng:95.83467601
Boolean
data.isActive:true
Project: By default, the pipeline_Id and _id are selected from the records. If the user does not want to select and select any field then that field will be set with 0/1 (0 to exclude and 1 to include), displaying the selected column.
Please Note: data.data_id:0, data.data_desc:1
Sort: By default, records are displayed in descending order based on the “_id” field. Users can change ascending order by choosing Ascending option.
Limit: By default, 10 records are displayed. Users can modify the records limit according to the requirement. The maximum limit is 1000.
Find: It filters/sorts/limits the records and projects the fields by clicking on the find button.
Reset: If the user clicks on the Reset button, then all the fields must be reset with a default value.

Cause: The cause of the failure gets displayed by a click on any failed data.
Component Failure & Navigation to Failure Analysis
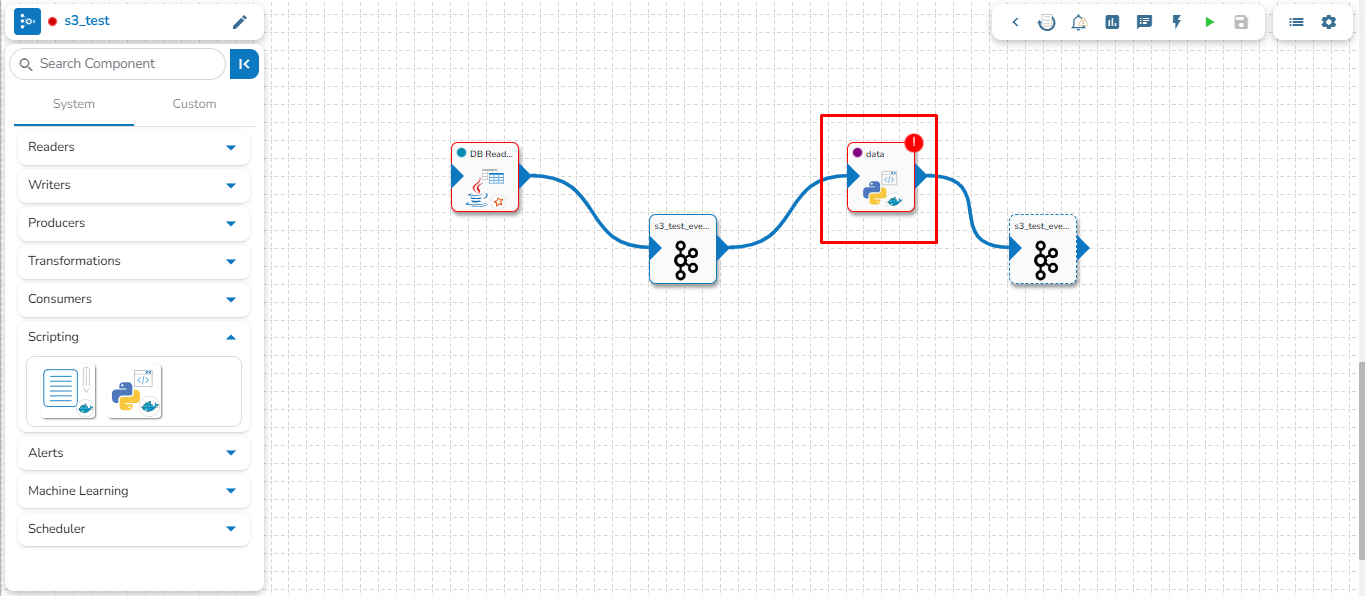
The component failure is indicated by a red color flag in the Pipeline Workflow. The user gets redirected to the Failure Analysis page by clicking on the red flag.
Navigate to any Pipeline Editor page.
Create or access a Pipeline workflow and run it.
If any component fails while running the Pipeline workflow, a red color flag pops-up on the top right side of the component.

Click the red flag to open the Failure Analysis page.
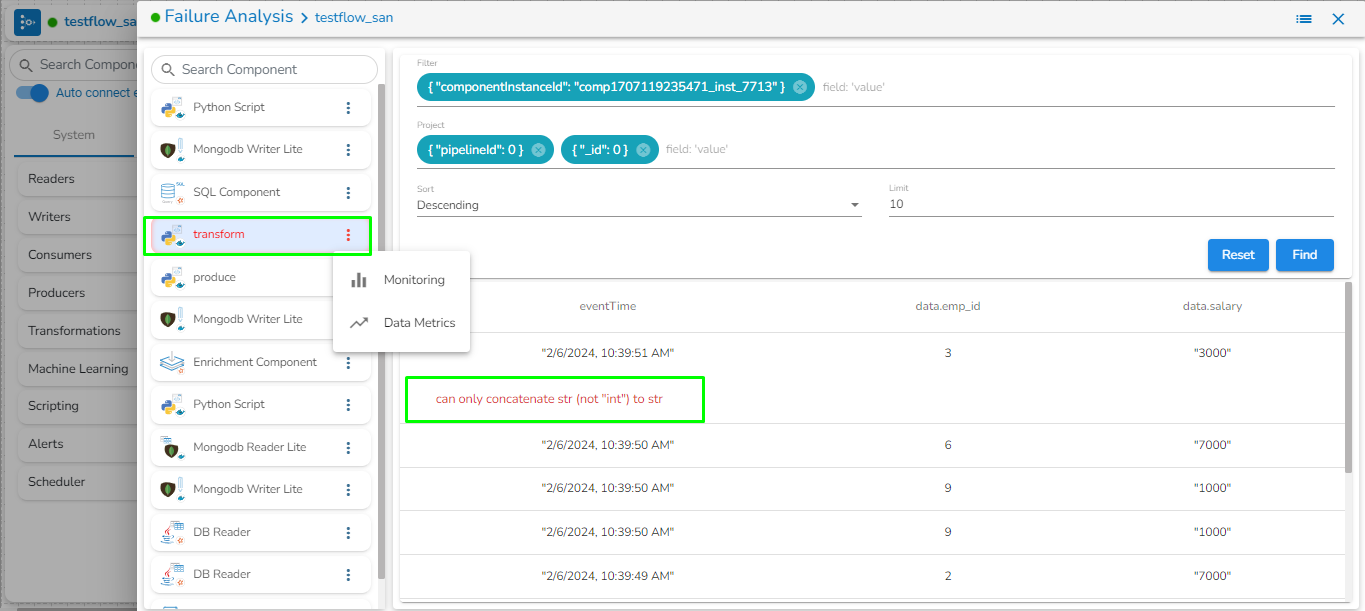
By clicking the ellipsis icon for the failed component from the Failure Analysis page, the user gets options to open Monitoring or Data Metrics page for the component.
The cause of the failure also gets highlighted in the log.
