The user can use the Job Monitoring feature to track a Job and its associated tasks. On this page, the user can view details such as Job Status, Last Activated (Date and Time), Last Deactivated (Date and Time), Total Allocated and Consumed CPU, and Total Allocated and Consumed Memory, all presented together on Job monitoring page.
Please go through the below given walk-through on the Job monitoring function.
Job Monitoring
Accessing Job Monitoring Page
The user can access the Job Monitoring icon on the List Jobs and Job Workflow Editor pages.
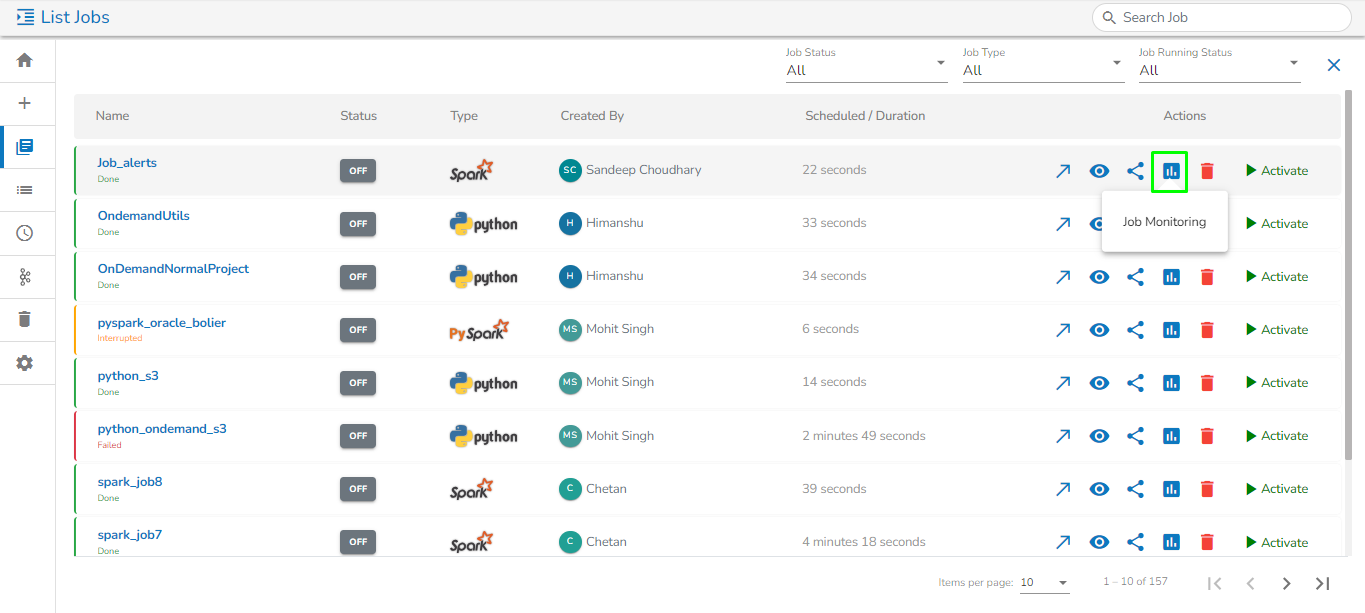
Navigate to the List Jobs page.
The JobMonitoring icon can be seen for all the listed Jobs.
Accessing the Job Monitoring page from the List Jobs page
OR
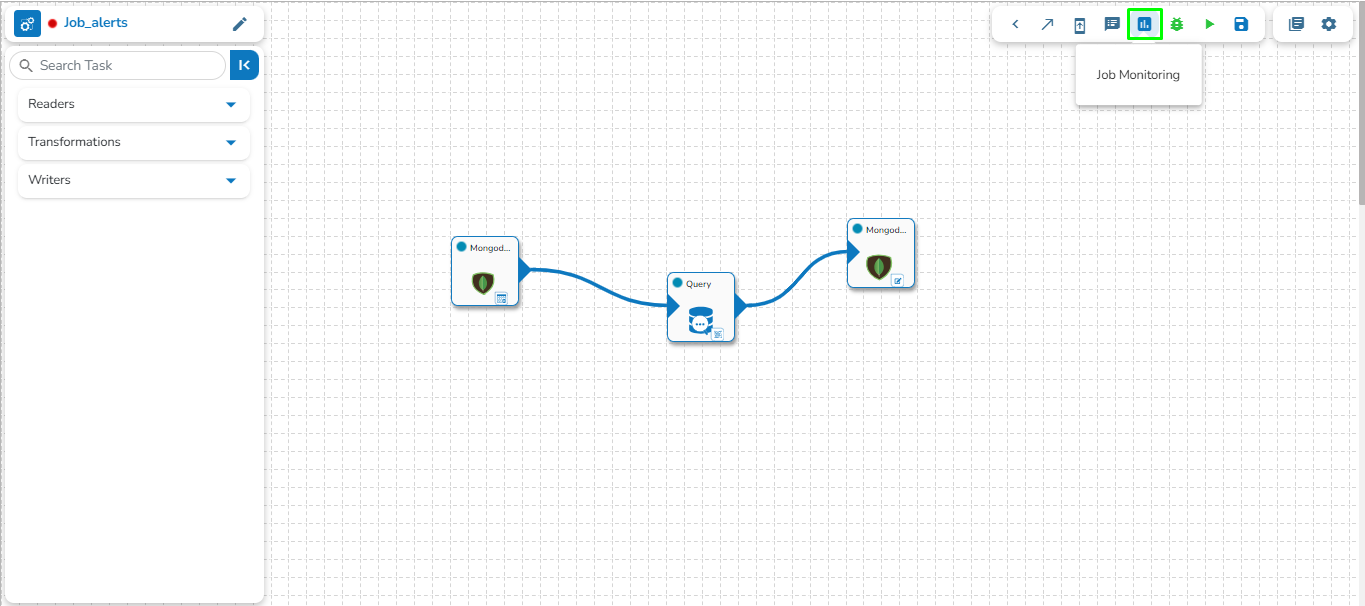
Navigate to the Job Workflow Editor page.
The Job Monitoring icon is provided on the Header panel.
Accessing the Job Monitoring page from the Job Workflow Editor
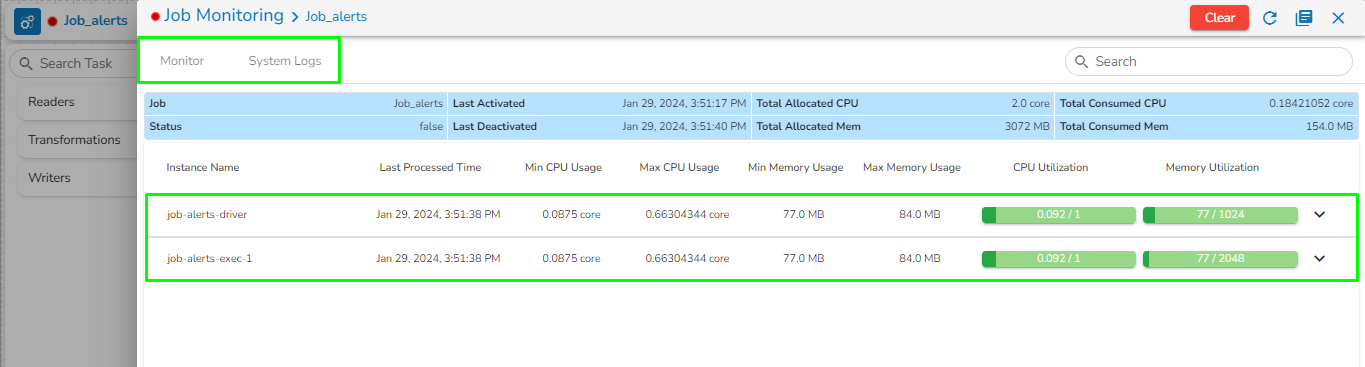
The Job Monitoringpage opens displaying the details of resource usage for the selected job.
The Job Monitoring page displays the following information for the selected Job:
Job: Name of the Job.
Status: Running status of the Job. 'True' indicates the Job is active, while 'False' indicates inactivity.
Last Activated: Date and time when the job was last activated.
Last Deactivated: Date and time when the job was last deactivated.
Total Allocated CPU: Total allocated CPU in cores.
Total Allocated Memory: Total allocated memory in MB.
Total Consumed CPU: Total consumed CPU by the Job in cores.
Total Consumed Memory: Total consumed memory by the Job in MB.
Instance Name: Instance name of the Job (e.g., Driver and Executors for Spark and PySpark Jobs).
Last Processed Time: Last processed time of the instance.
Min CPU Usage: Minimum CPU usage in cores by the instance.
Max CPU Usage: Maximum CPU usage in cores by the instance.
Min Memory Usage: Minimum memory usage in MB by the instance.
Max Memory Usage: Maximum memory usage in MB by the instance.
CPU Utilization: Total CPU utilization in cores by the instance.
Memory Utilization: Total memory utilization in MB by the instance.
There are two tabs present on the Job Monitoring page:
Monitor: This tab will show all the resource allocated and consumption details for each task or instance in the job.
System Logs: This tab will show the Pods logs of the Job.
Please Note:The system logs on the monitoring page will be displayed only when the Job is active.
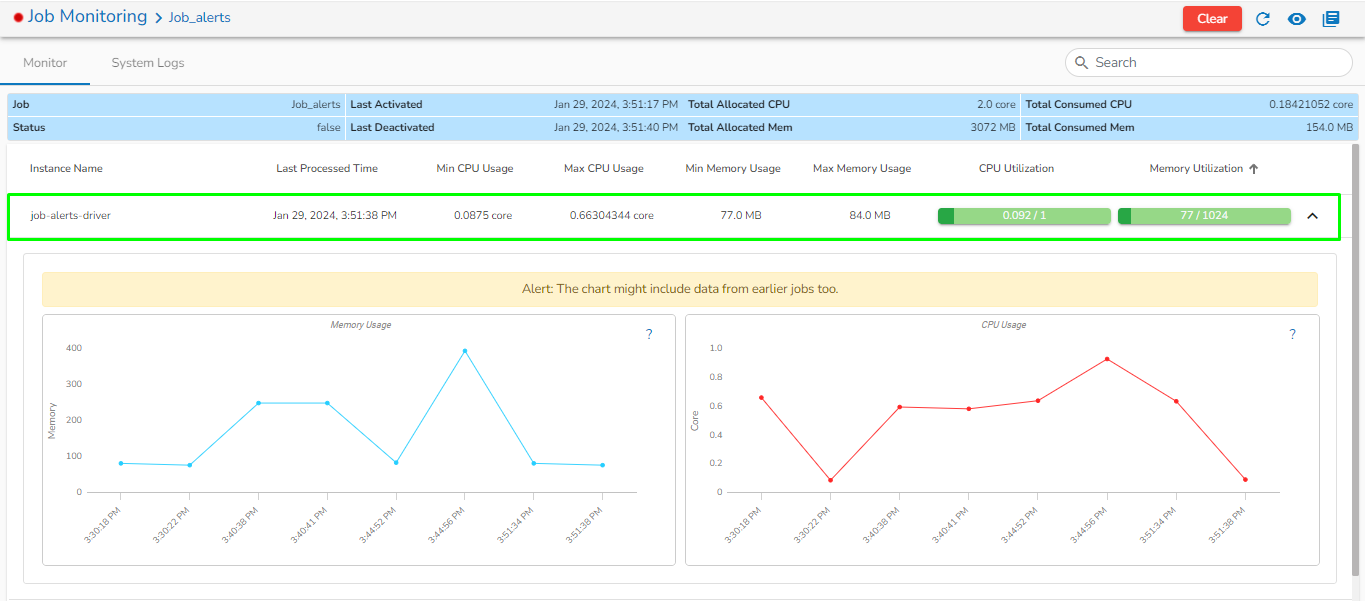
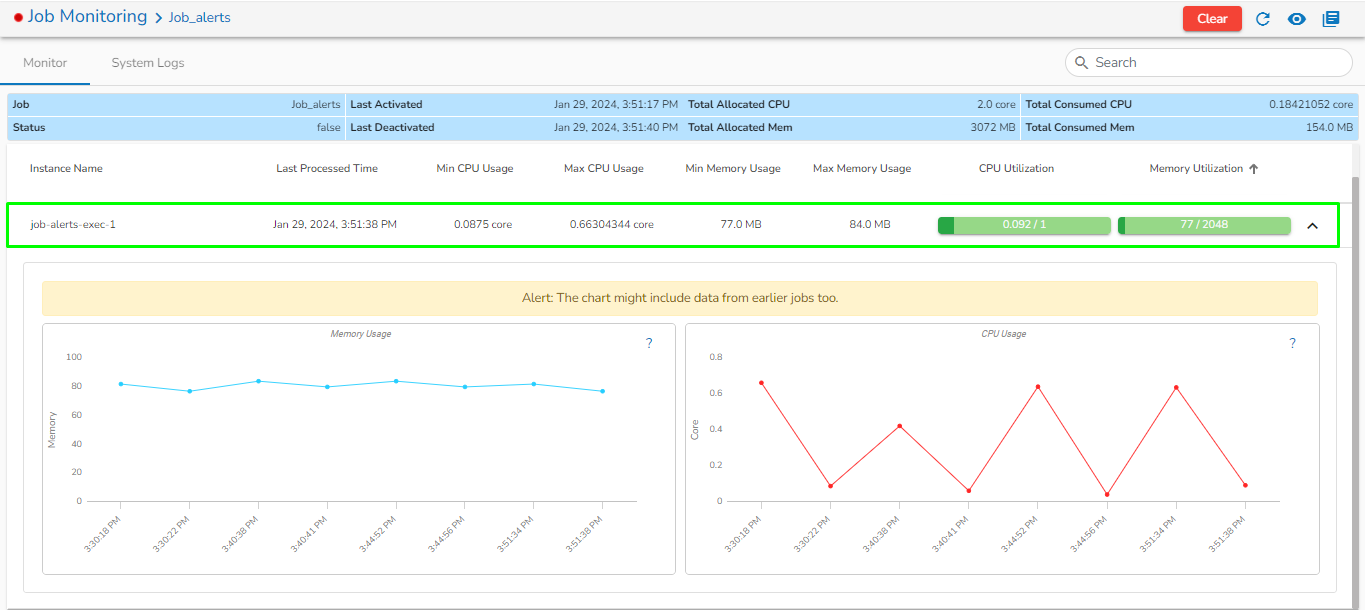
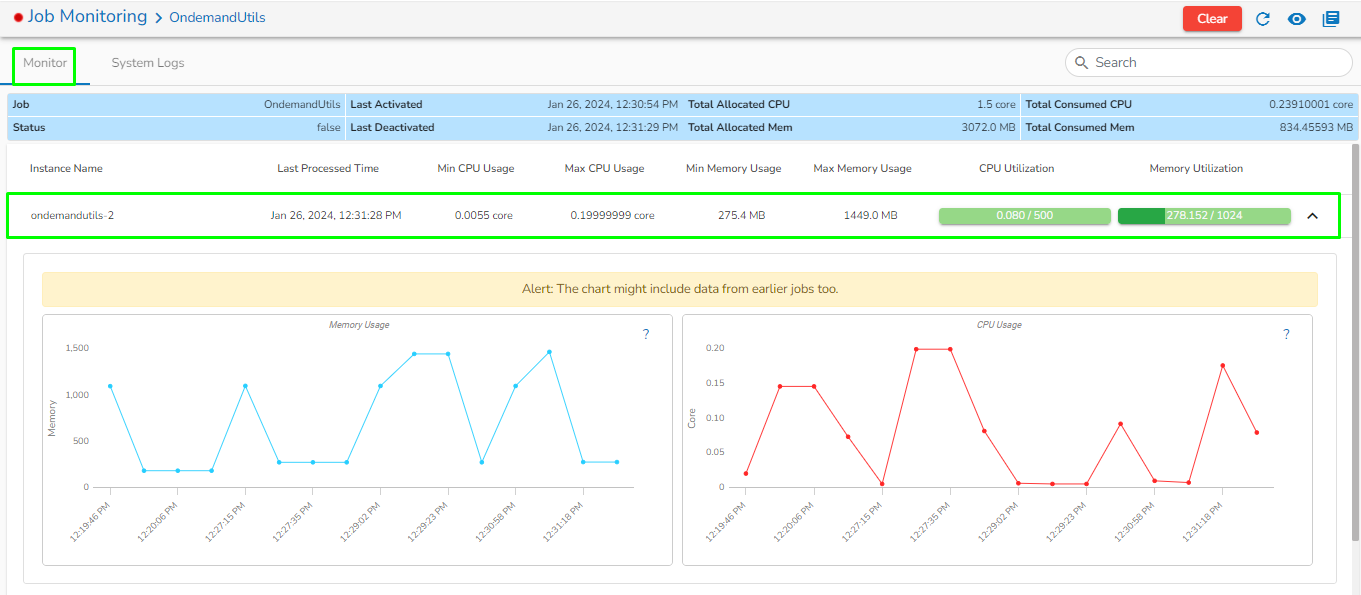
Once the user clicks on any instance, the page will expand to show the graphical representation of CPU and Memory usage over the given interval of time. For reference, please see the images below.
Monitoring Page for a Spark Job
The below-given images displays Monitoring page for the Spark Job with details on the Spark driver and executor.
JobMonitoring page for a Spark Job
Displaying the monitoring details of the Spark Job Driver
Job Monitoring page for a Spark Job - Driver
Displaying the monitoring details of the Spark Job Executer
Job Monitoring page for a Spark Job - Executer
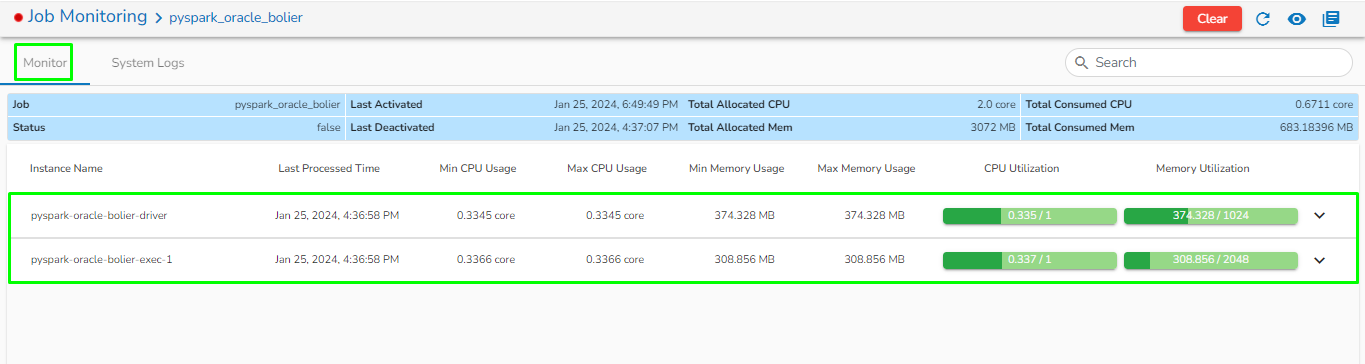
Monitoring Page for a PySpark Job
The below-given images displays Monitoring page for the PySpark Job with details on the PySpark driver and executor.
JobMonitoring page for a PySpark Job
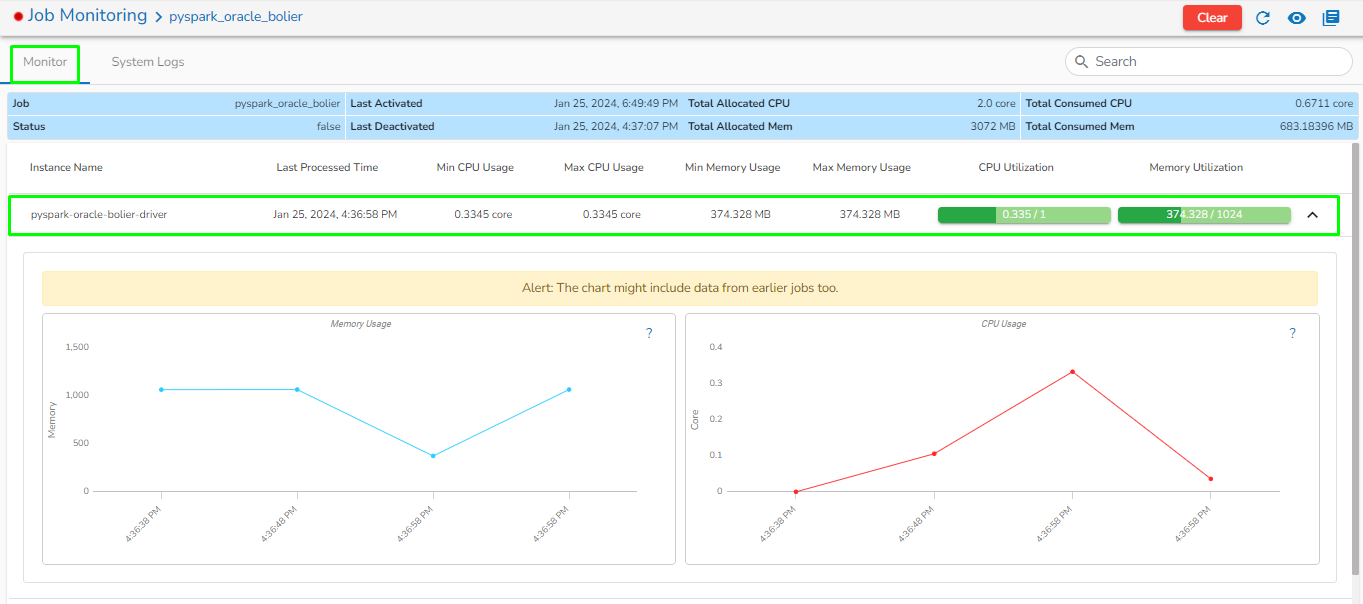
Displaying the monitoring details of the PySpark Job Driver
Job Monitoring page for a PySpark Job- Driver
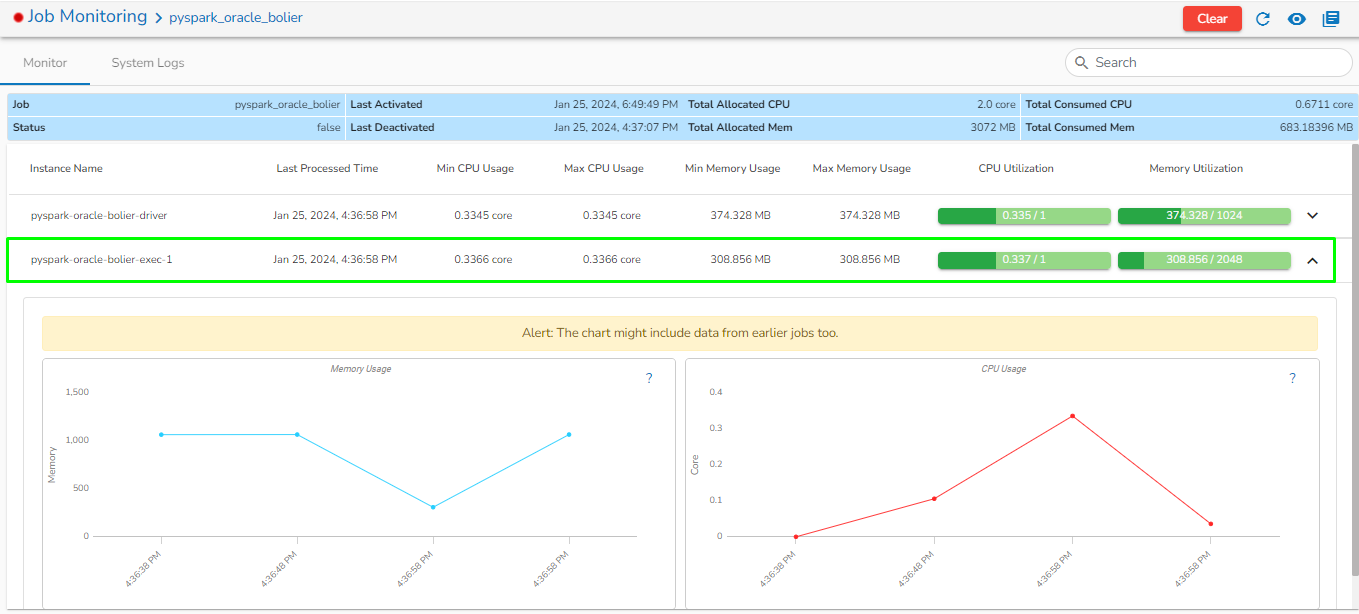
Displaying the monitoring details of the PySpark Job Executer
JobMonitoring page for a PySpark Job- Executer
Monitoring Page for a Python Job
JobMonitoring Page for a Python Job
If Memory or Core allocated to the component is less than required, then it will be displayed in red color as shown in the below image.
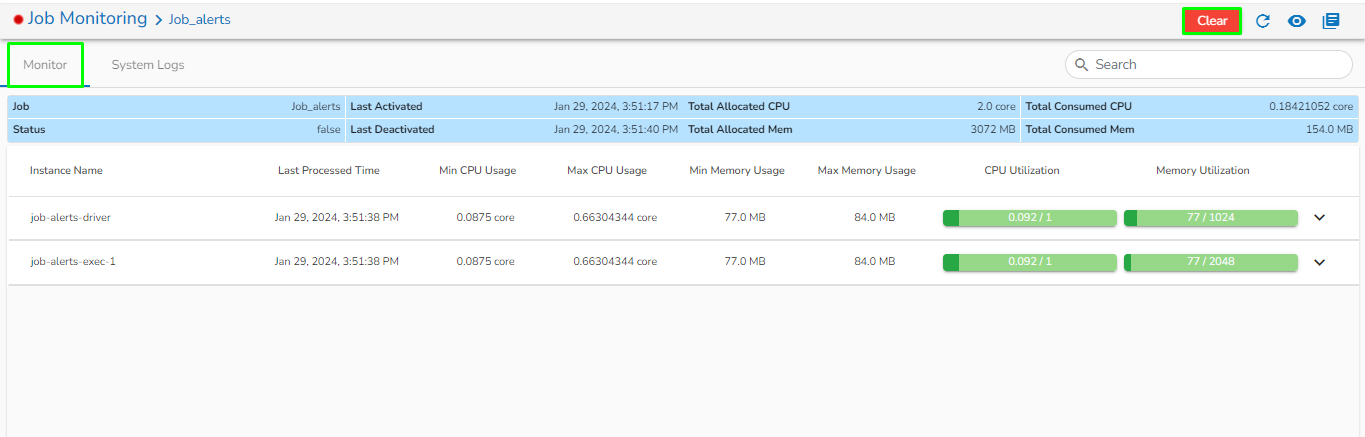
Clear: It will clear all the monitoring details of the selected Job.