# Geo chart
Geo chart uses geographic locations as the basis for displaying data. It is used to display data on a map, and can be used to show information such as population density, sales data, or weather patterns. Common types of Geo map charts include Choropleth maps which color regions according to data values, and point maps, which display data as individual points on the map.
The Leaflet is an open-source JavaScript library for creating interactive maps. It is designed to be lightweight and easy to use, and can be used to create a wide variety of map-based visualizations, including geo map charts. This chart is created using an open-source tool called Leaflet.
## **Best Situations to Use a Geo chart**
To display widely spread data or processes in the geographical setup.
### **Examples**
* Sales: A point map can be used to display the locations of retail stores and their sales figures, allowing businesses to identify areas where sales are high or low.
* To analyze the recruitment process.
{% hint style="info" %}
*Please Note: The Geo chart will get plotted using data that contains longitude and latitude as dimension and need to specify the same in the cell type.*
{% endhint %}
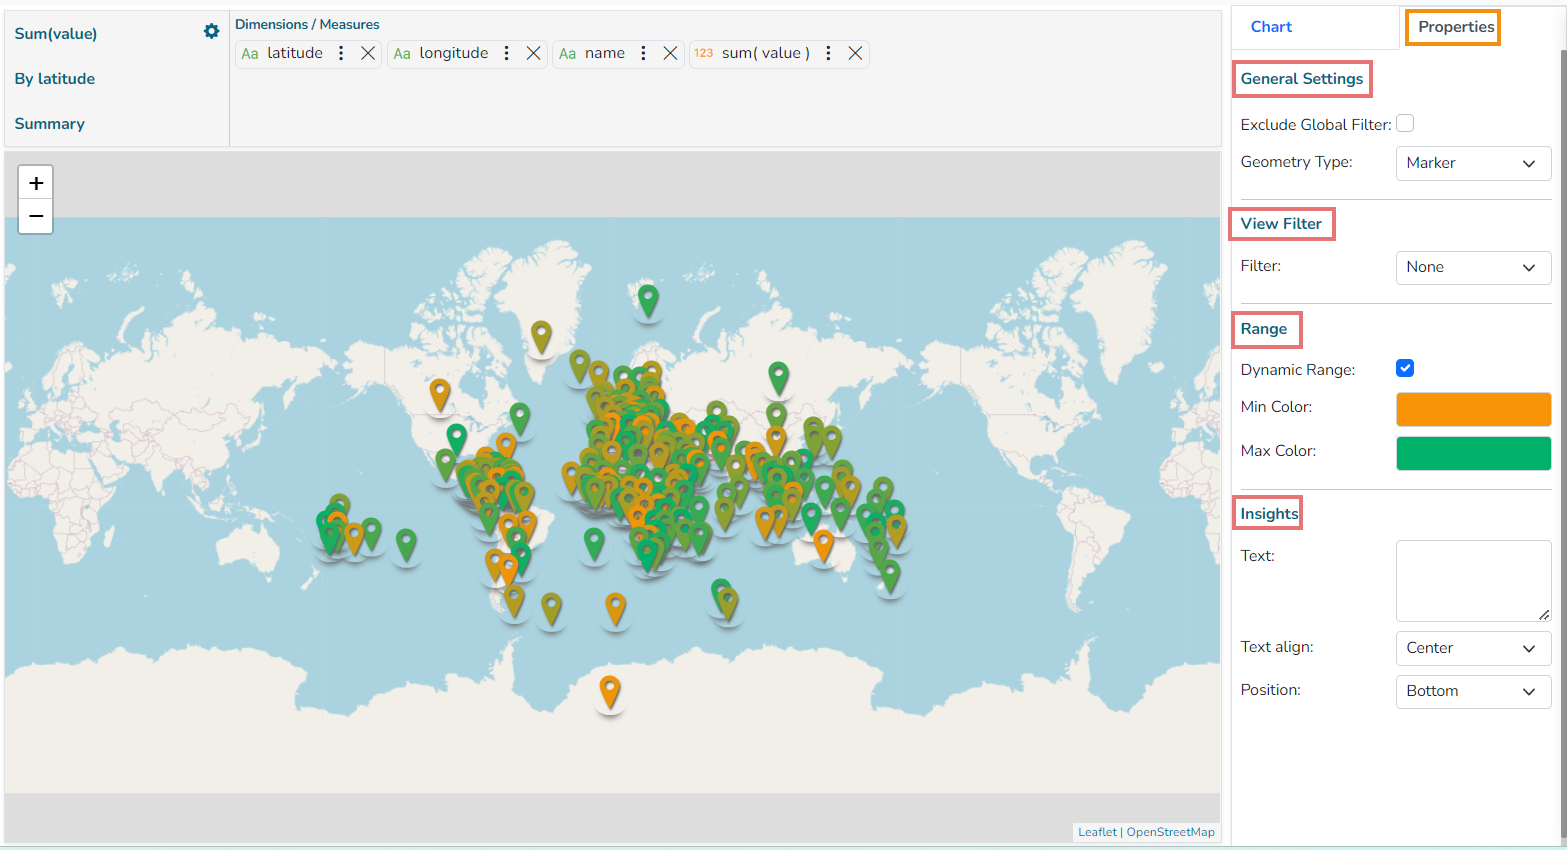
## Properties
### General Settings
**Exclude Global Filter:** By enabling this option, the View gets excluded from the Global Filter.
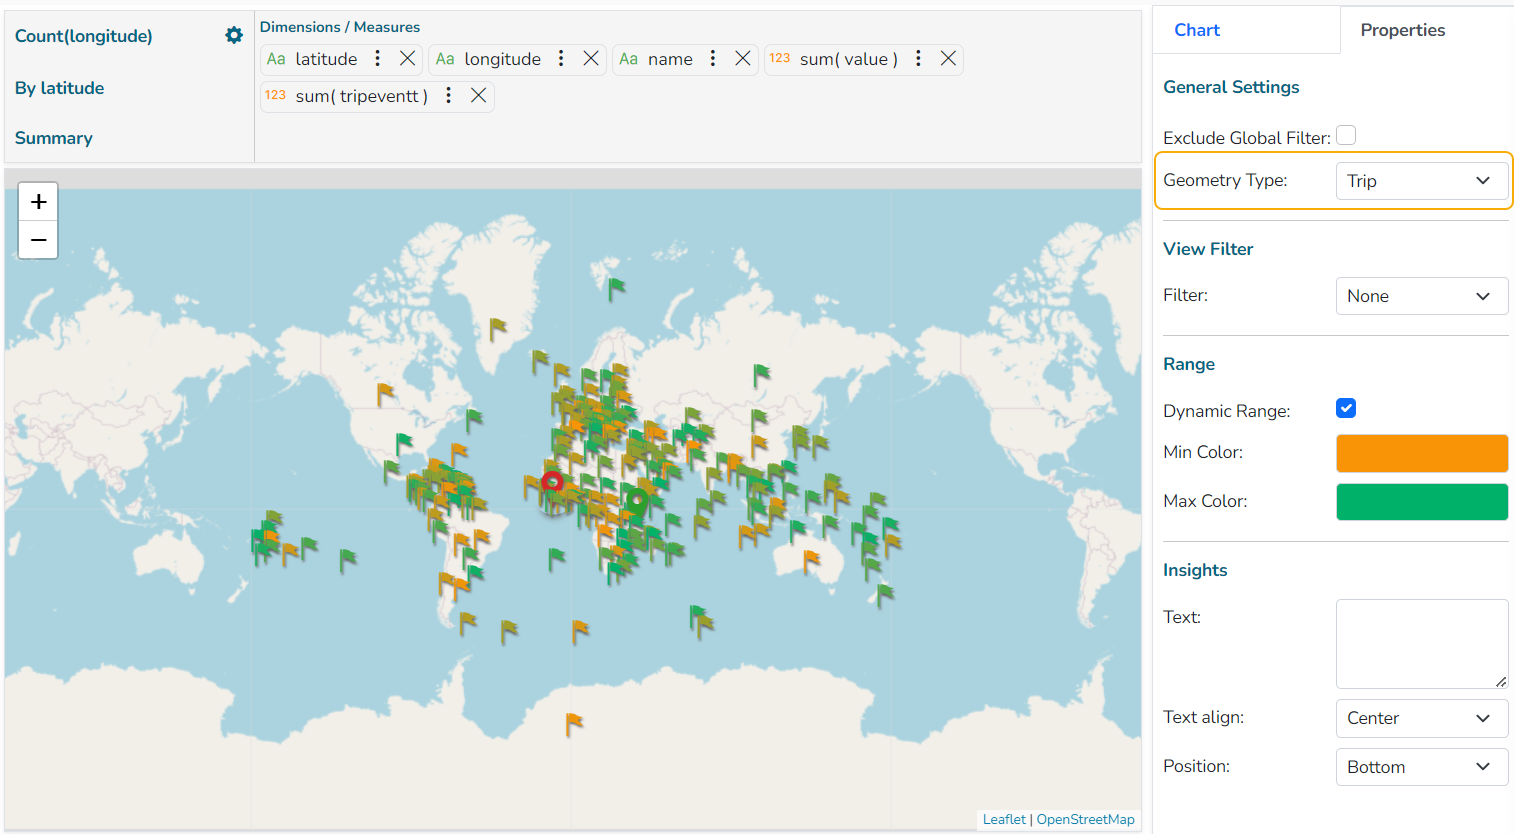
**Geometry Type:** Select an option from the drop-down menu. the supported options are Marker, Clustered, Trail, and Trip.
### View Filter
**Filter**: Select a filter option from the drop-down.
### Range
**Dynamic Range**: Enable this option to access the dynamic range.
**Min Color**: Select a color for the minimum range.
**Max Color**: Select a color for the maximum range.
### Insights
* **Text:** *Provide any information regarding the chart. If any digit or character is required to be highlighted, put it inside two asterisks. (E.g., \*70%\* or \*skills\*).*
* **Text align:** There are three alignments to align the text.
* Left
* Right
* Centre
* **Position:** There are two options to position the text.
* Bottom
* Right
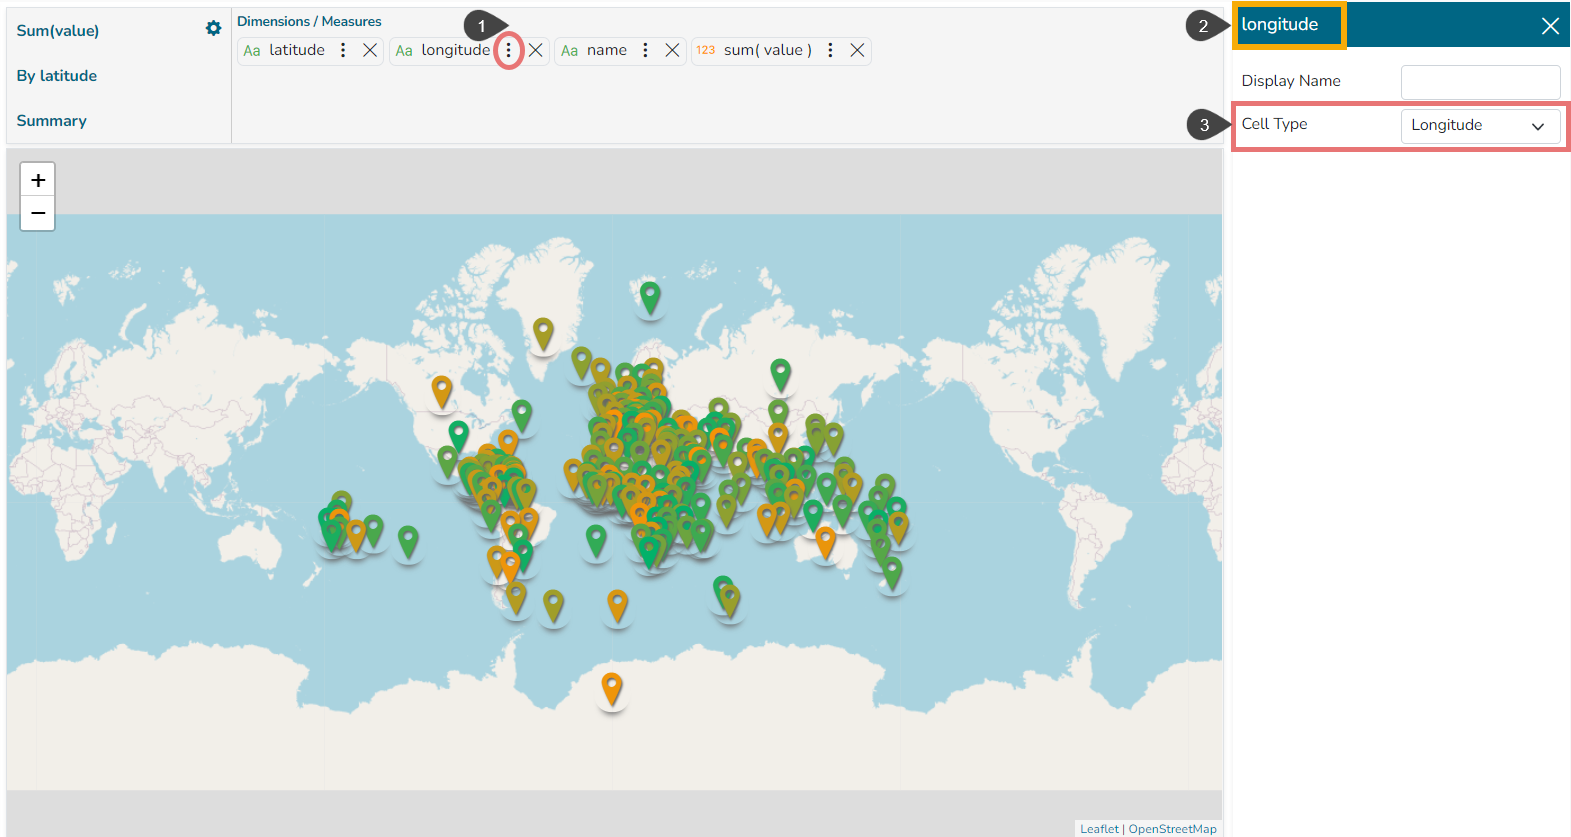
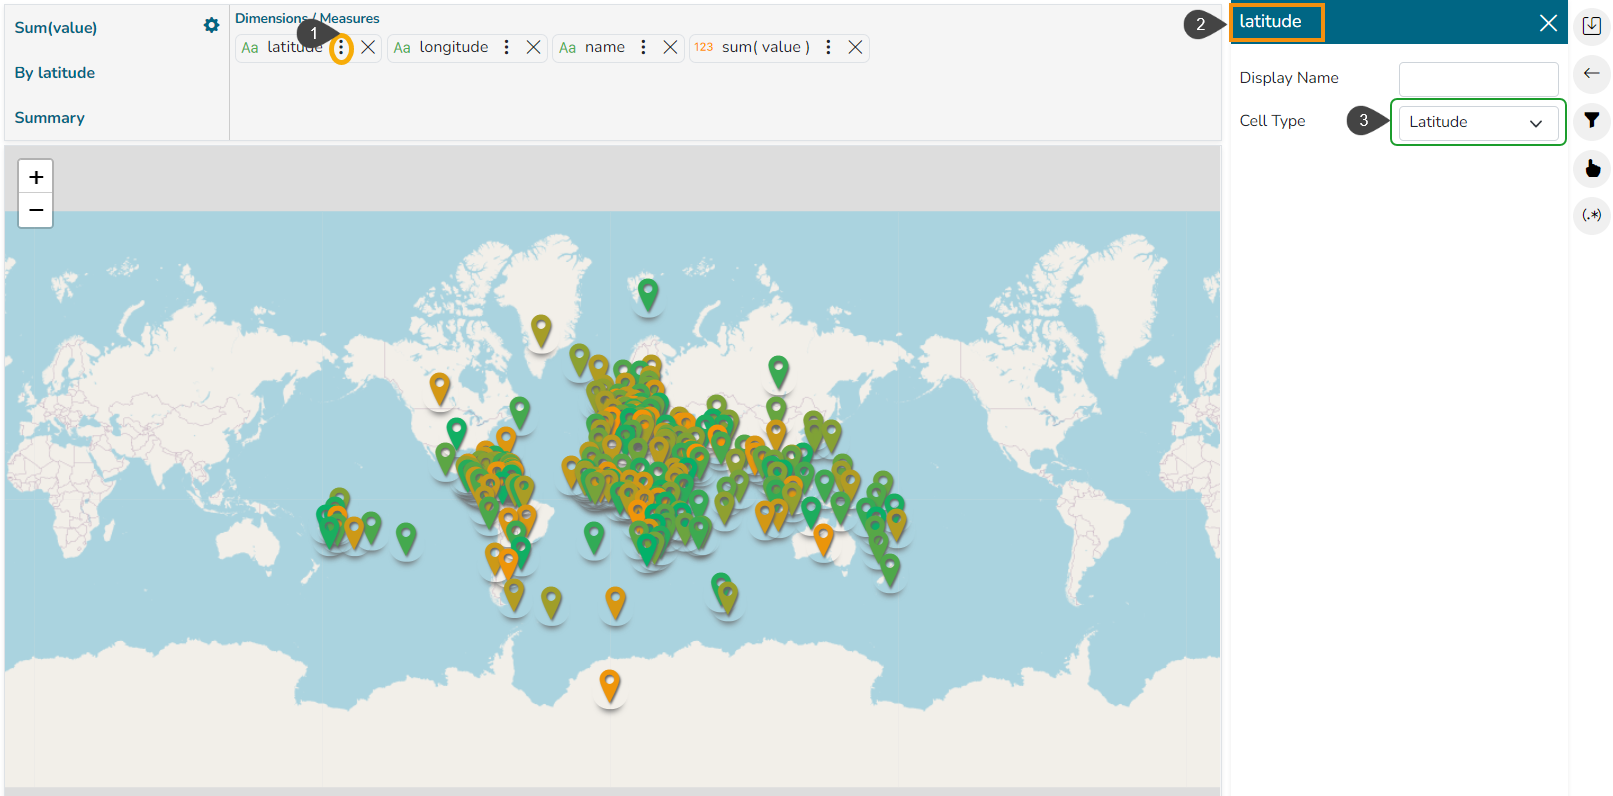
## Configuring Series Properties
The user needs to configure the **Series Properties** for the dragged **Latitude** and **Longitude** dimensions to plot the Geo chart.
* Click the ellipsis icon for the dragged ***Latitude/ Longitude*** dimension.
* The Properties tab for the selected dimension opens on the right side.
* Select the ***Cell Type*** option with a valid option (Select Latitude for the dragged Latitude dimension and Longitude for the Longitude dimension).
Configuring the Longitude series properties
Configuring the Latitude series properties
{% hint style="info" %}
*Please Note: The user can change the display by selecting an option from the **Geometry Type** drop-down menu.*

{% endhint %}
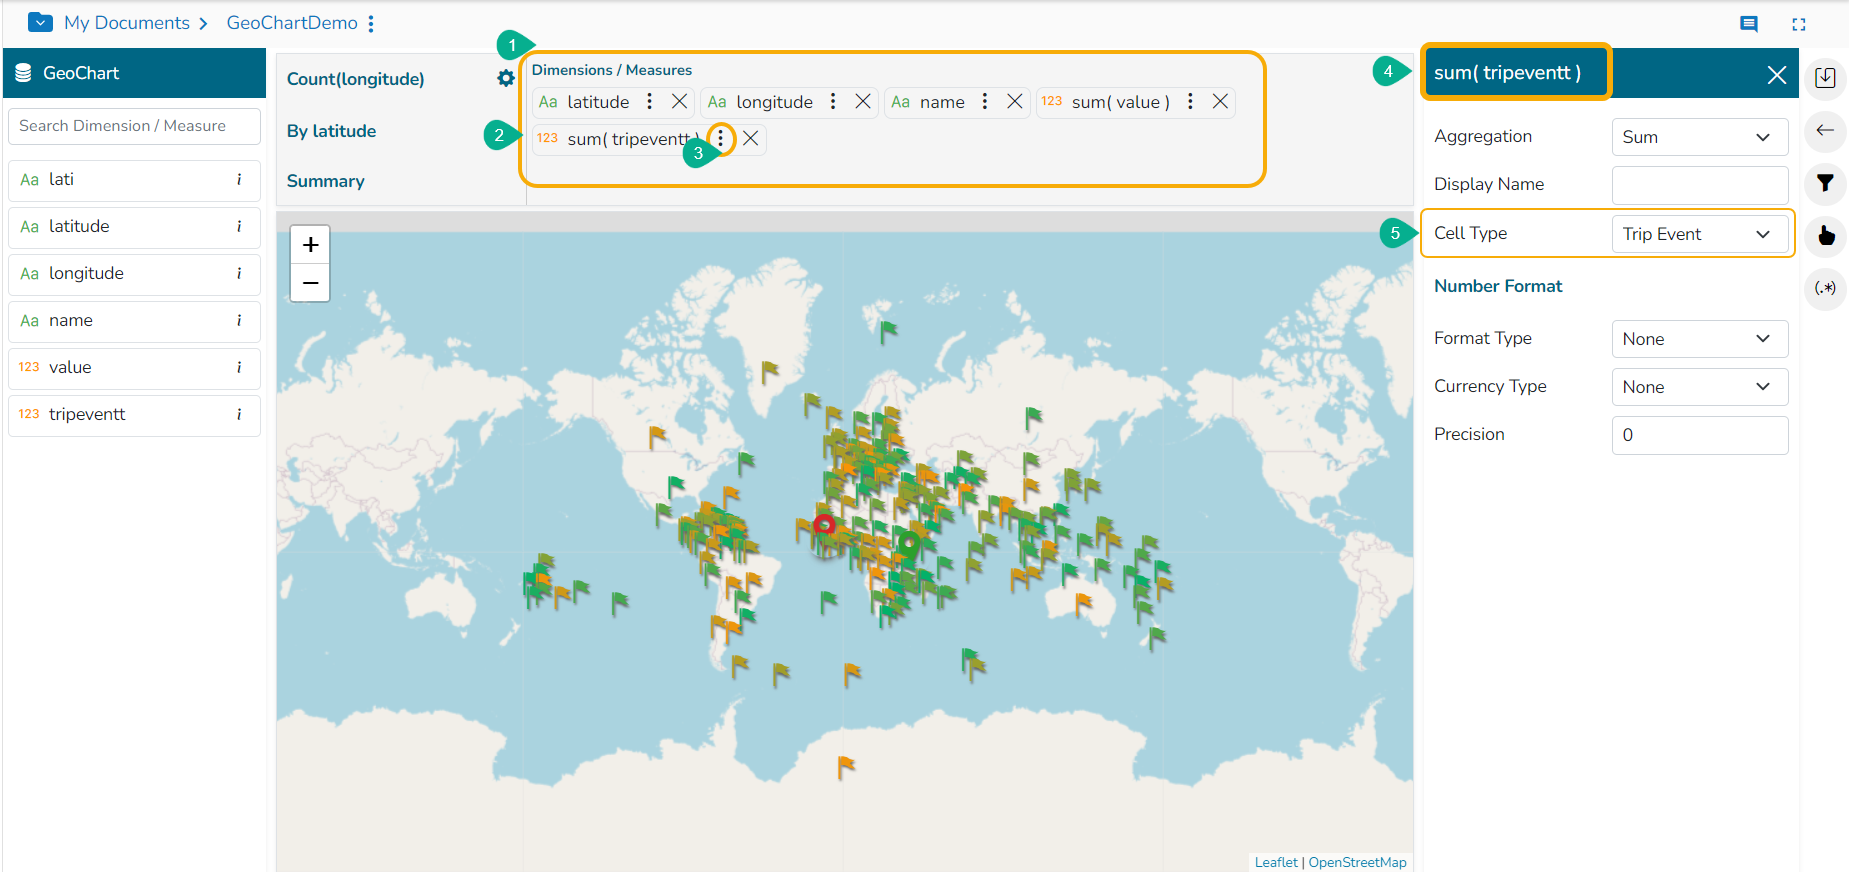
## Displaying Trip Geometry Type
* Drag and drop required Dimensions and Measures to plot a View.
* Make sure that a relevant ***Measure*** has been dragged to the Dimensions/Measures box. E.g., ***tripevntt*** in the given image.
* Click the ellipsis icon provided for the dragged Measure.
* The ***Properties tab*** for that dragged ***Measure*** opens on the right side.
* Select the ***Cell Type*** option as Trip Event.
* Make sure that the selected **Geometry Type** is ***Trip***.