
Data Preparation Landing Page
The user can access the Data Grid view of the selected dataset by clicking on the Data Preparation icon. The displayed data in the grid changes based on the number of transforms performed on it.
The Data Grid in the BDB Data Preparation is used for visualizing the data. The data displayed in the grid is a sample from the actual data set or complete data based on the data volume.
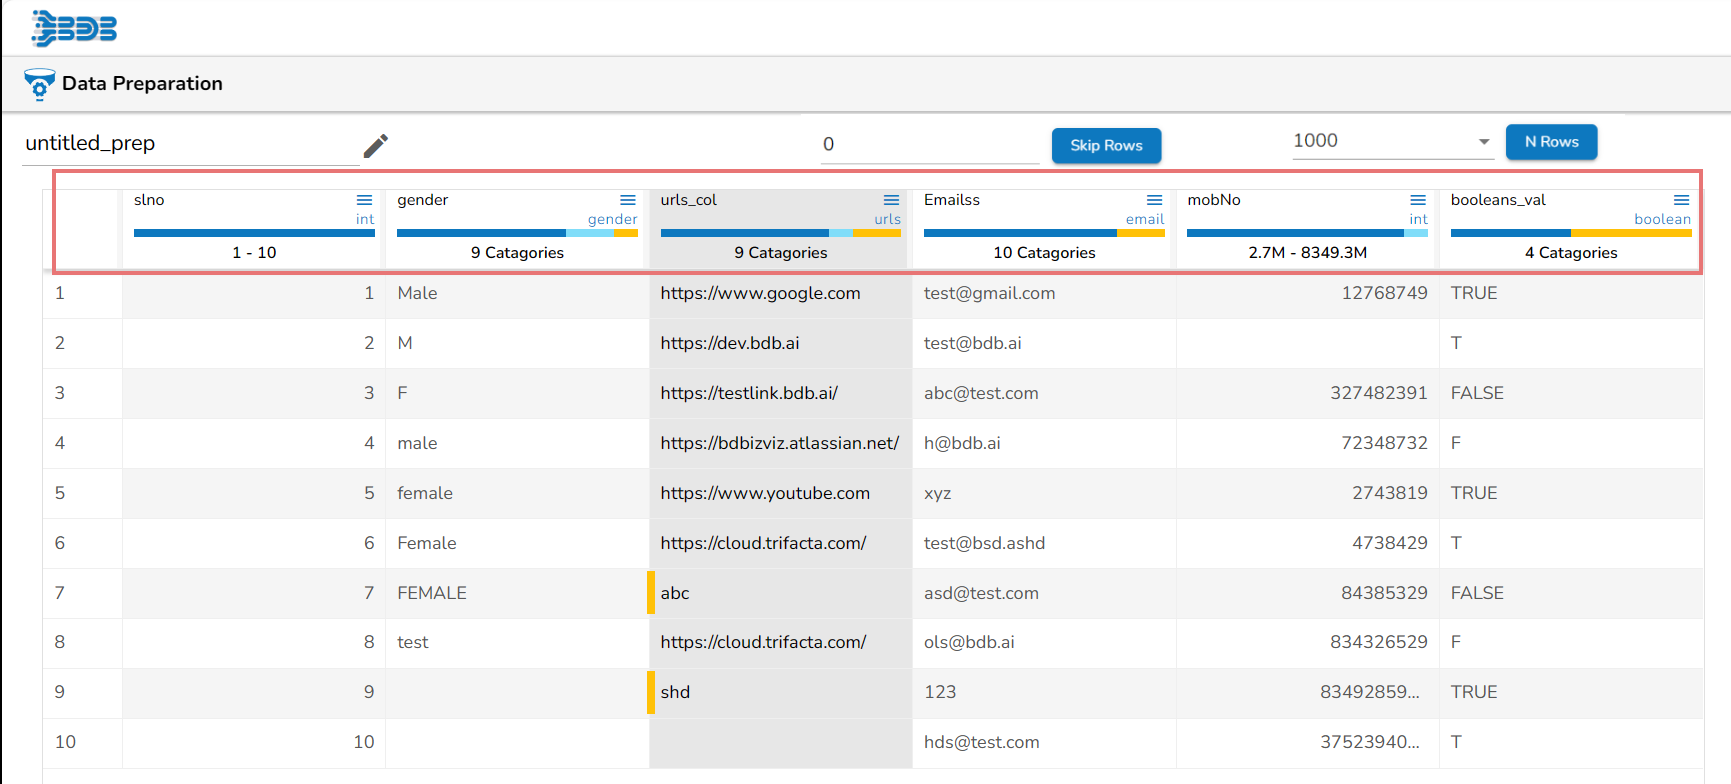
Data Grid Header
The grid has a header that displays the column name and column type from the selected dataset.
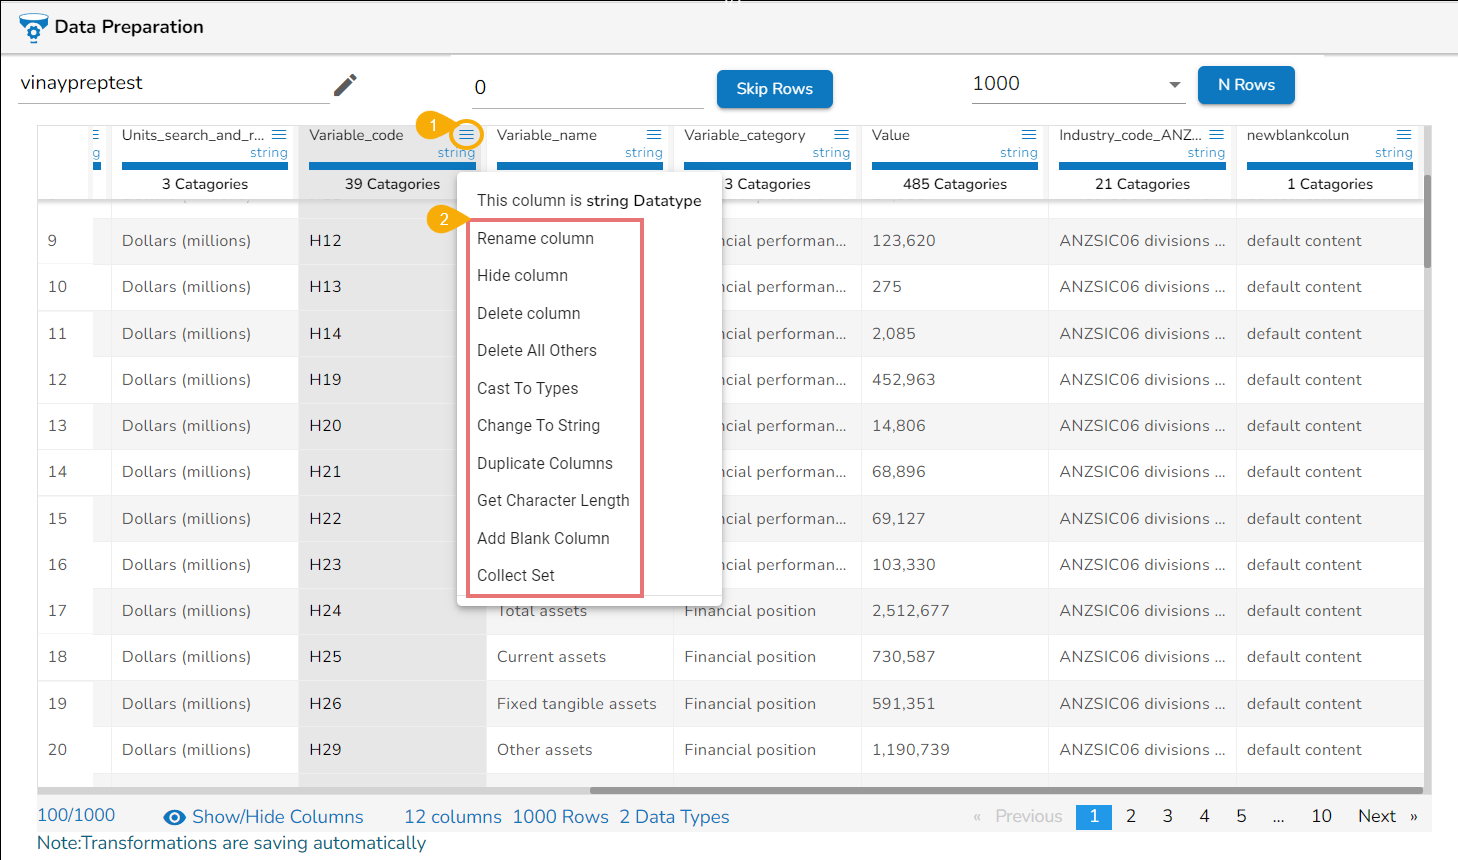
Each Column Header has a Context Menu icon. By clicking the Context Menu icon, a Context menu gets displayed with some options to be applied on that column.
The following options get displayed while clicking on the Context Menu icon:
Rename column
Hide Column
Delete Column
Delete All Others
Cast to Types
Change to String
Duplicate Columns
Get Character Length
Add Blank Column
Collect Set
It also presents the data type of the column. It is analyzed based on the max match to any data type in the first 10K records. Consider that out of 10000 rows sample, there are 9000 integers and 1000 string values, the selected data type is Integer. The 1000 string rows get detected as invalid rows.
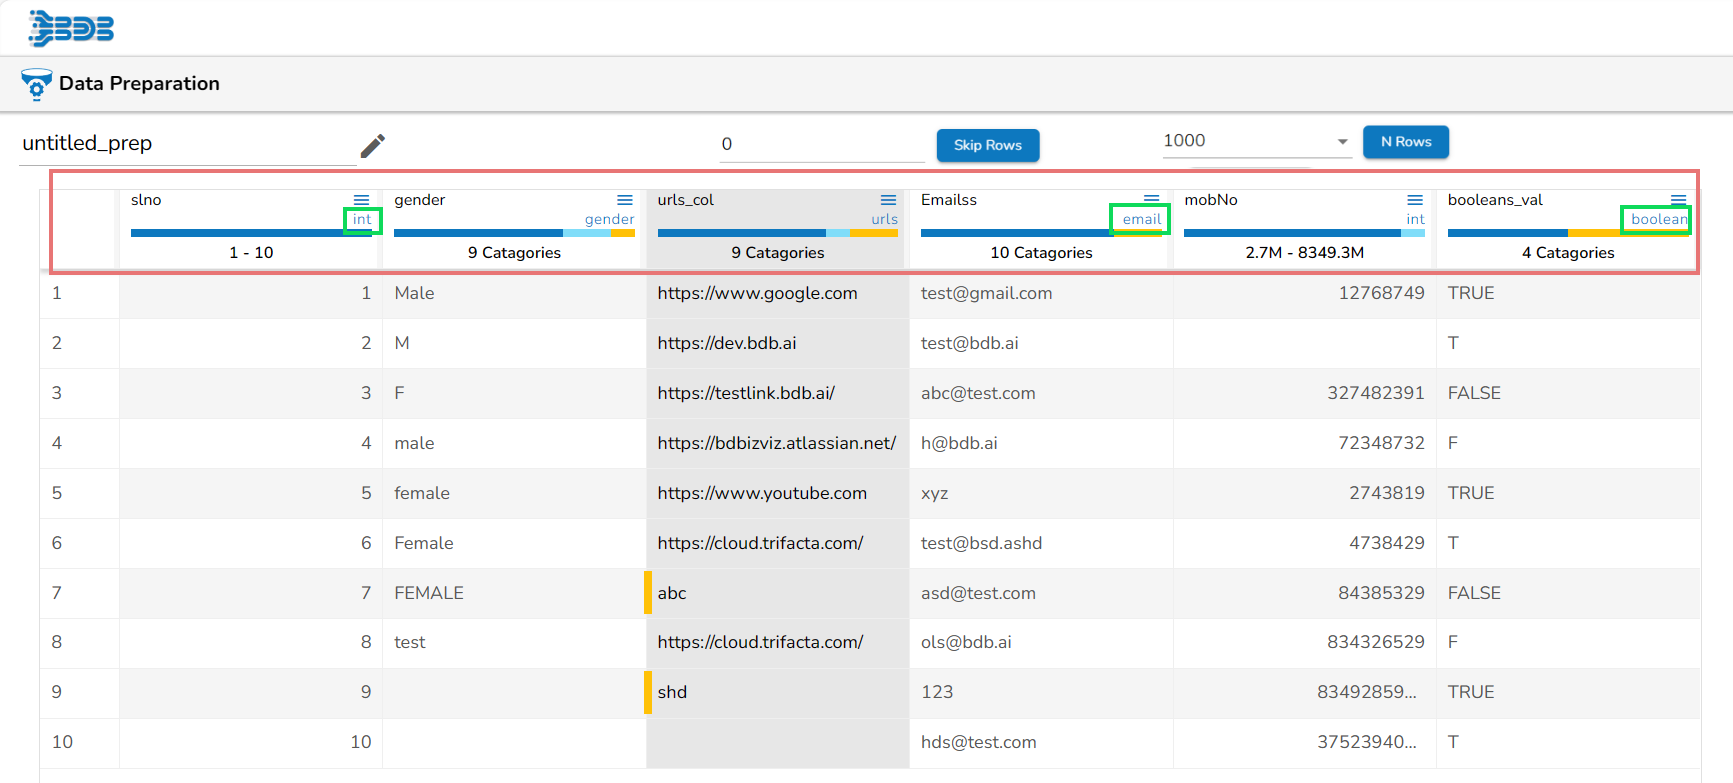
The column header in the Data Grid displays the following information based on the column types:
Columns with Integer values- The Min and Max values
Columns with String values- Total unique count or no. of categories
Columns with Date values- Range of dates including the min-max date
Please Note: Repetitive Column Names Handling under the Data Preparation module is based on the file types (as explained below).
When opening an Excel file that contains repetitive names of the columns in the Data Preparation framework, the column names will be mentioned with _0, _1 suffix by default.
For Example, if multiple columns with the name ID are present in an Excel file, the Data Preparation will read these columns as ID_0, ID_1, ID_2, and so on.
A CSV file handles such scenarios of repetitive column names by displaying no suffix for the first column and then progressively inserting .1, .2, and .3 suffixes for all the repetitive columns.
For Example, if multiple columns with the name ID are present in a CSV file, the Data Preparation will read these columns as ID, ID.1, ID.2, and so on.
N Rows
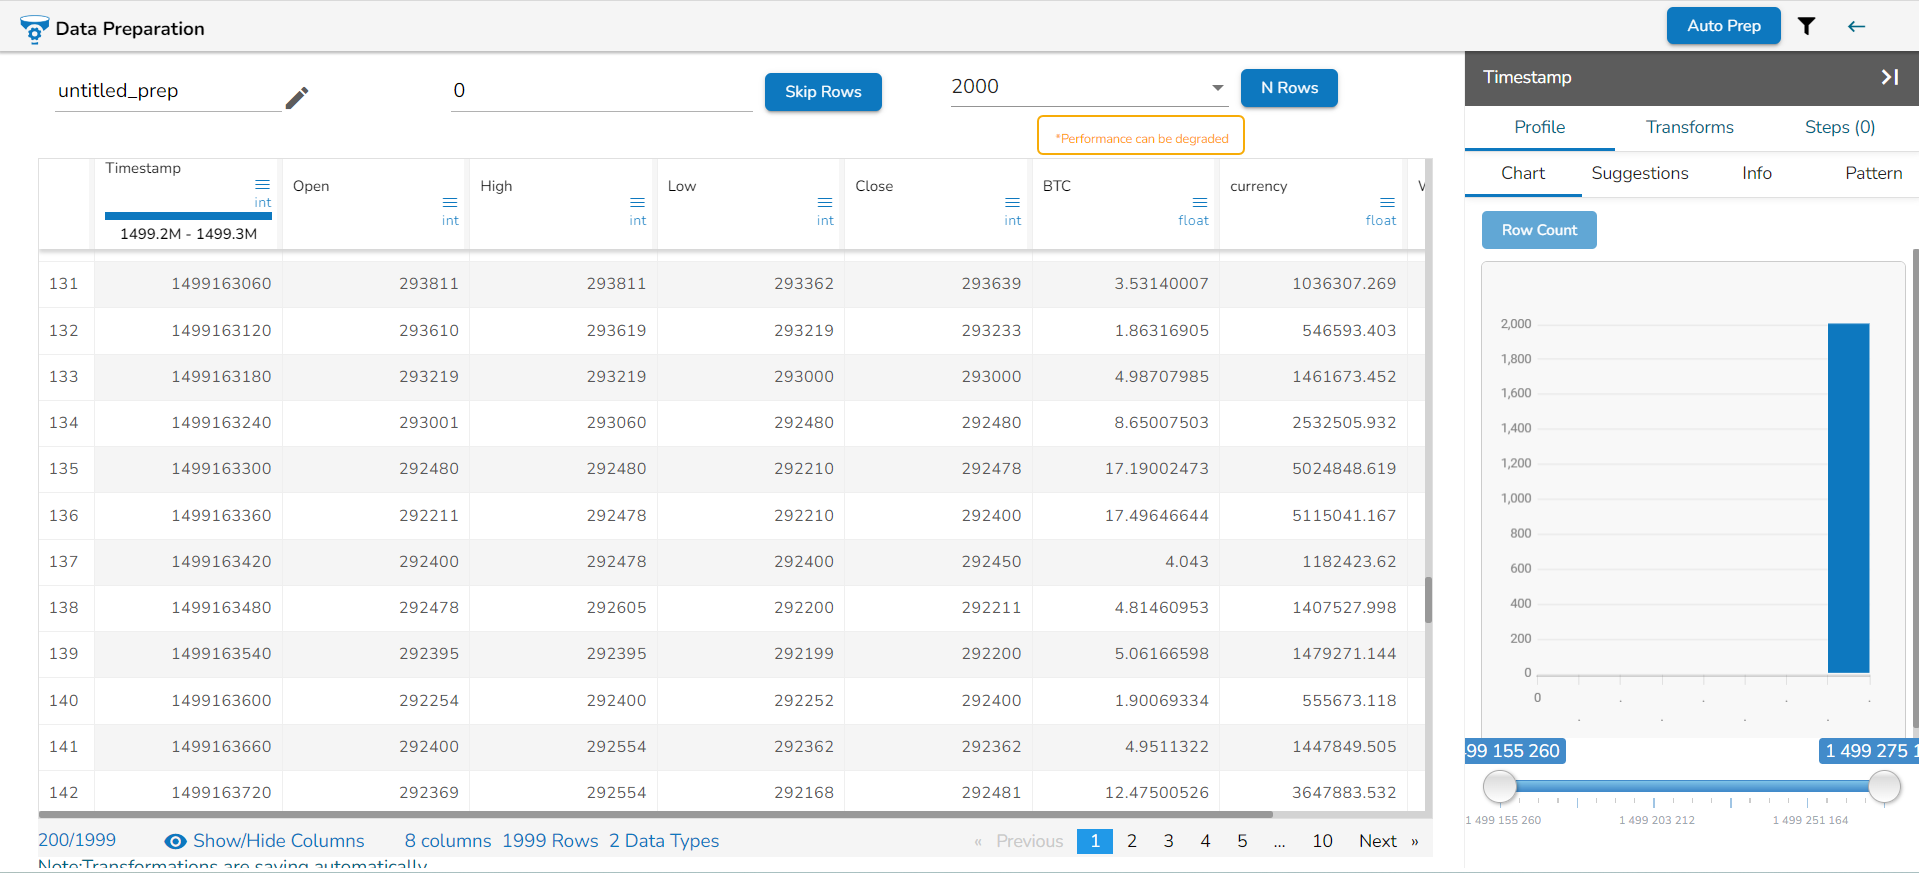
By default, the grid always displays the first 1K rows of the dataset. The user can use the N Rows option to change or modify the limit of the Data set display in the Data Grid. The N Rows option is provided on the top of the Data Grid view, the user can change the view to 2K, 3K, 4K up to 5K using this option.
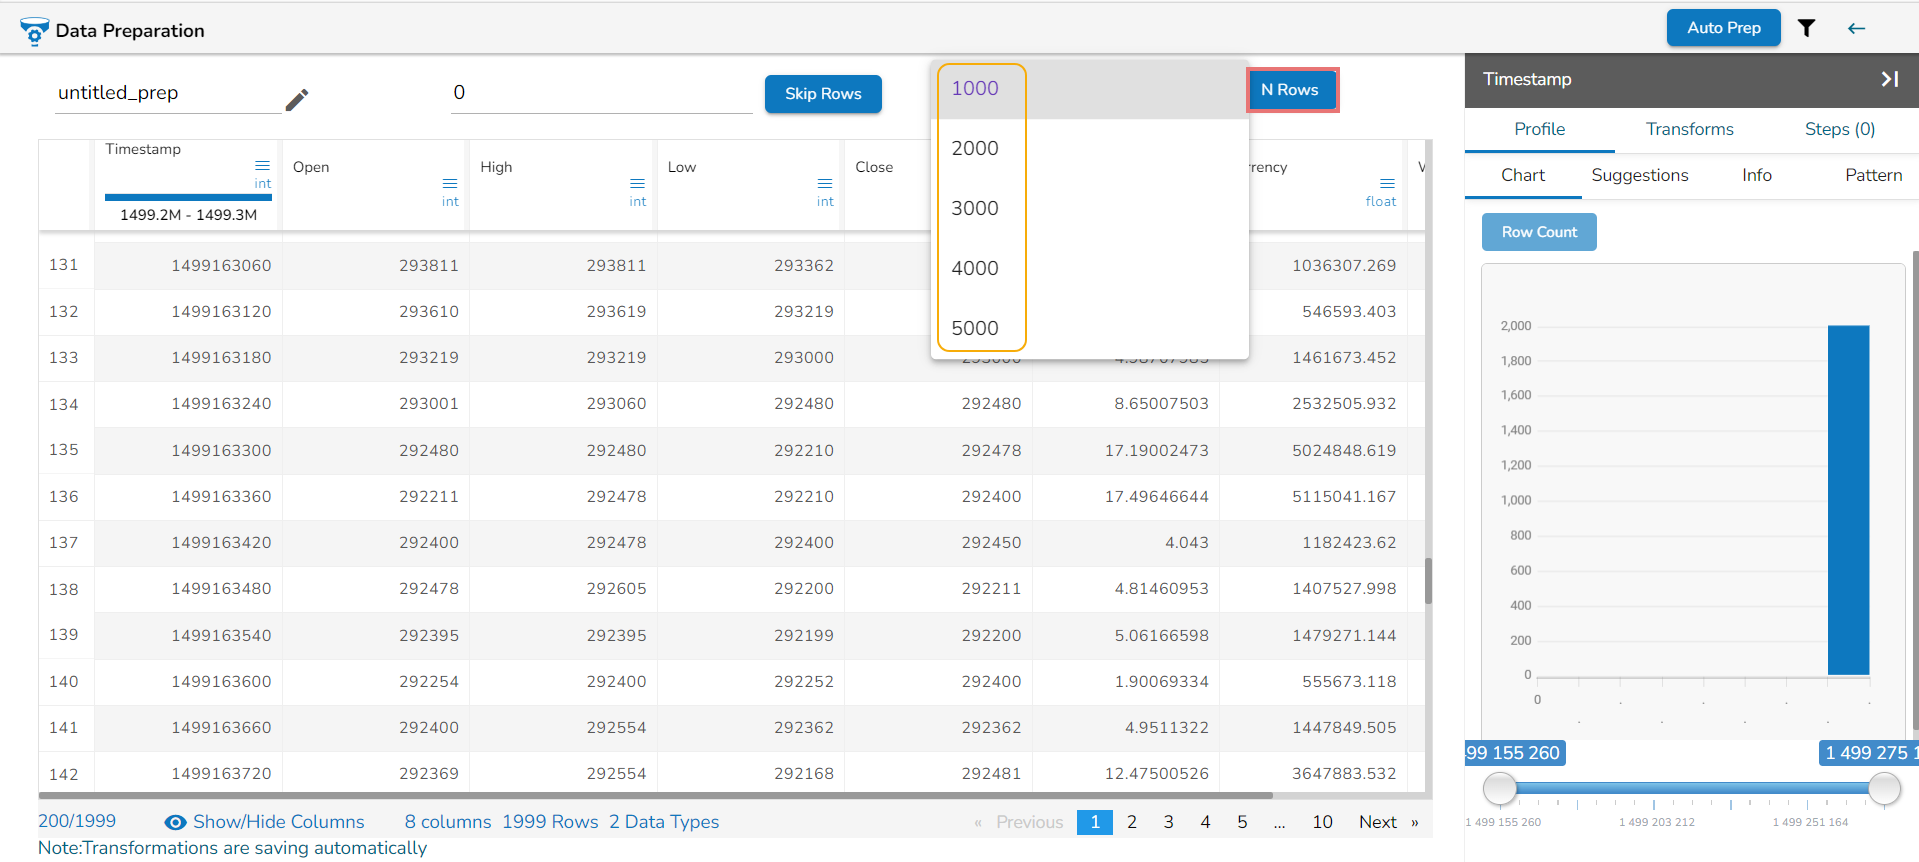
The increase in data load may degrade the performance of the data preparation. A warning message appears below the N Rows option for the users to stay informed.
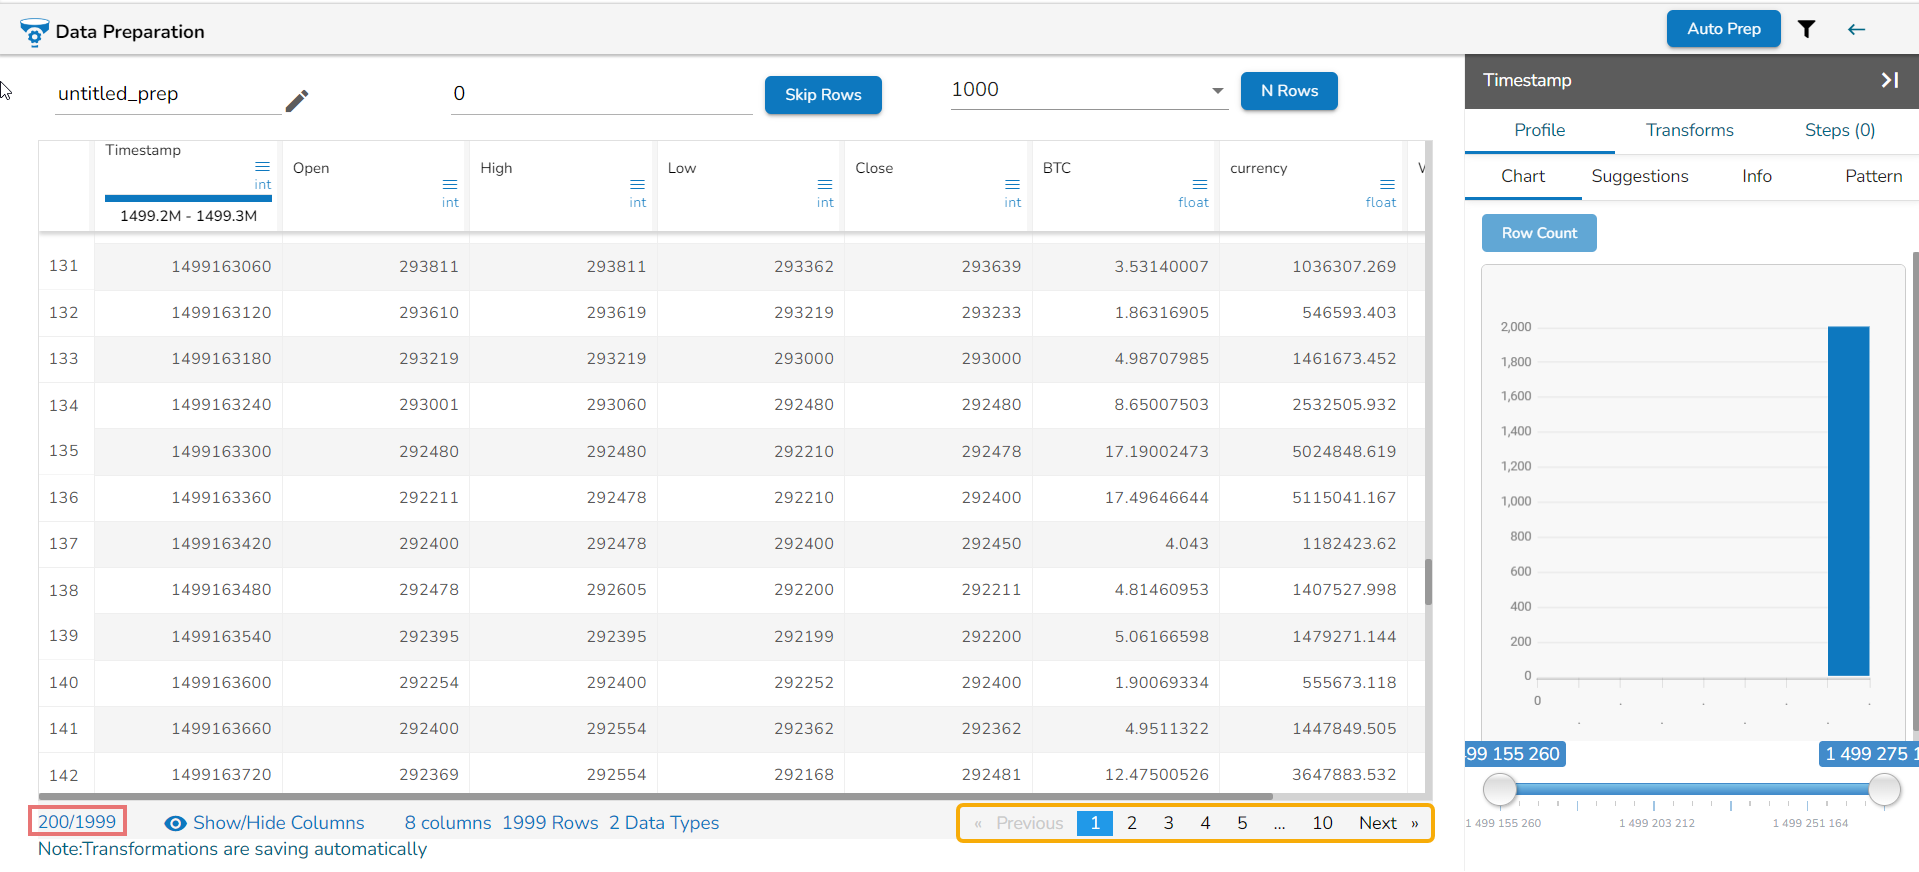
Pagination
Pagination is implemented to the grid display of data. The tool displays 100 records on each page by default, by changing the N Rows count the no. of rows displayed on each page may get changed as well.
Data Types
The Data Grid header displays Data Types. Some of the supported Data Types are as given below:
Integer
Double
String
Date
Timestamp
Long
Email
Boolean
Gender
URL
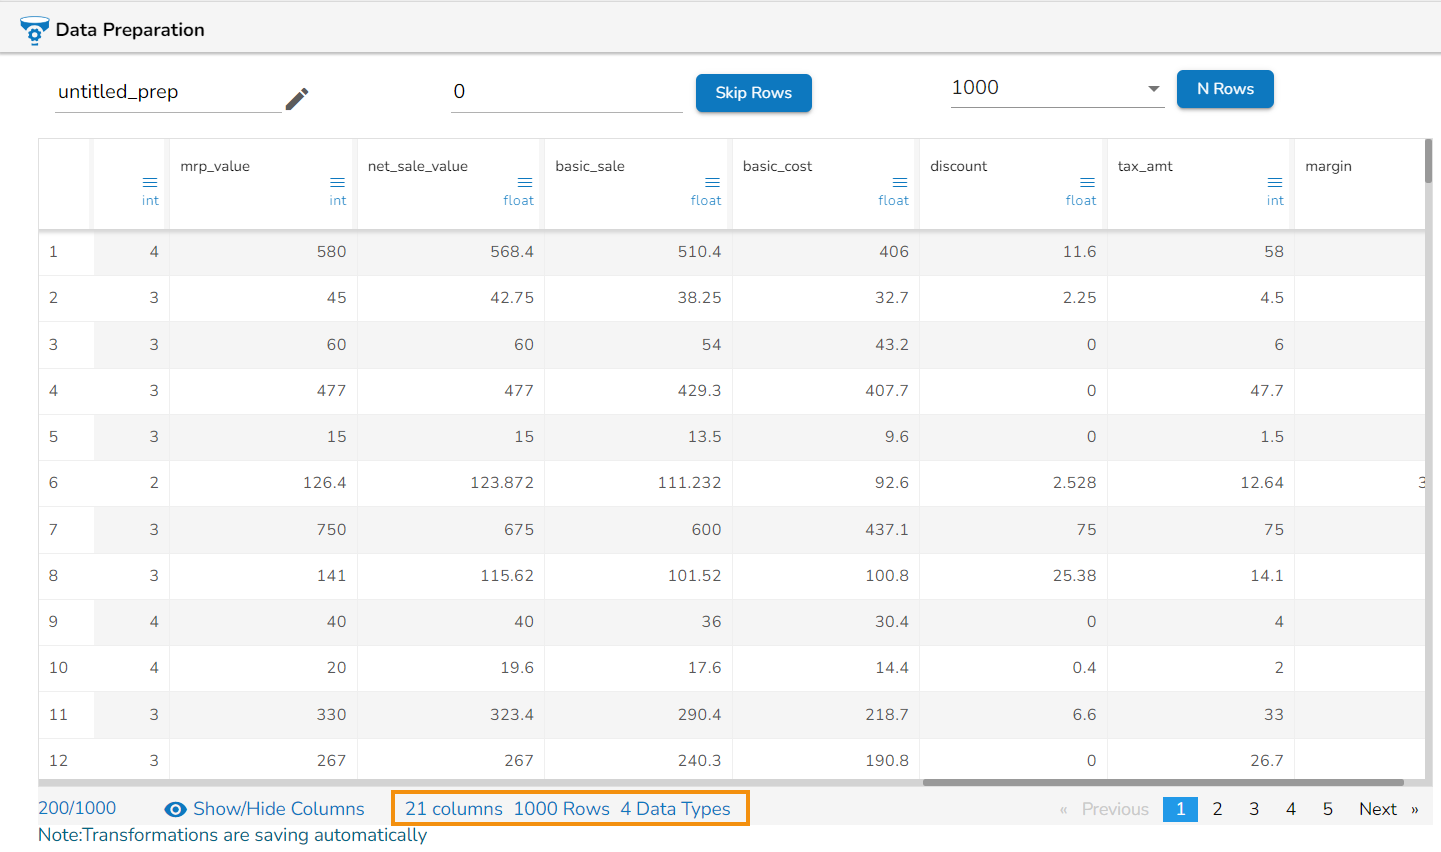
Key Metrics
At the bottom of the Data Preparation page, we now display key metrics to provide valuable insights into the dataset being analyzed. These metrics offer essential contextual information, enabling users to make informed decisions, perform data profiling, and gain a deeper understanding of the dataset being prepared. This includes:
Column Count: The total number of columns in the dataset, allowing users to quickly assess the complexity and scope of the data.
Row Count: The total number of rows in the dataset, providing an overview of the dataset's size and volume.
Data Type Count: The number of distinct data types present in the dataset, enabling users to understand the variety and diversity of data formats and structures.
Please Note:
The Data Preparation workspace supports more than the listed Data Types.
The user can edit the name for the Data Preparation using the Title bar.
Skip Rows
The Skip Rows functionality will help the user to select the records from the specified index. The user can limit the Data Preparation up to the selected no. of rows by using the Skip Rows option. The skipped rows will be excluded from the original dataset while applying the Data Preparation. The default value for Skip Rows functionality is 0.
Please Note: This functionality is only available for the files which are loaded from the Sandbox.
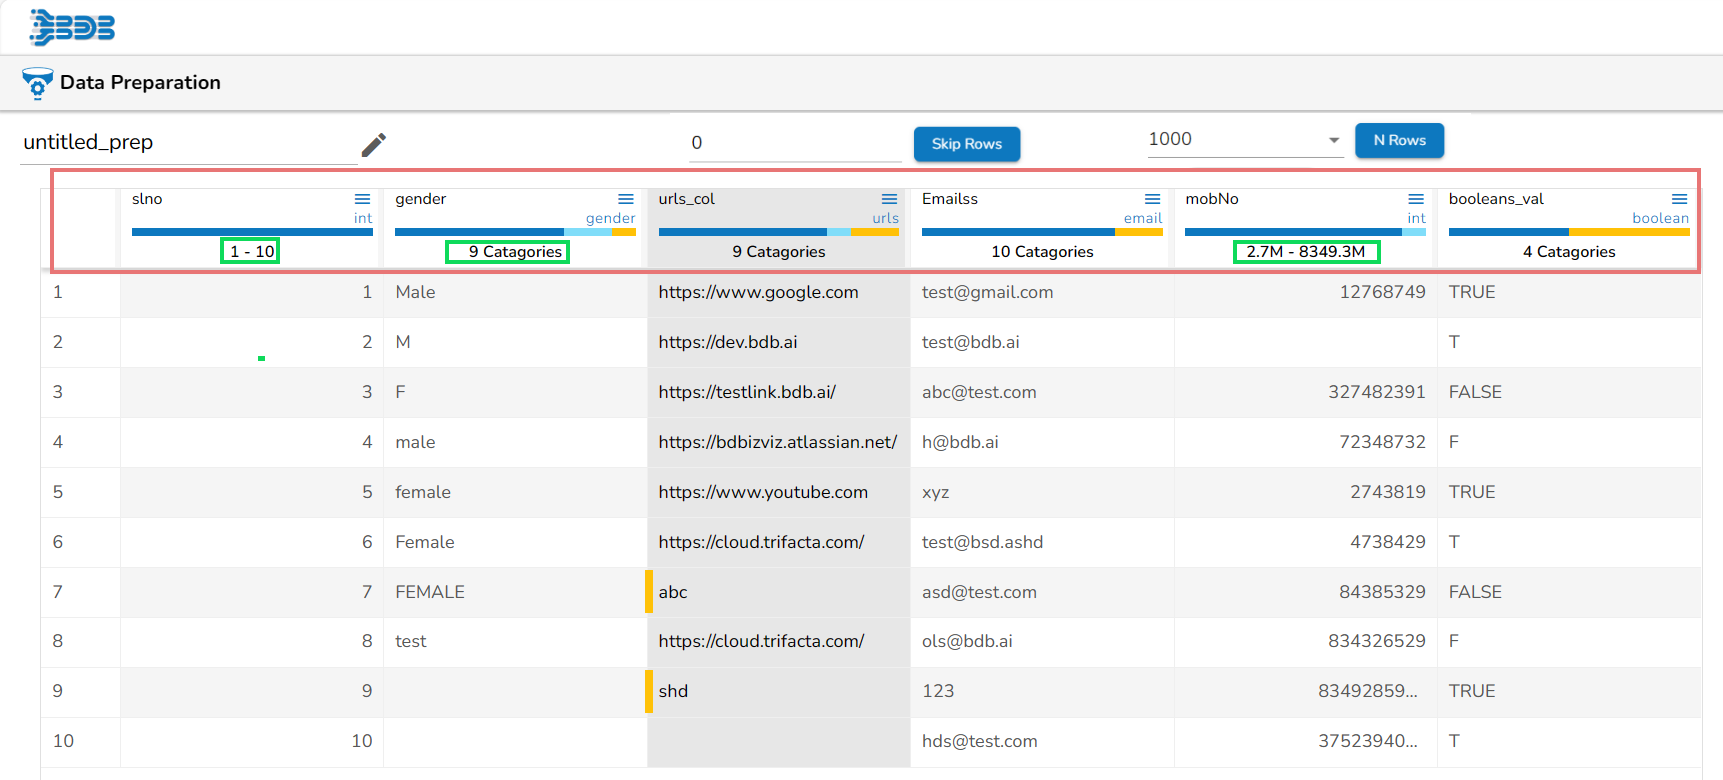
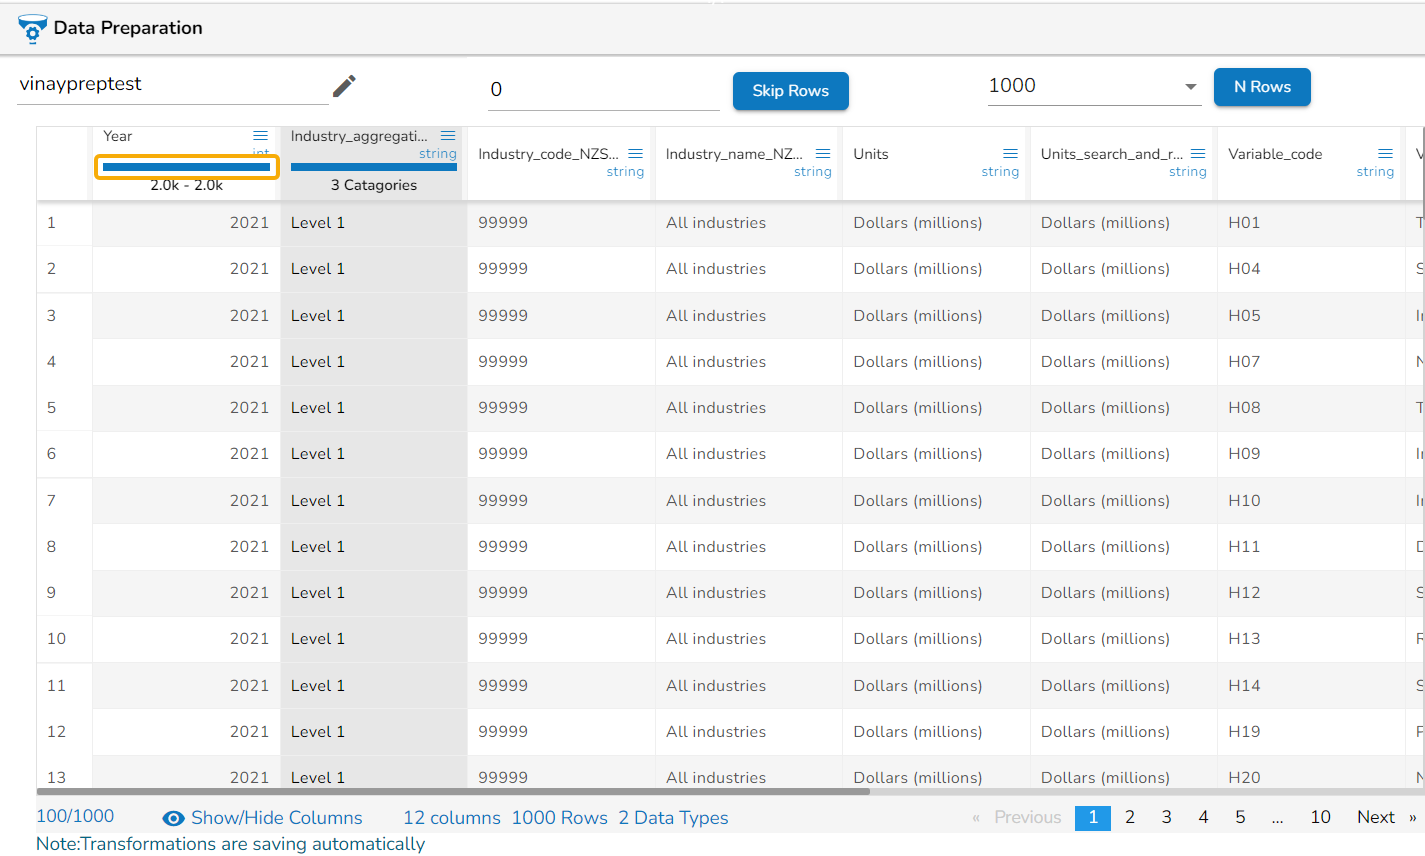
Data Quality Bar
A Data Quality Bar appears in the header of the data grid. The Data Quality is indicated through color-coding by clicking on a particular column.
The Data Quality Bar displays three types of data using 3 different colors.
Dark Blue-Valid Data
Orange-Invalid Data
Light Blue- Blank Data

Please Note: These color-coded bars appear by clicking on a particular column.
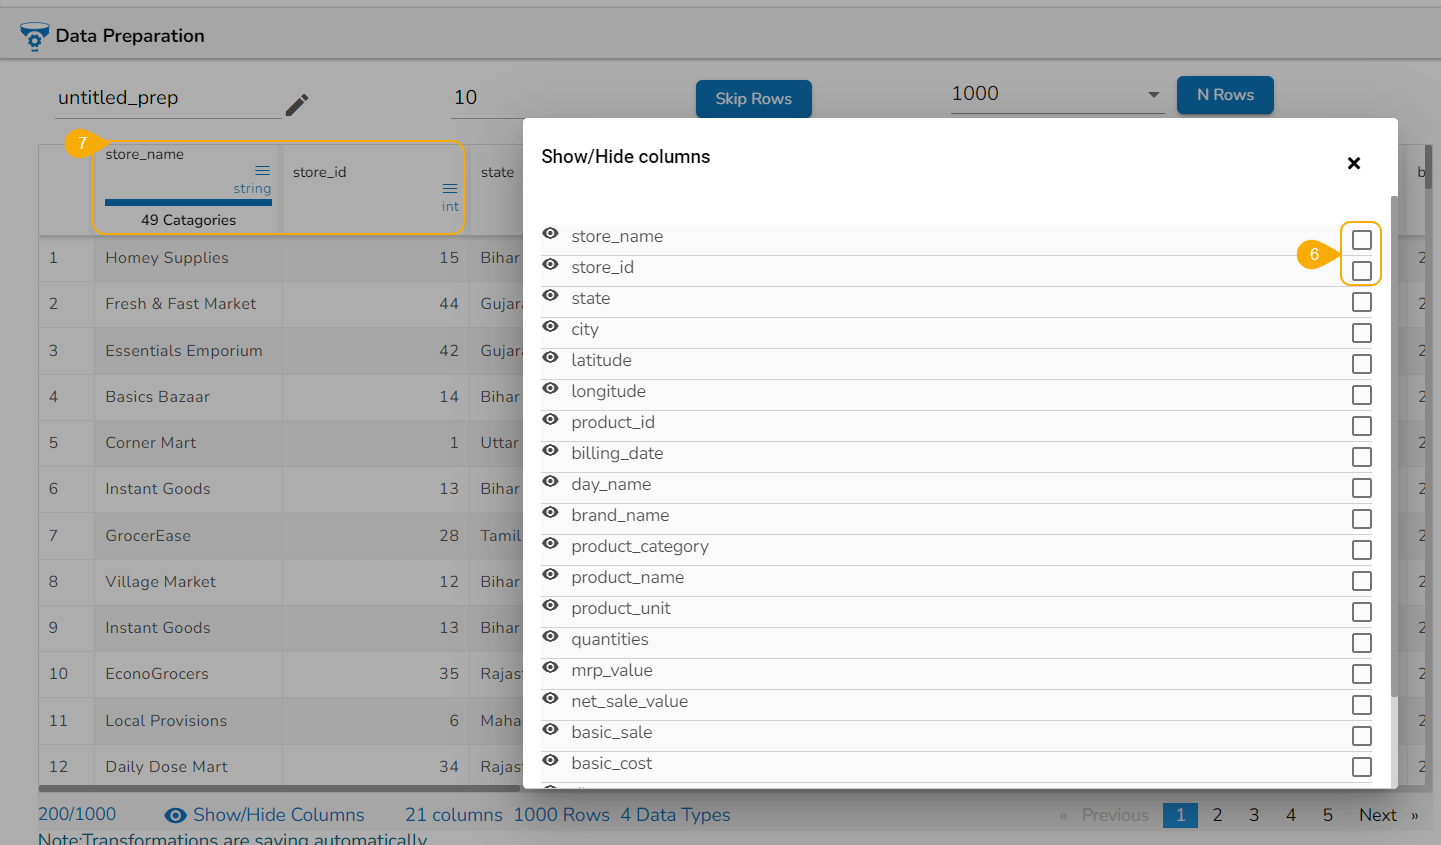
Show/Hide Columns
This option allows the user to instantly hide or show the rows based on their need to derive meaningful insights from the displayed data.
Check out how to use Show/Hide option.
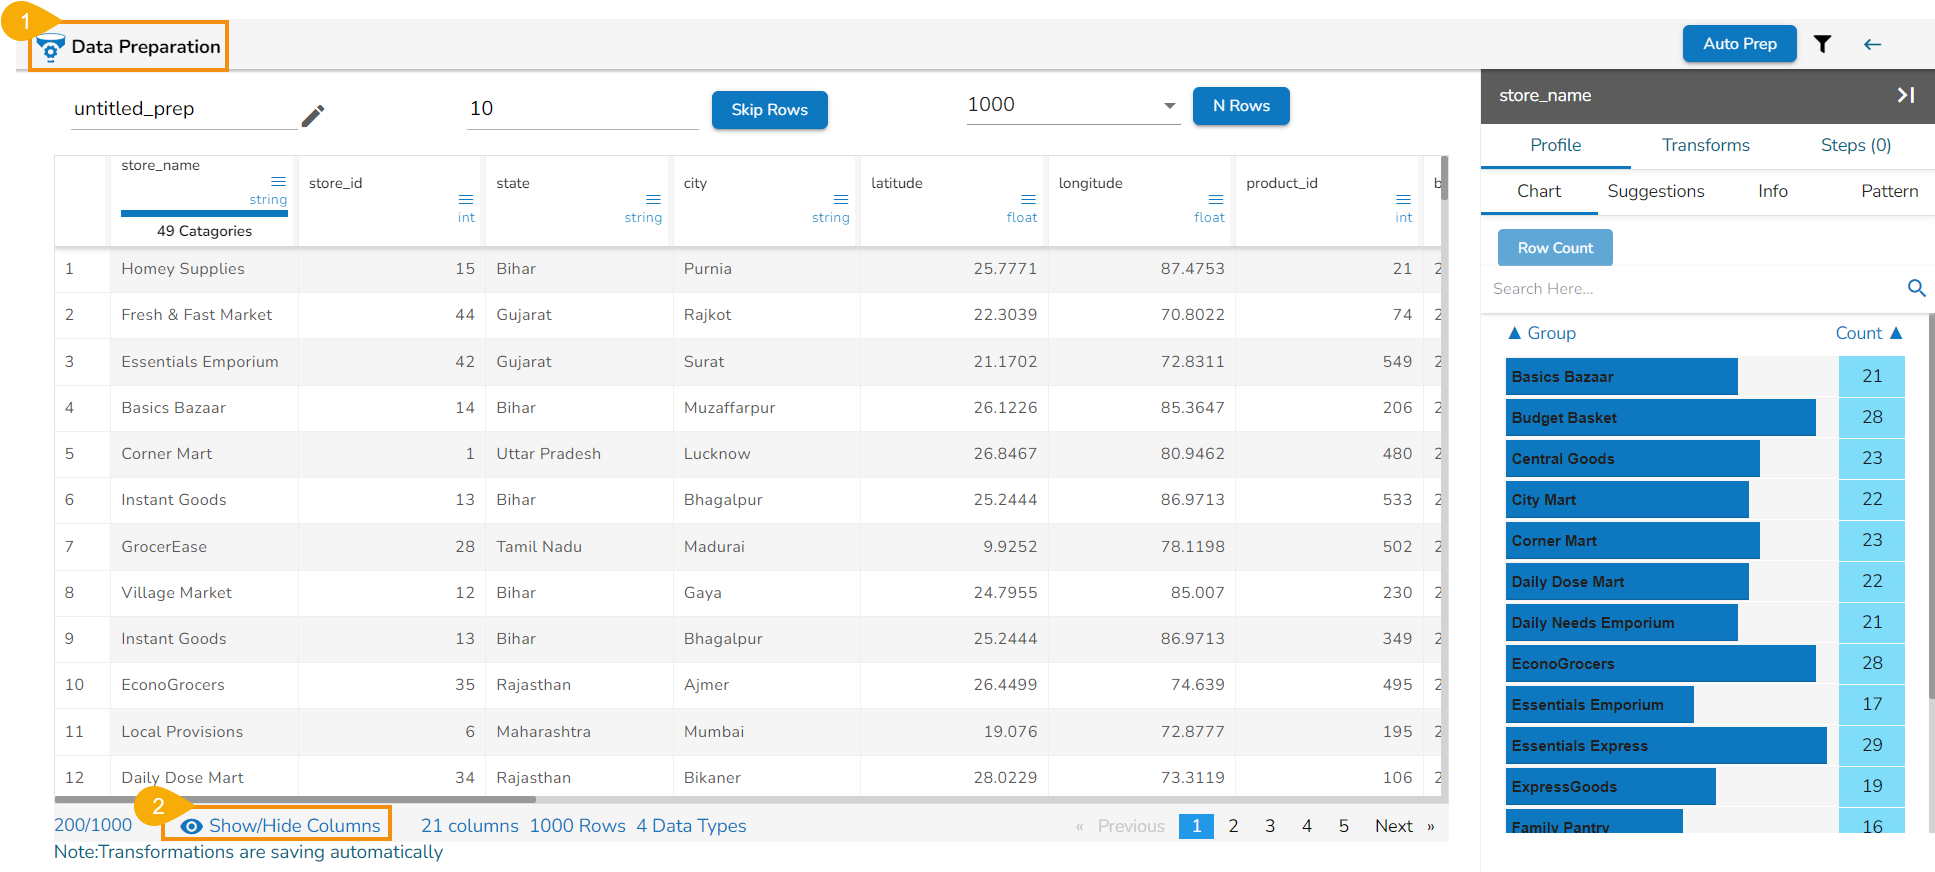
Navigate to the Grid view of any selected Data Preparation.
Click the Show/Hide Columns option given at the bottom of the displayed grid view of the data.
The Show/Hide Columns drawer appears displaying the available columns from the selected Data Preparation.
Select the columns using the given check boxes provided for those columns.
The selected columns will instantly go away from the Data Grid display.
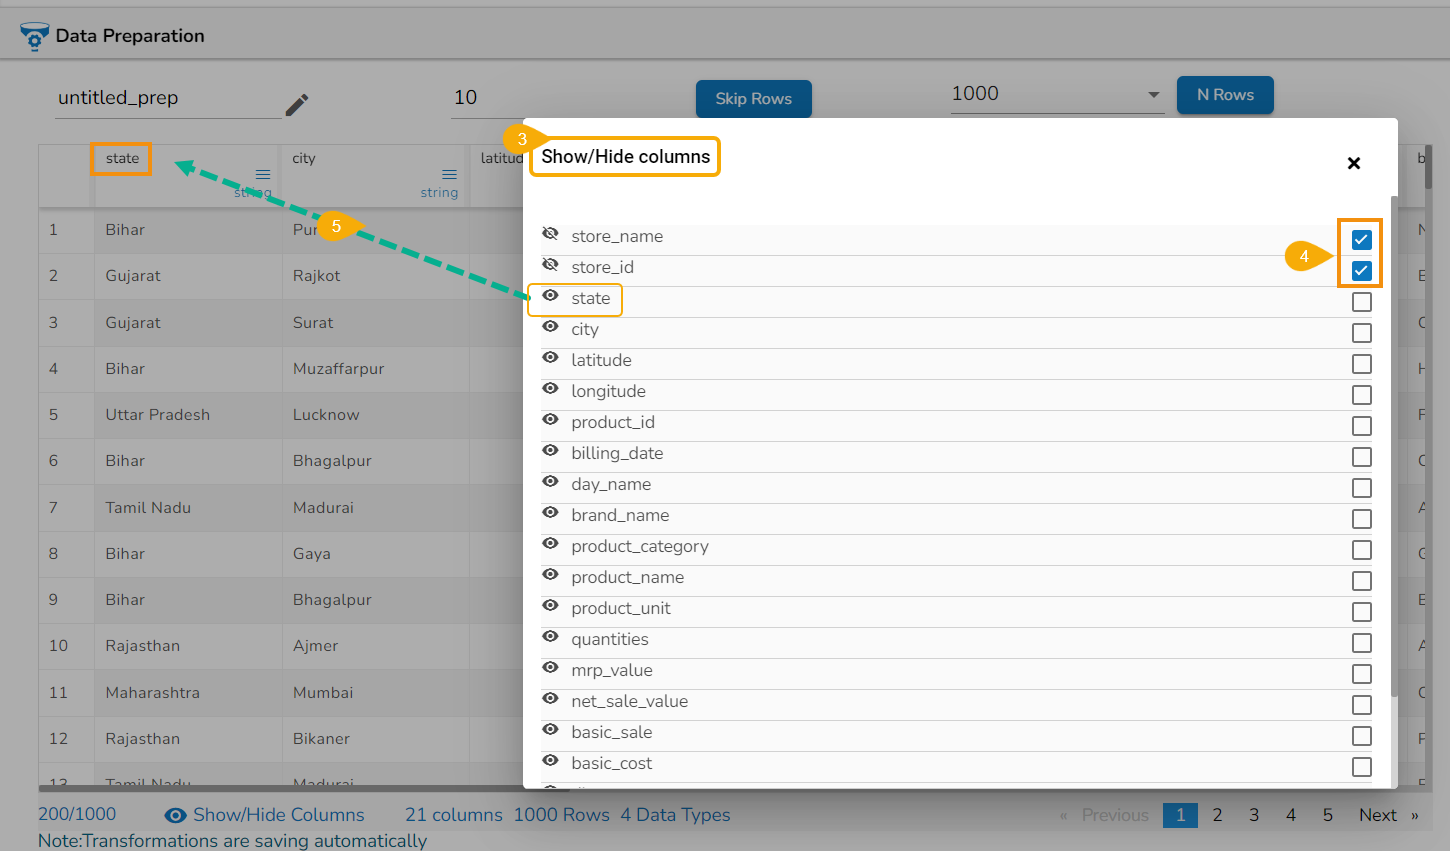
Un-check the check boxes for the same column(s).
The column(s) starts reflecting in the Grid view.
Please Note: The Hide Columns option can be accessed from the menu icon provided for the each column in the Data Grid display of the dataset.
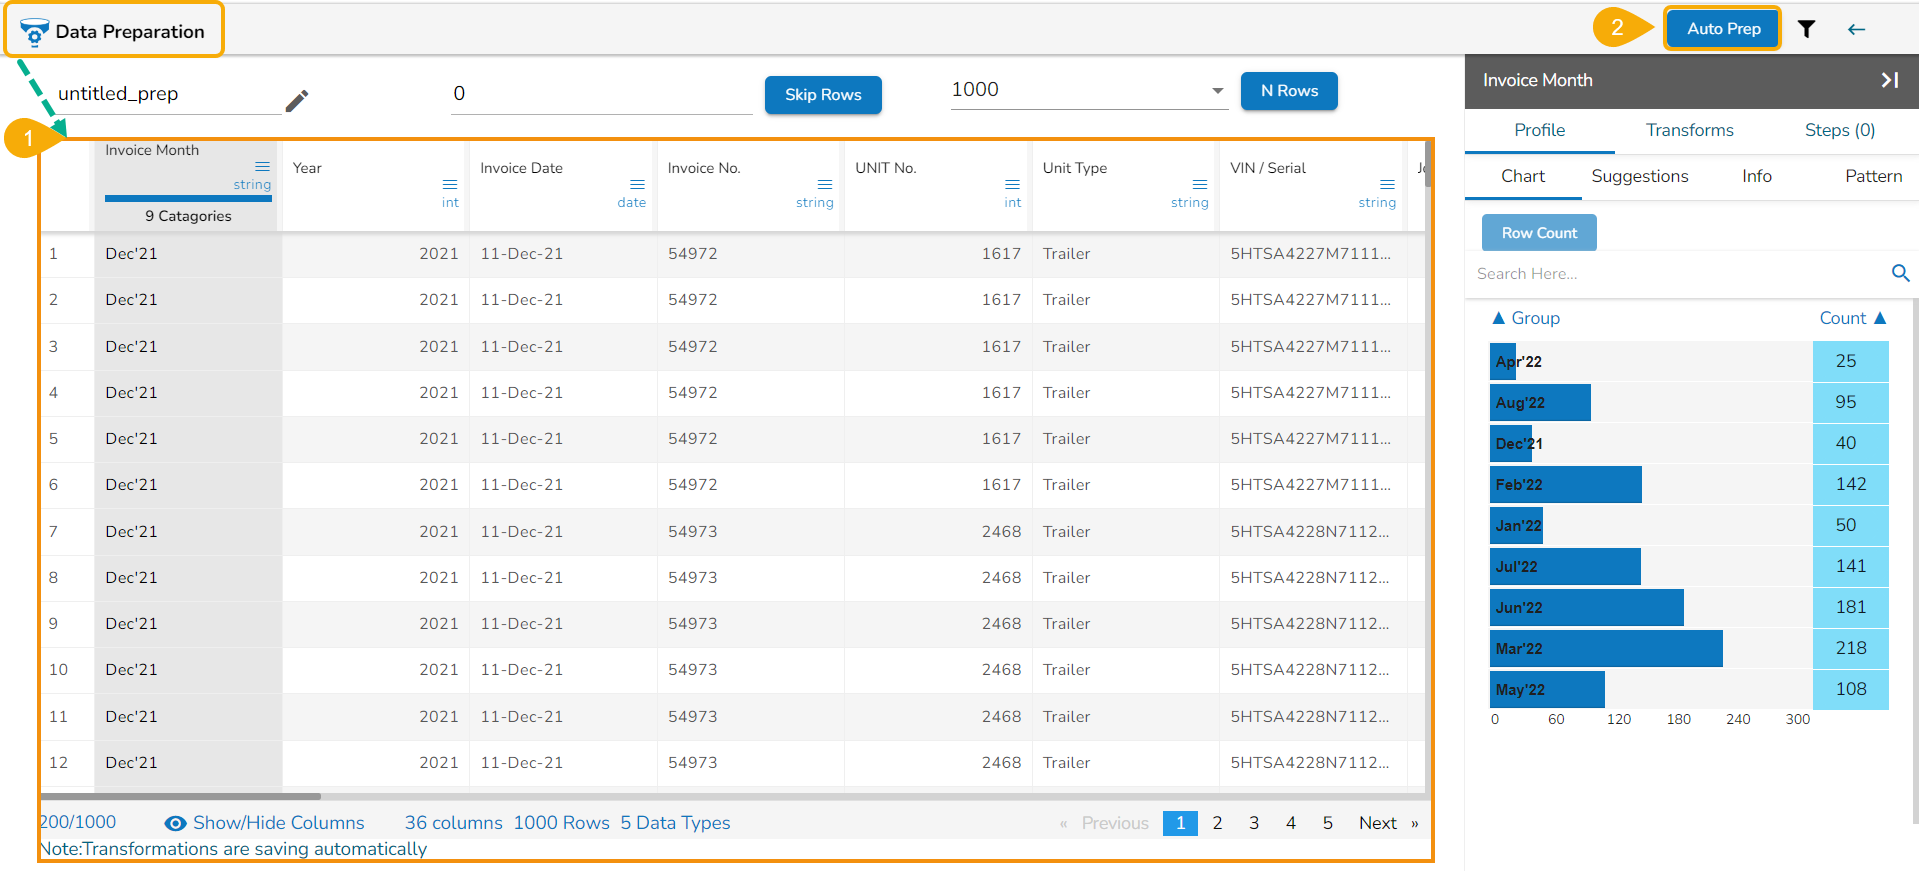
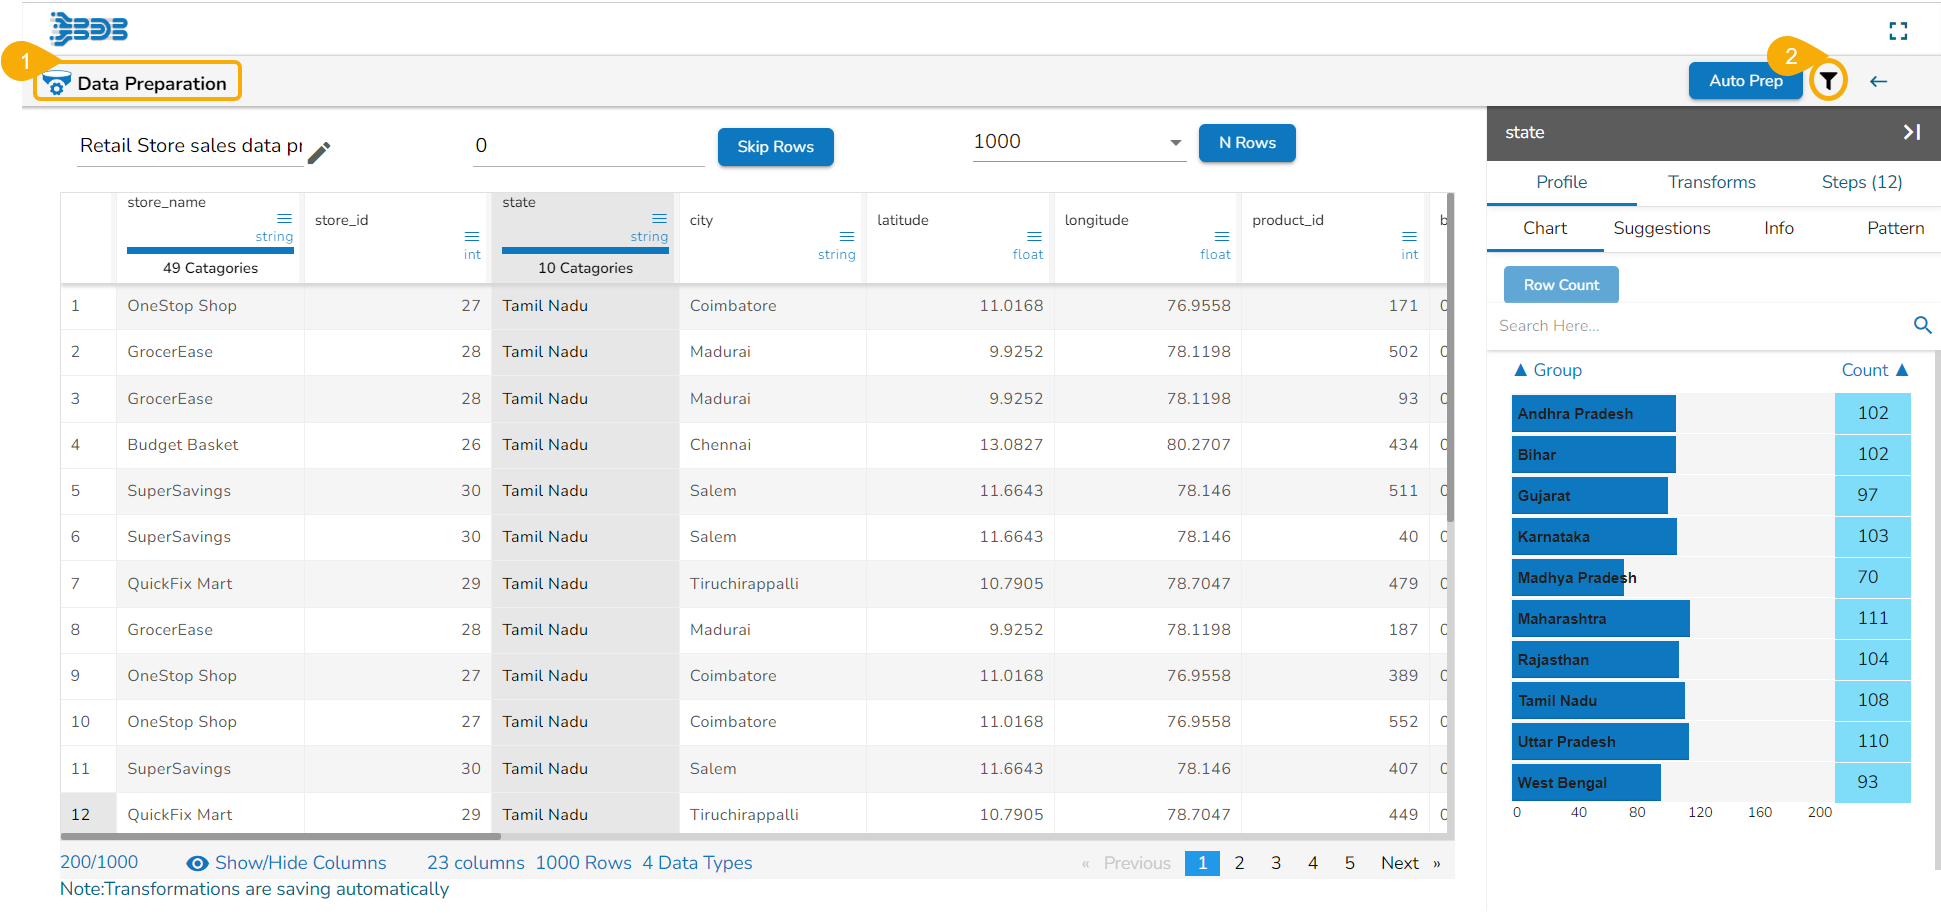
Auto Prep
The Auto Prep feature in the Data Preparation module intelligently suggests the most suitable data transformation steps based on your dataset's unique characteristics. The users have the freedom to accept, customize, or skip these recommendations to align with their analysis goals. All selected steps are neatly mentioned under the Steps tab, streamlining the data cleansing process and saving you valuable time. This feature ensures efficient data preparation tailored to your needs within seconds.
Please Note: Auto Prep will affect all over the dataset, it will quickly clean complete data.
A set of transforms is included in this process. The explanation of how each transform works is as below:
Please Note:
The most important/ significant transform as a part of Auto Prep is Remove Special Character from Metadata which will be useful in a large number of columns present in the dataset with no proper naming convention.
While applying Auto Prep other than the set of transforms that come with Auto Prep, it removes trailing leading whitespaces from the data set if present.
Check out the given video on the Auto Prep functionality.
Steps to use the Auto Prep feature:
Navigate to a dataset displayed in the Data Preparation framework.
Click the Auto Prep option from the top right menu panel.
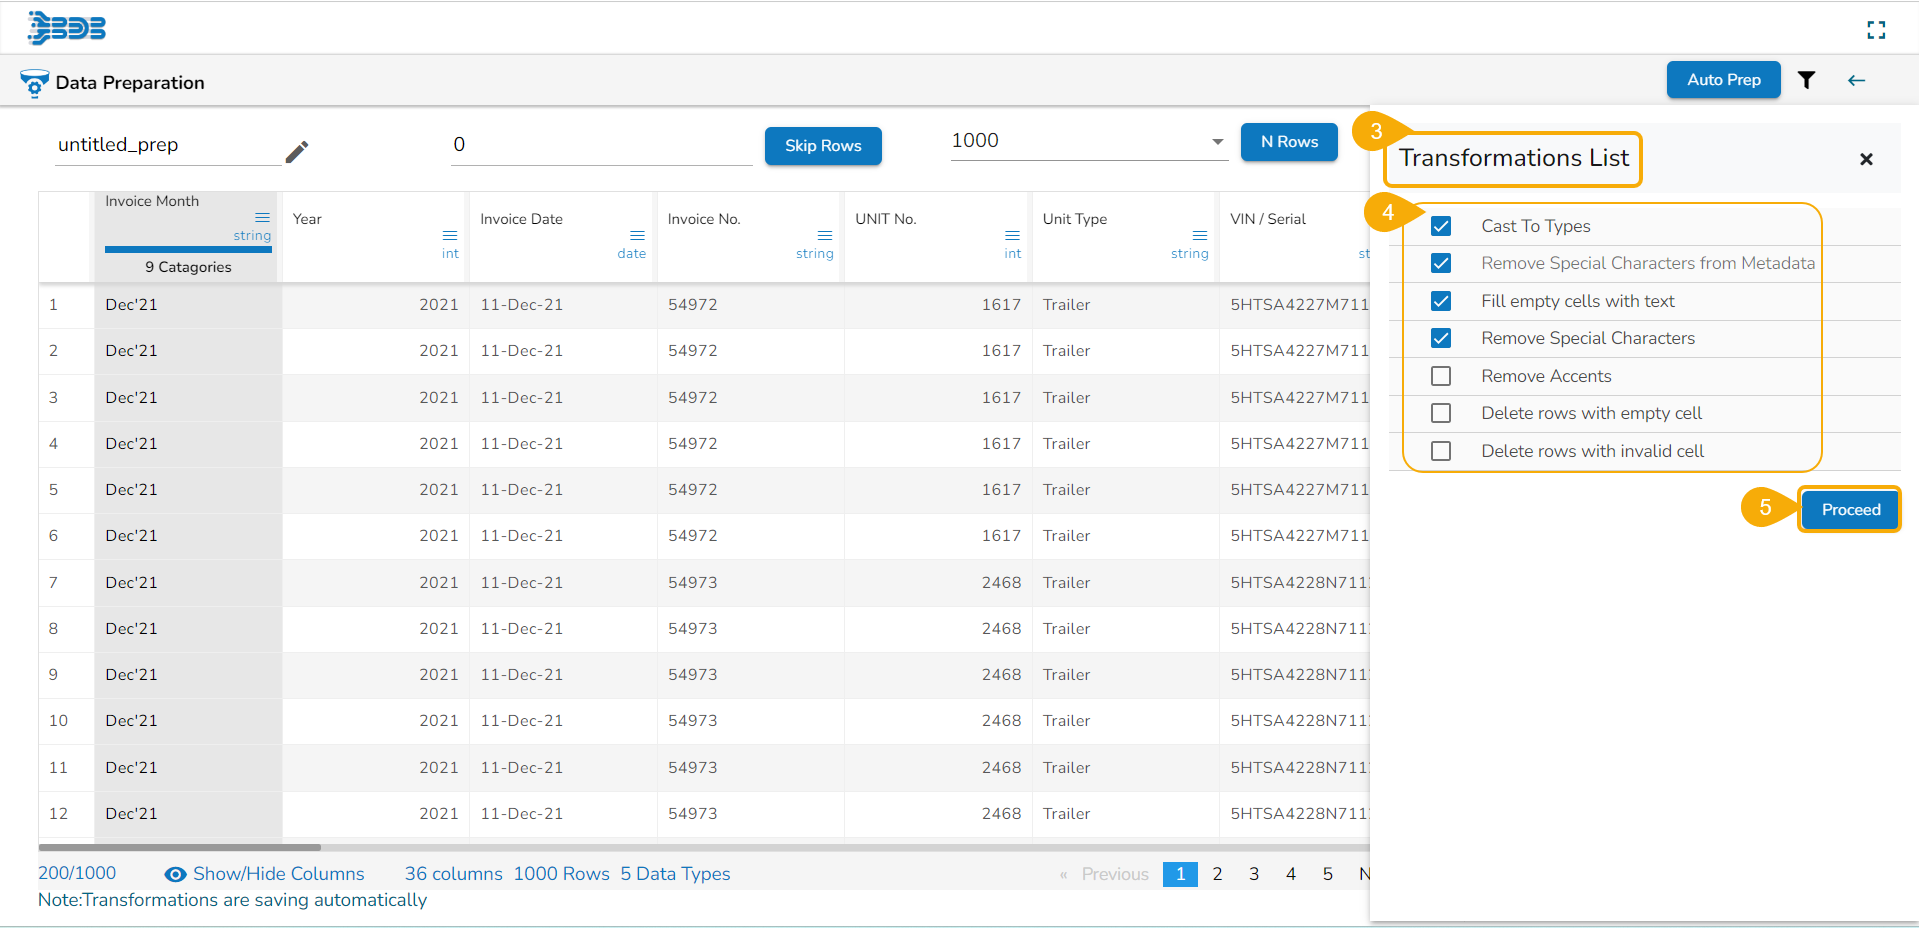
The Transformations List window opens with the list of the suggested Data Preparations.
The user can modify the suggested list by using checkmarks in the given checkboxes.
Click the Proceed option after selecting all the required data preparation options from the list.
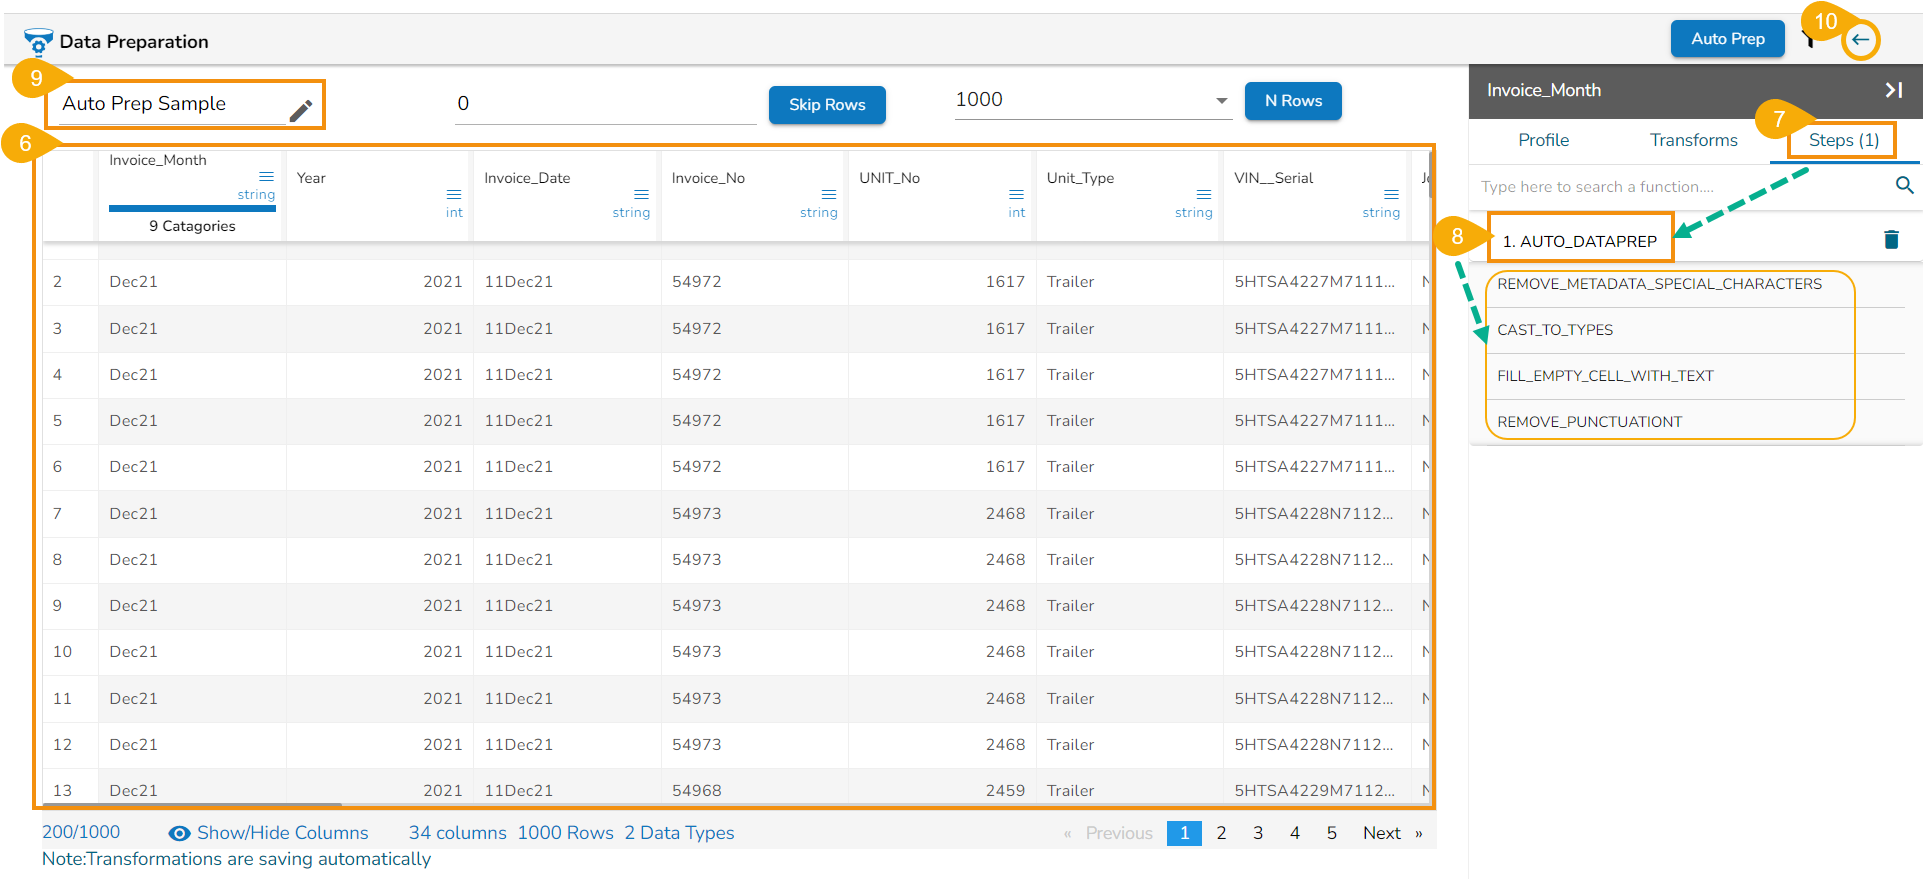
All the selected data preparation are applied to the dataset.
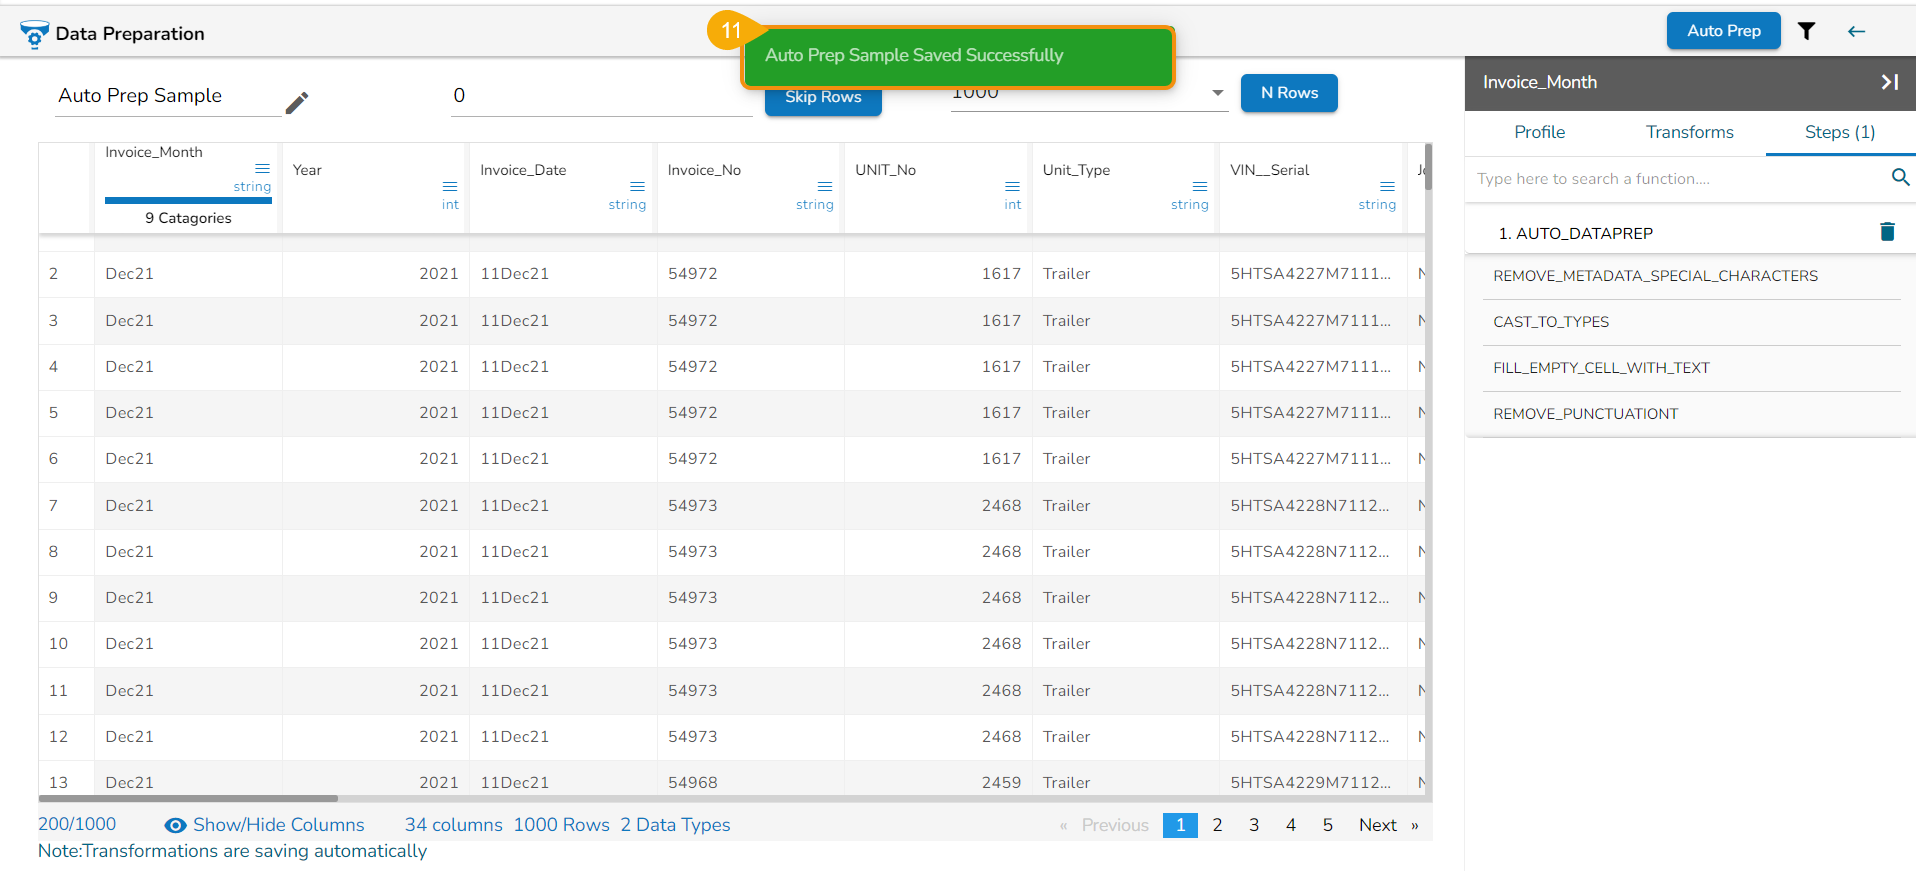
The Auto Prep entry gets registered under the Steps tab.
By clicking on the AUTO DATAPREP step from the Steps tab, the applied Transforms are listed below.
Provide a name to your Data Preparation.
Click the Back icon.
A notification message appears to assure the users that the recently performed Data Preparation activity has been saved.
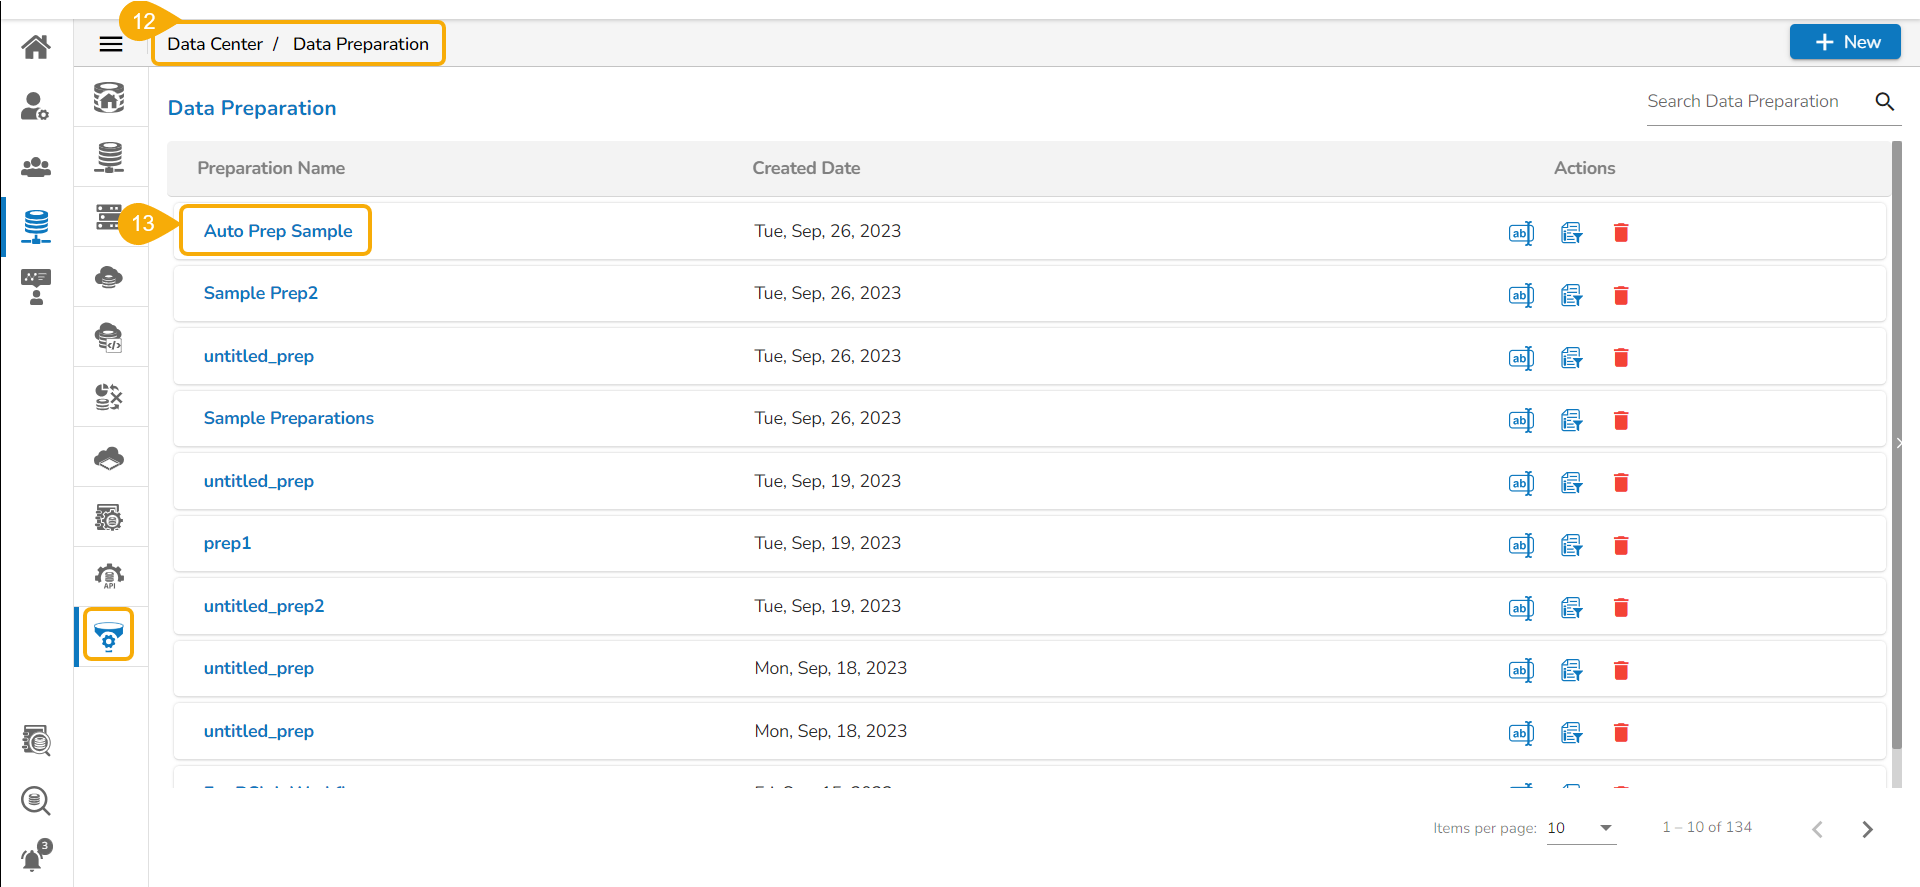
Navigate to the Data Preparation List page.
The recently saved Data Preparation gets added at the top of the list.
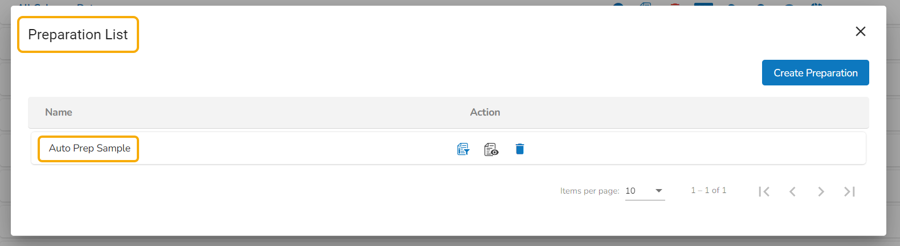
Please Note: The saved Data Preparation using Auto Prep also appears under the Preparation List while opening the data sandbox file from the Data Sandbox List page.
Filter
The filter functionality is provided for the user to customise the display by selecting a specific column or row or by selecting a data type from the listed data type options.
Check out the given illustration to understand the Filter functionality for Columns and Rows.
Navigate to the landing page of the selected Data Preparation.
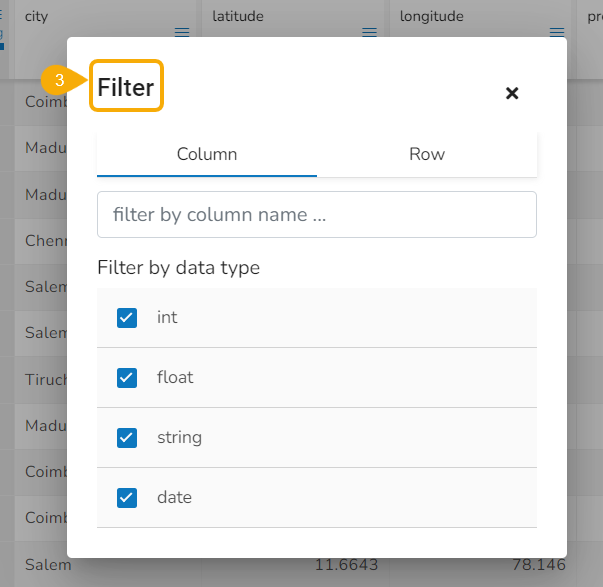
Click the Filter icon provided on the top right side of the screen.
The Filter dialog window opens displaying the default view of the Filter checkboxes.
Filtering the Data Display
The user can filter the data display based on the following aspects:
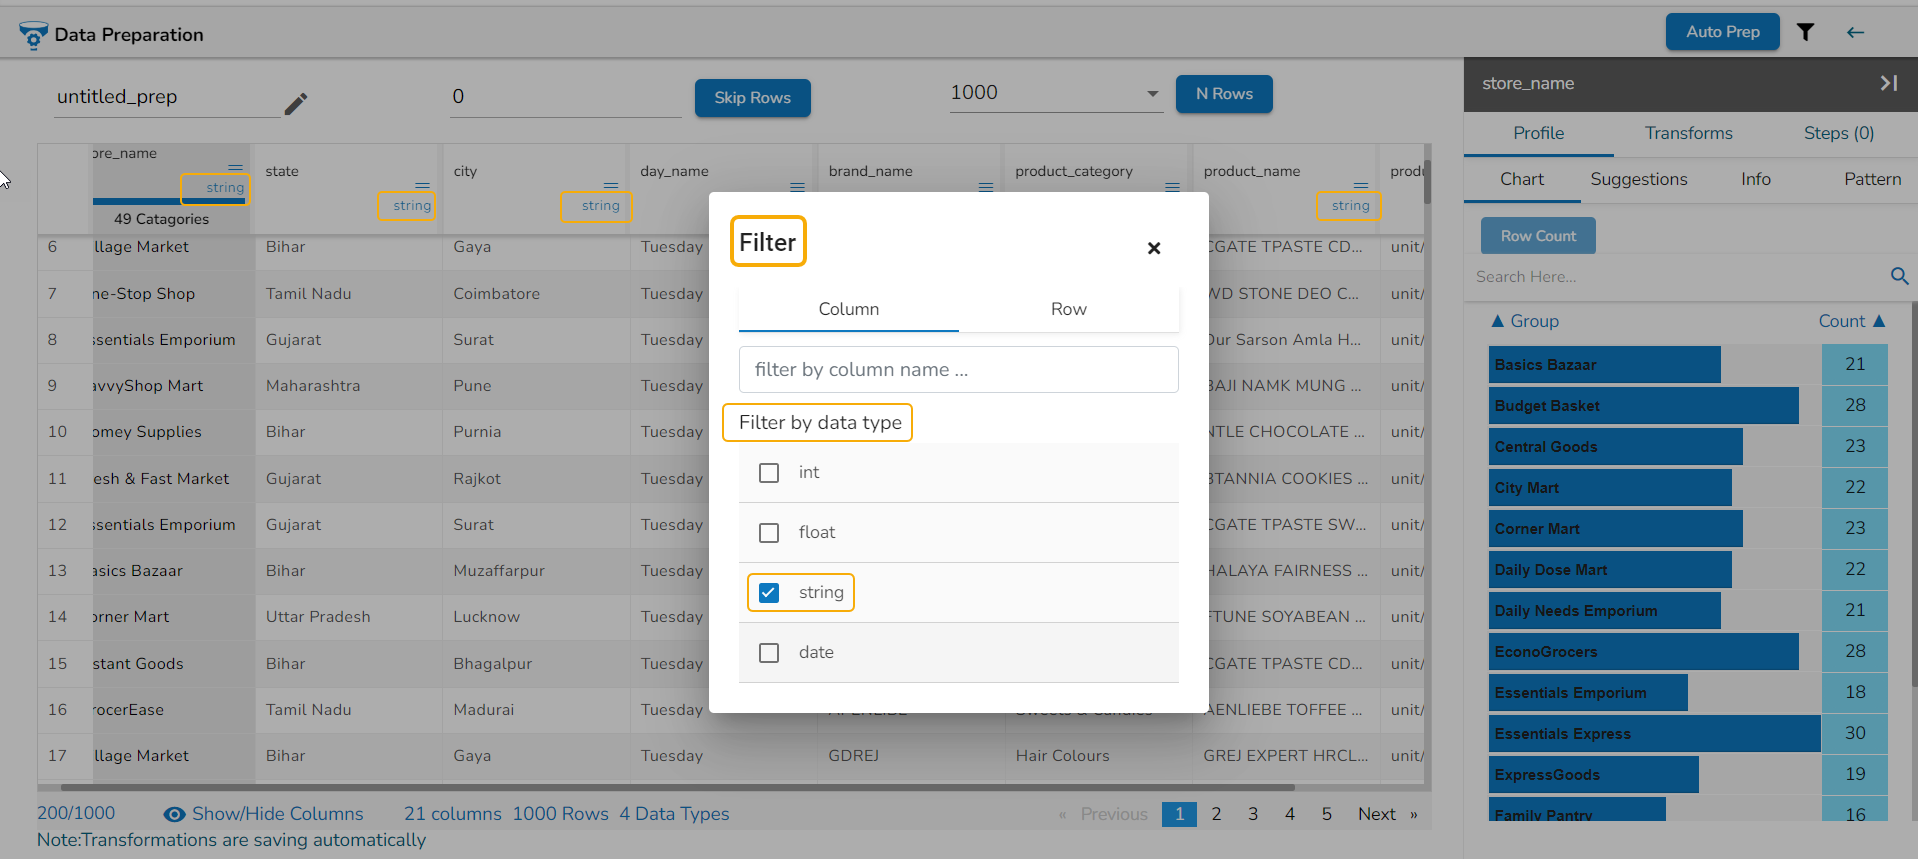
Data Types: Select the data types from the available list based on which you wish the data display to get filtered.
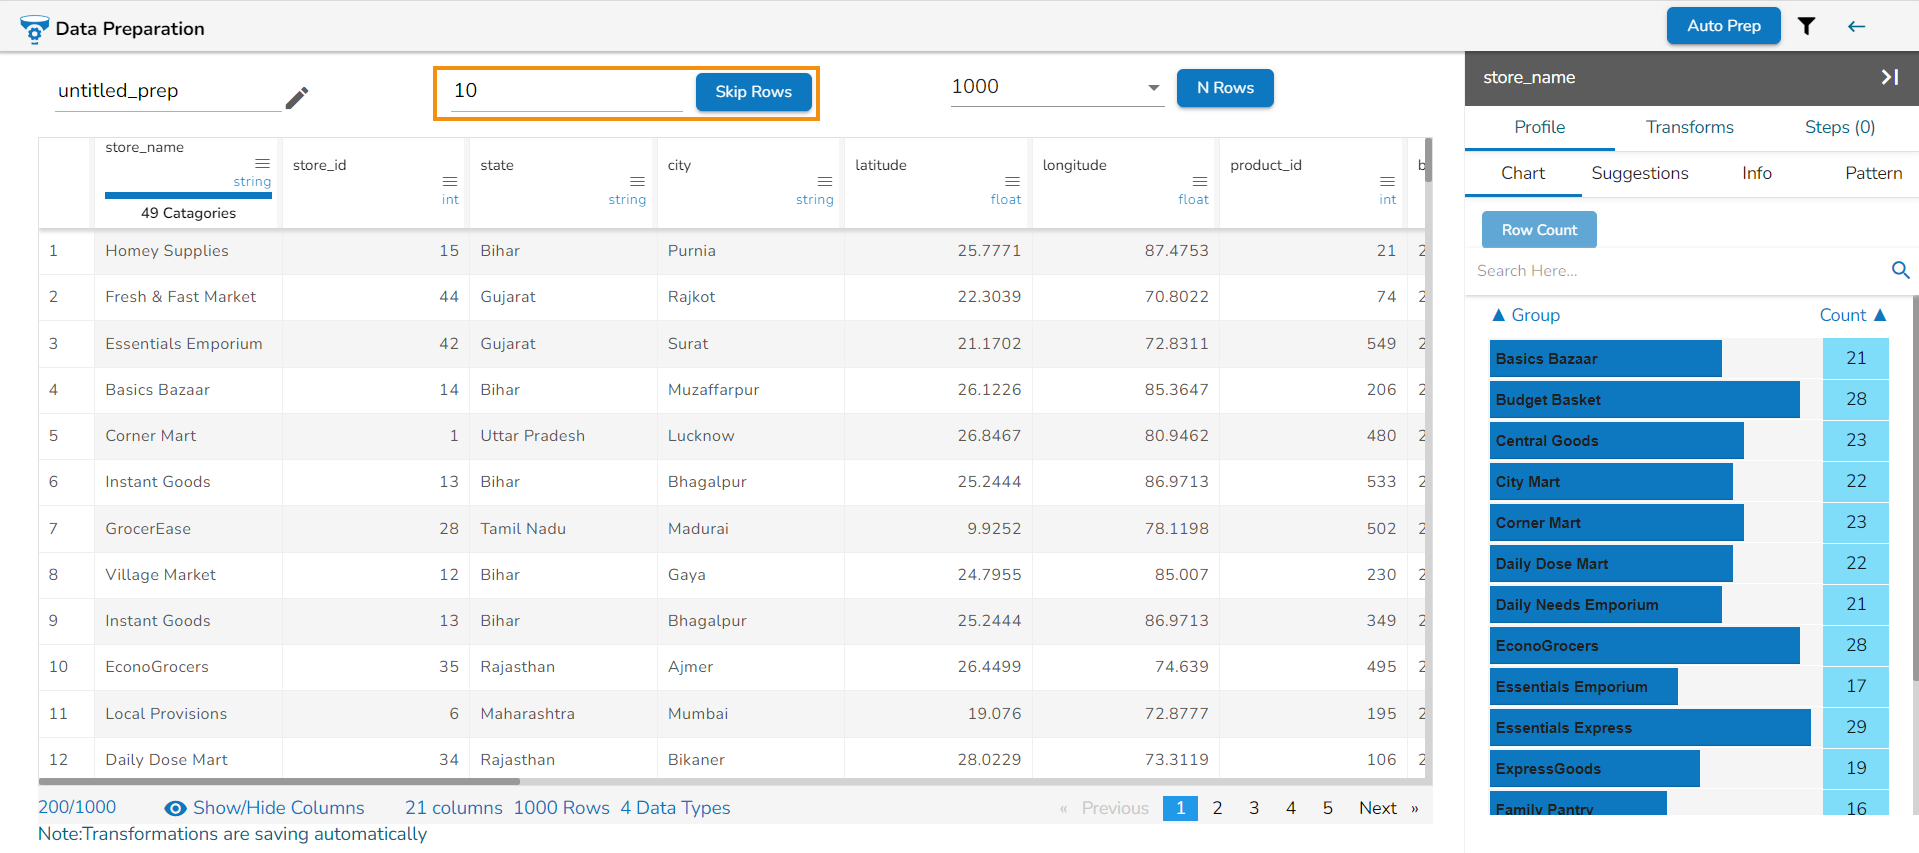
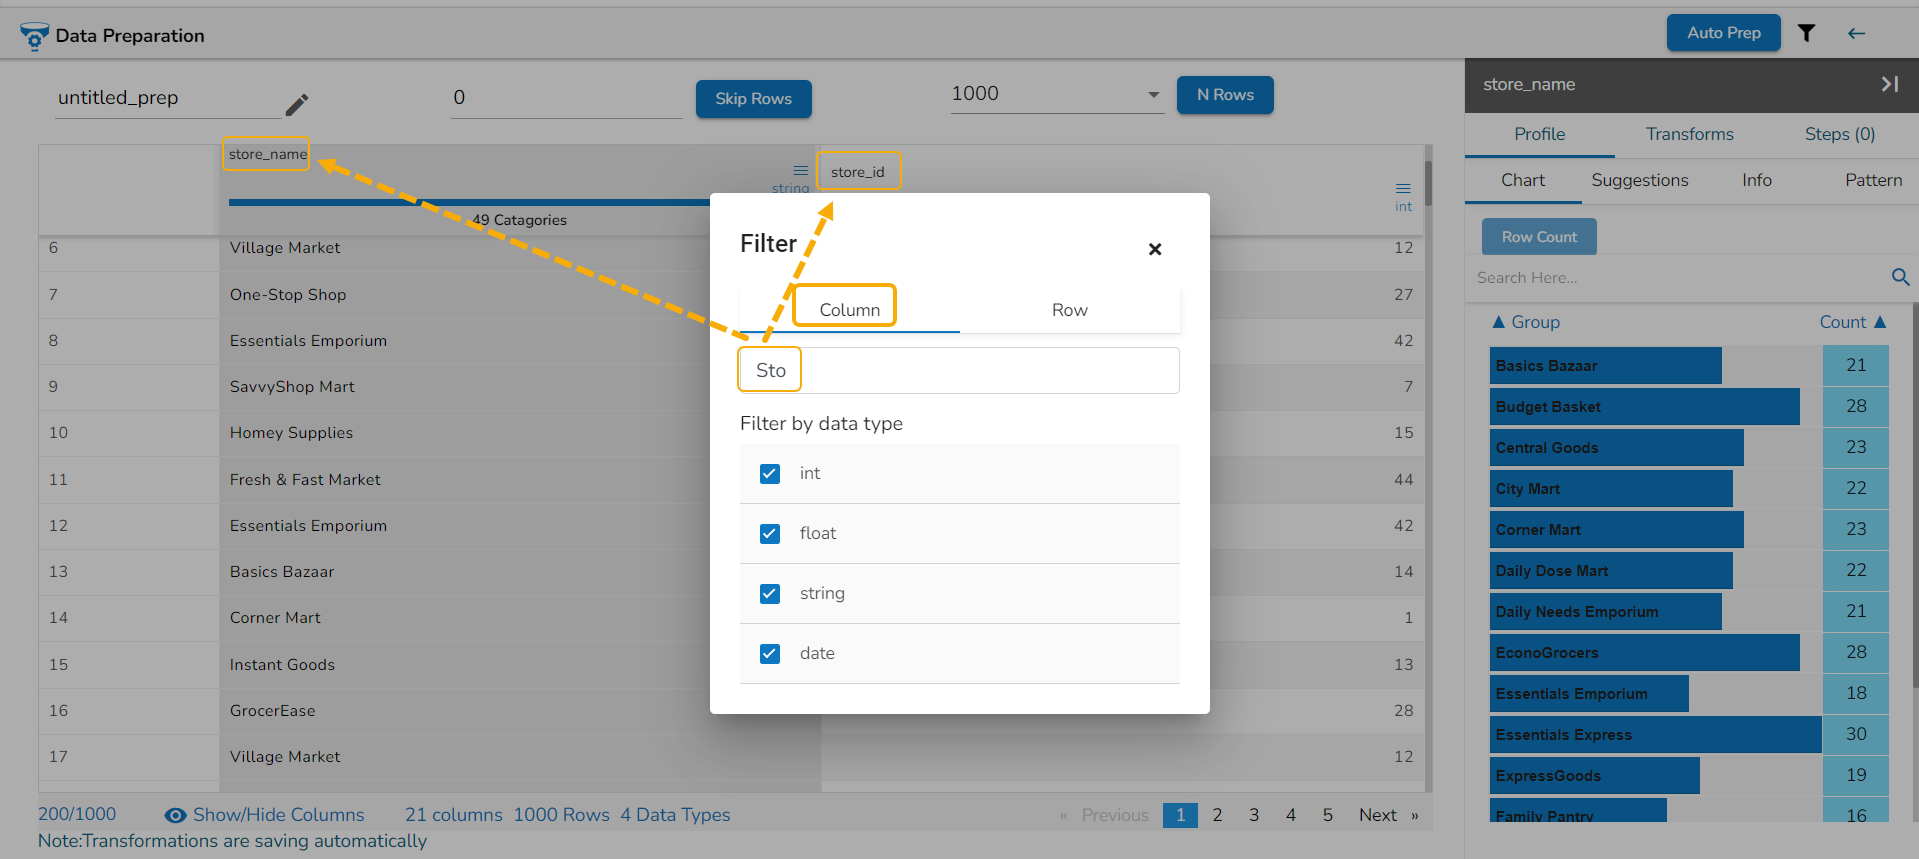
Column: Provide name of a specific column to filter the view by that column. E.g., the given image displays data filtered by the columns that contain the Store word in their titles.
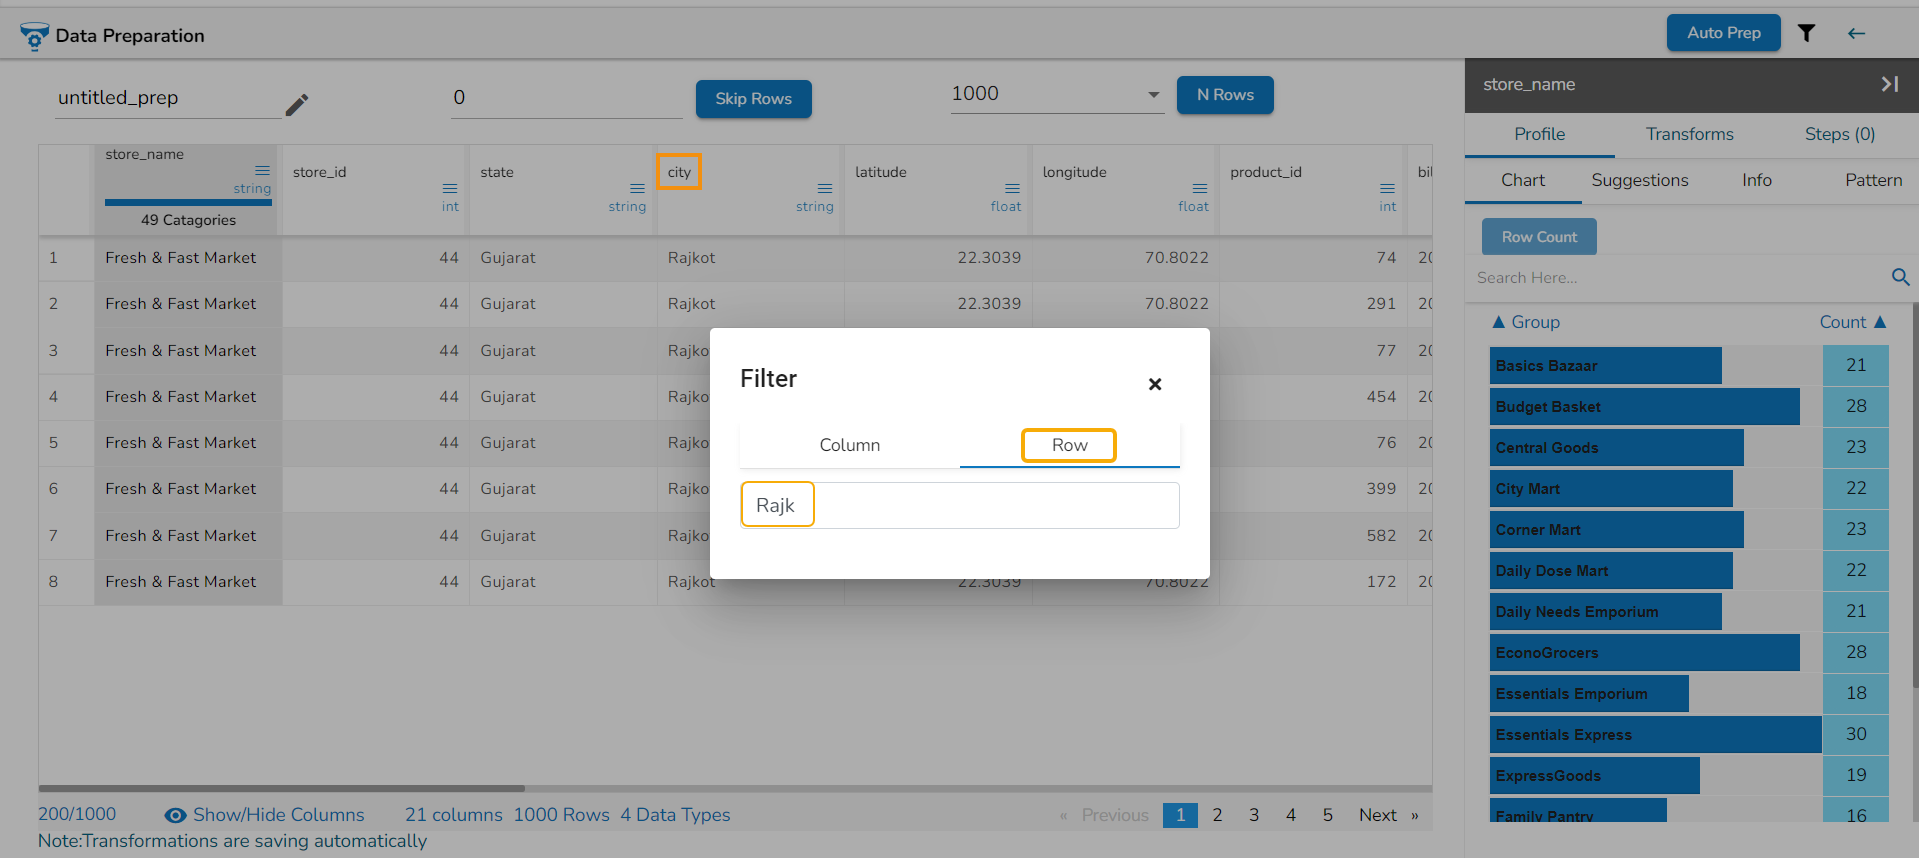
Row: Provide name of a specific row to filter the view by that row. E.g., the given-image filters the data view by the rows that contain Rajkot value.
Please Note:
The Filter dialog box will display all the applicable data types to the available categories of columns from the selected Data Preparation.
The Filter dialog window displays the data type options selected by default while opening it for the first time. The user can edit the choices after opening it.
Keep the data type option checked that can display multiple columns in the filtered view while applying the Column or Row filtering option.
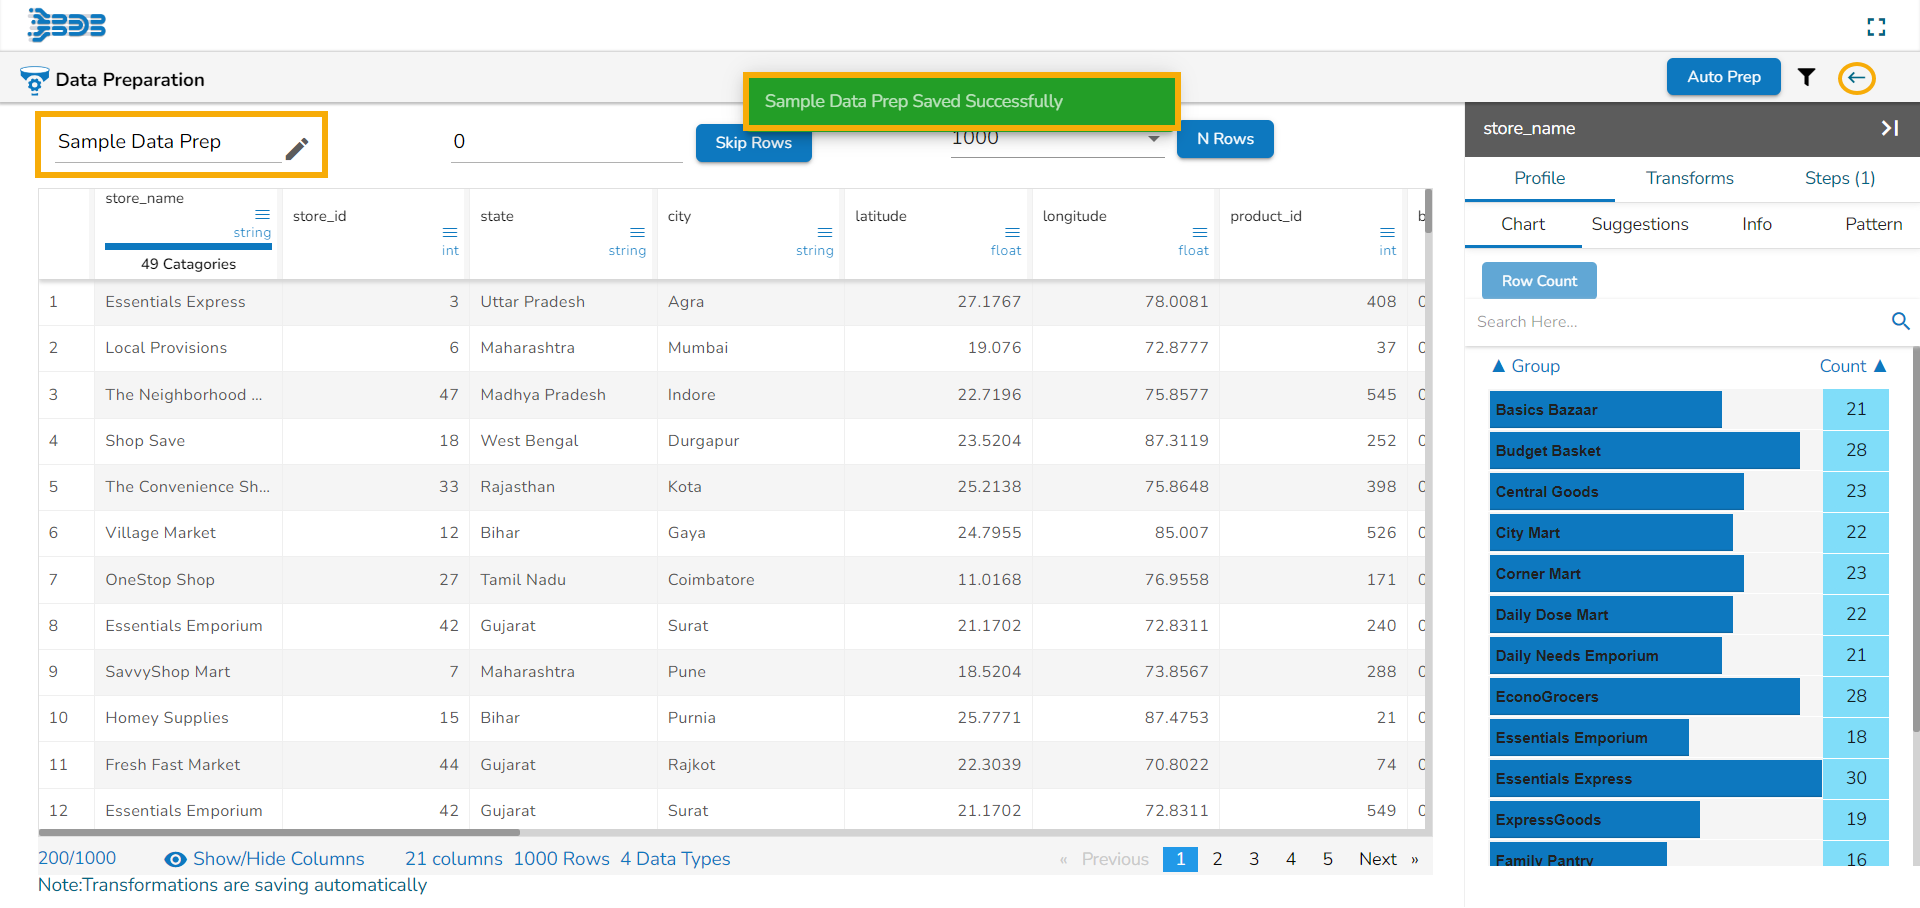
Save Notification Message
A notification message gets displayed indicating that the Data Preparation has been saved each time when the user clicks the Back icon to go back. A sample image of the save notification message is given below:
It is mandatory for a user to give a title to the Data Preparation before saving it. If the user fails to do so and clicks the Back icon, a reminder notification message will appear as given below:

Please Note: The Transformations steps get auto saved in a concerned Data Preparation otherwise as well (without clicking the Back icon), but the notification message may not appear in this case to keep the users informed about the same.