The ML View creation provided under the self-service visualization report helps the user to instantly generate Views based on any ML task. The user needs to provide feature or target column based on the selected ML Task to avail conclusive insights into their chosen dataset.
The supported ML tasks are Segmentation, Anomaly Detection, Time Series, and Sentiment.
Refer the following description to select proper ML task for your dataset:
Segmentation: Explore data intricacies using K-means clustering. Identify hidden patterns and groups within your dataset to pinpoint customer segments, market groups, or other clusters. Tailor strategies to specific audience needs and enhance your understanding of diverse dynamics. Visualize segmentation results through clear graphs in the final Report.
Anomaly Detection: Utilize robust detection methods like Isolation Forest for outlier detection. Identify data errors, deviations, and outliers signaling potential issues or opportunities. Maintain data quality and make informed decisions with a visually summarized presentation of anomalies in the final Report.
Time Series Forecasting: Experience precise forecasting with methods like ARIMA and SARIMA. Uncover short-term and long-term trends in your time-stamped data, offering invaluable foresight for predicting sales figures, stock prices, and more. Make informed decisions based on accurate forecasts, visually summarized in the final Report.
Sentiment Analysis: Leverage natural language processing to discern sentiments in your data, categorizing them into positive or negative tones. Ideal for customer reviews, social media comments, or surveys, this feature provides valuable insights into the subjective nature of your data. Visualize overall sentiments in your data through intuitive graphs in the final Report.
Find the compatible column types for each task described below:
Time Series Forecasting
1 Date/Time column, 1 measure column (e.g., sales, salary)
Predicts future values based on historical trends. Requires equally spaced dates (weekly, monthly, yearly).
Sentiment Analysis
Text/Dimension column required
Analyzes sentiment (positive, negative) using BERT Language Model.
Segmentation
Numerical features and measures
Groups data points based on similarities.
Anomaly Detection
Numerical features and measures
Identifies unusual data points that deviate from patterns.
Navigate to the Report final screen.
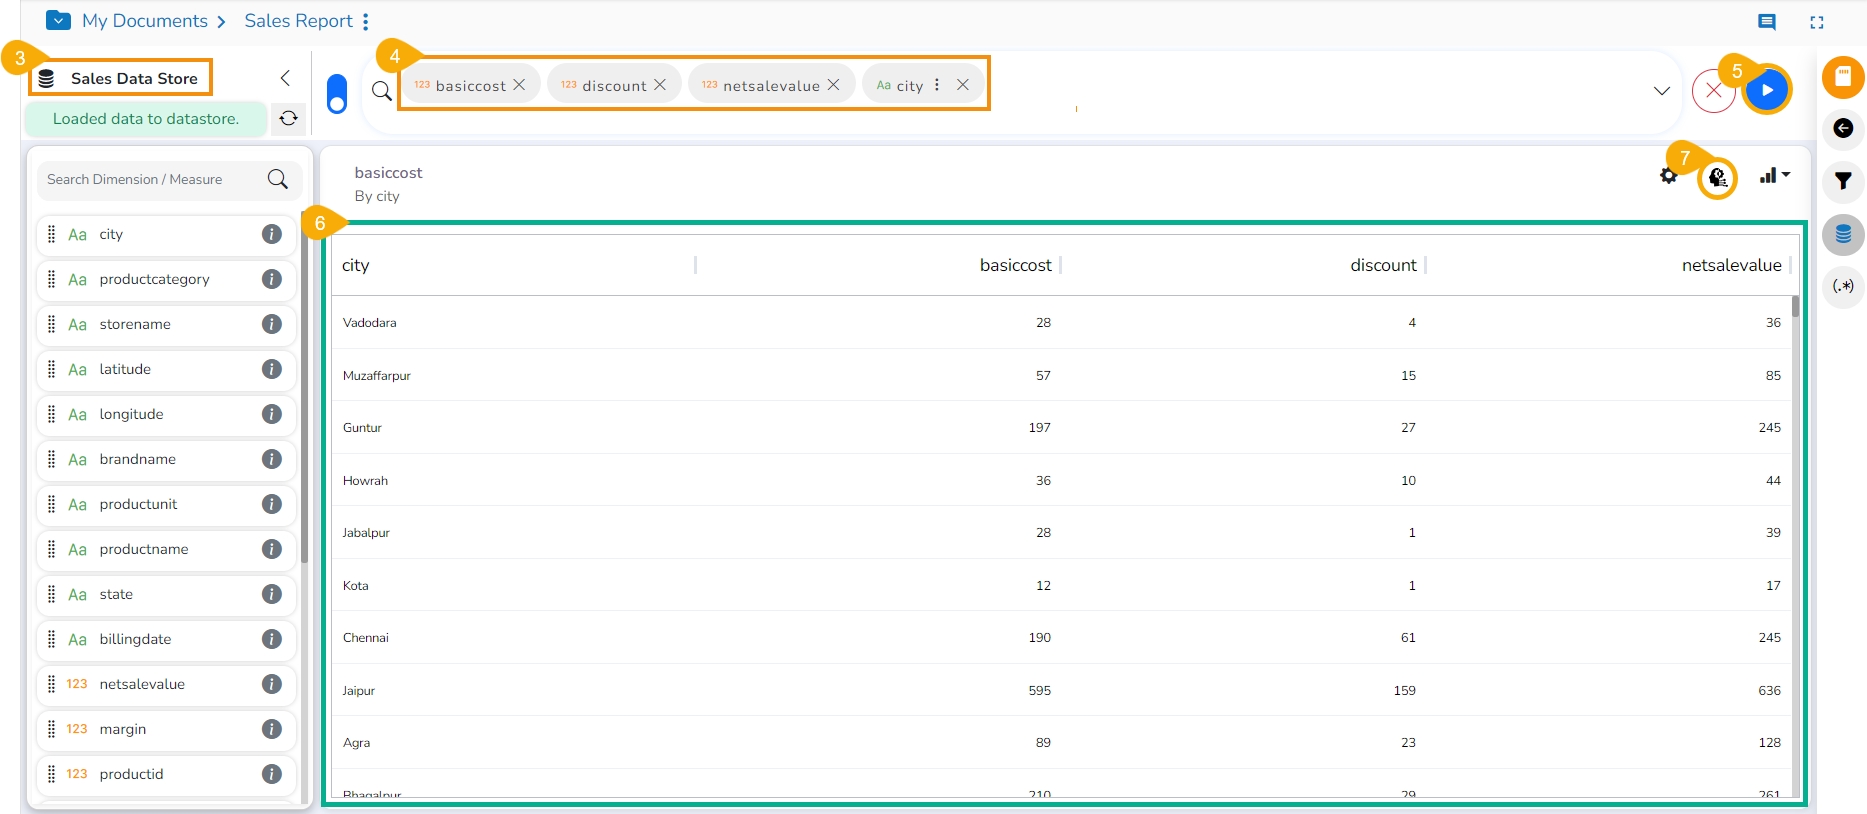
Click the Create New ML View icon.
The Design View canvas opens to design a View.
Select or drag-drop required Dimensions and Measures.
Click the GO option to generate the View.
Once the View gets created, the user will get ML Properties icon to perform ML function.
Click the ML Properties icon.
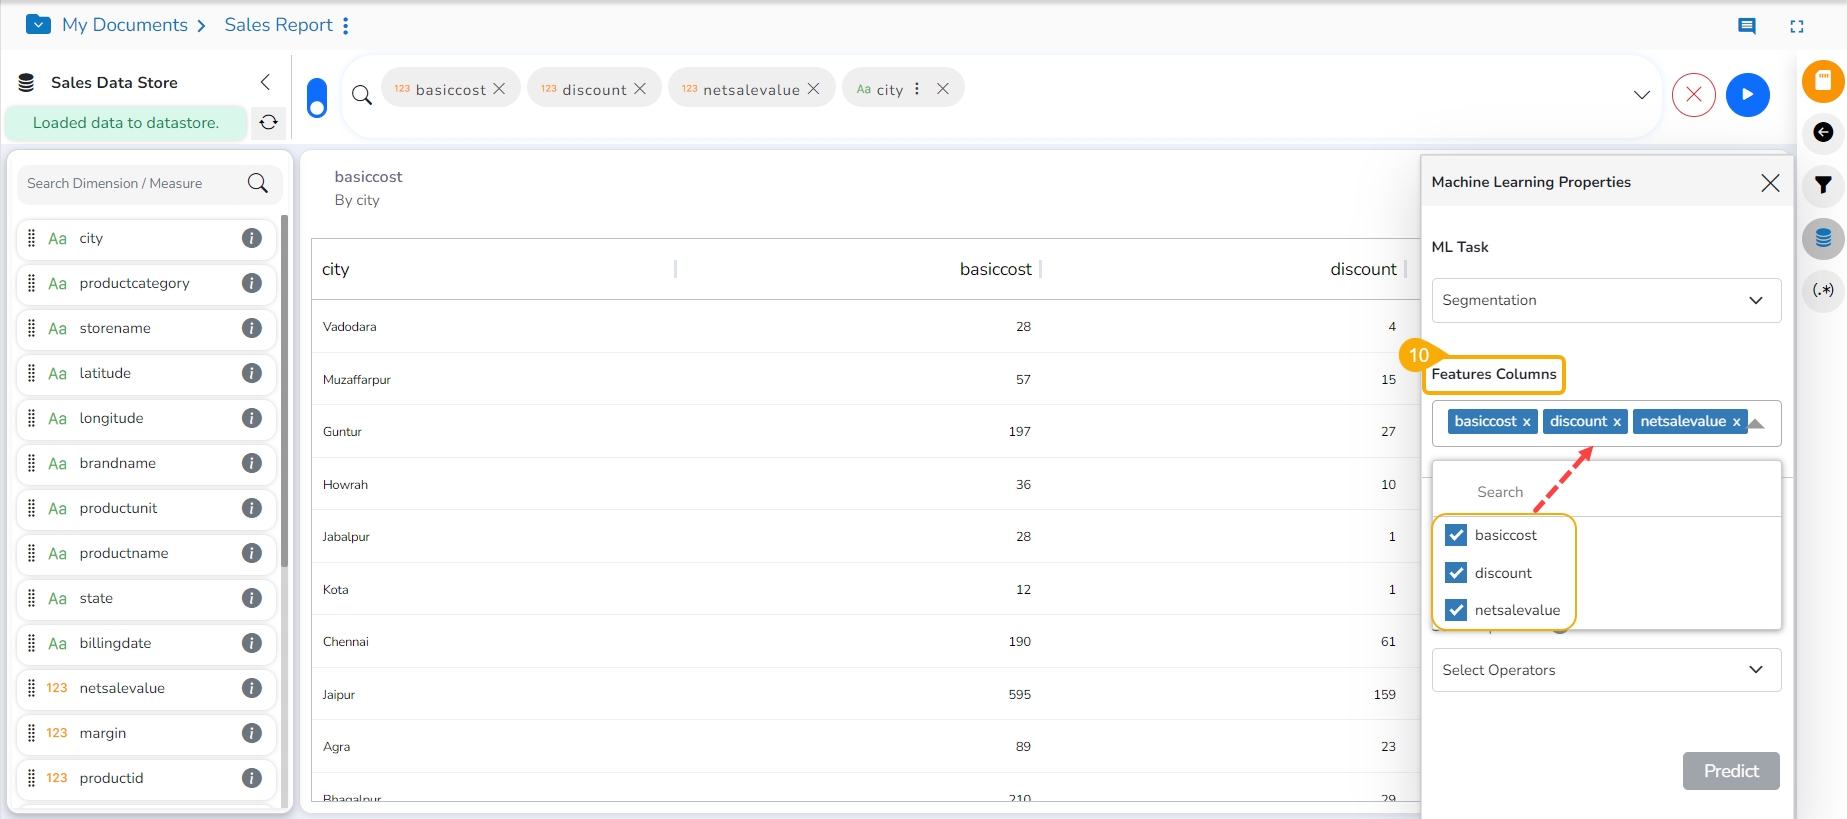
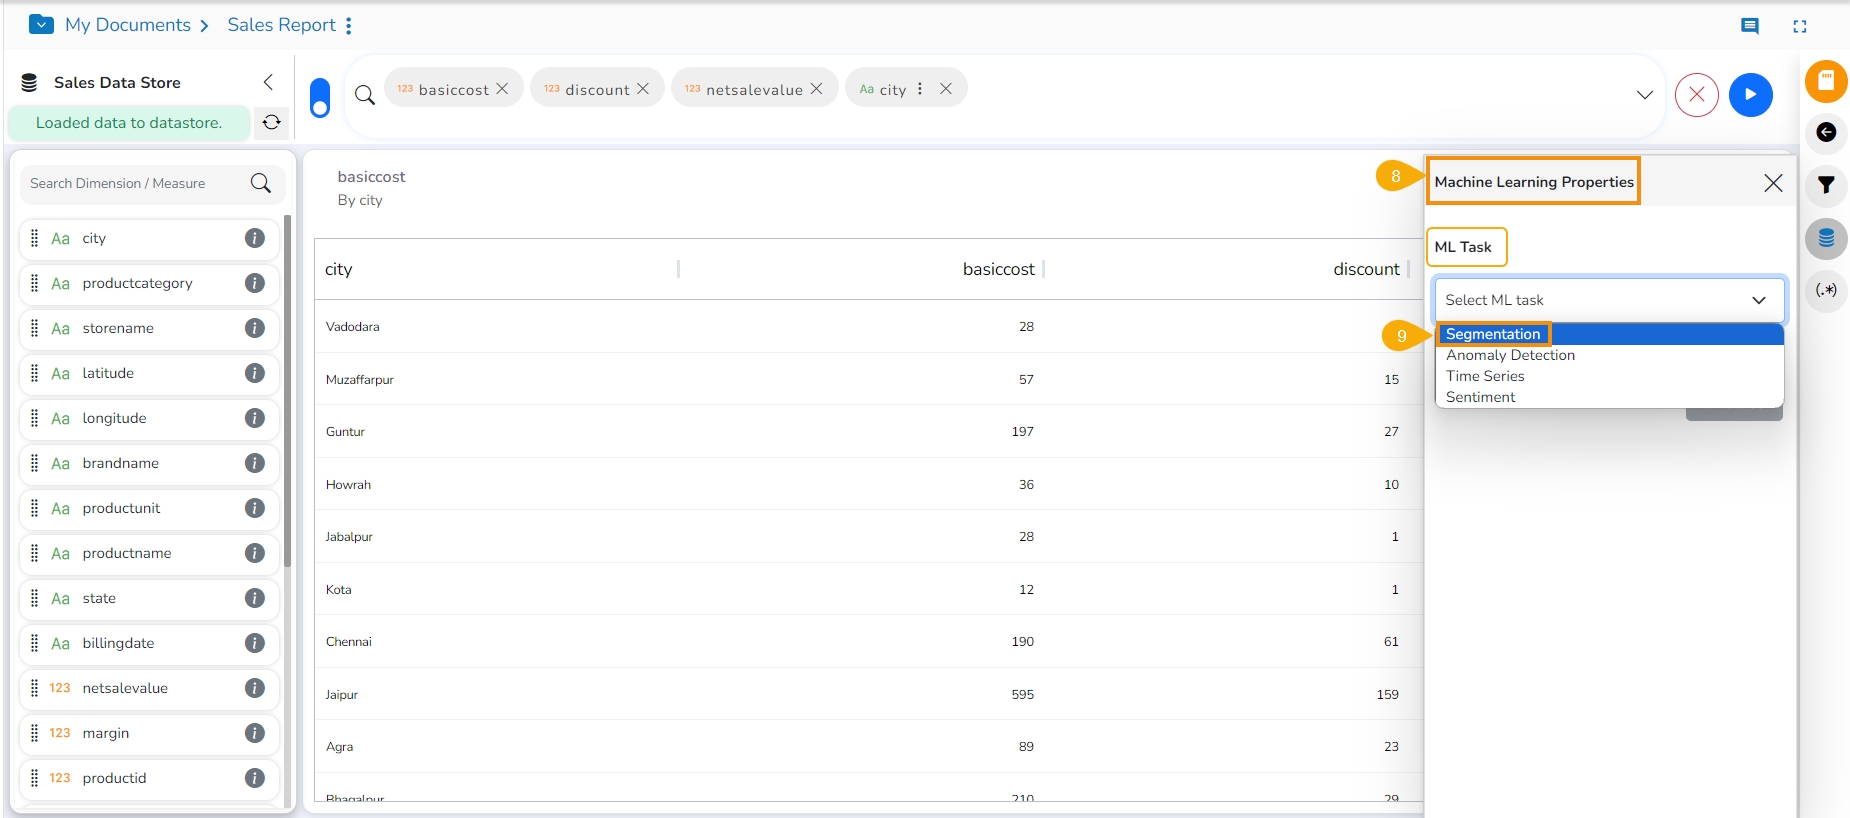
The Machine Learning Properties window appears.
Select an ML Task from the given context menu.
Fields specific to the selected ML Task will appear to apply it. In this case, select the Feature Columns by using the checkboxes.
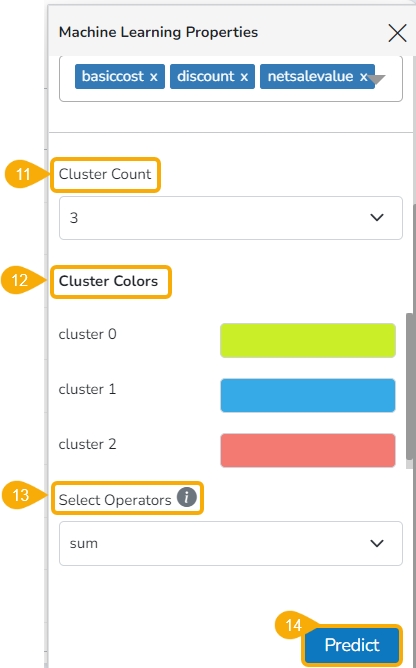
Provide a number to specify the Cluster Count.
Some Cluster Colors will be provided based on the selected count of the Cluster. The user can modify the pre-selected colors by using the color pallet that appears by clicking the existing cluster color field.
Select Operator using the context menu.
Click the Predict option.
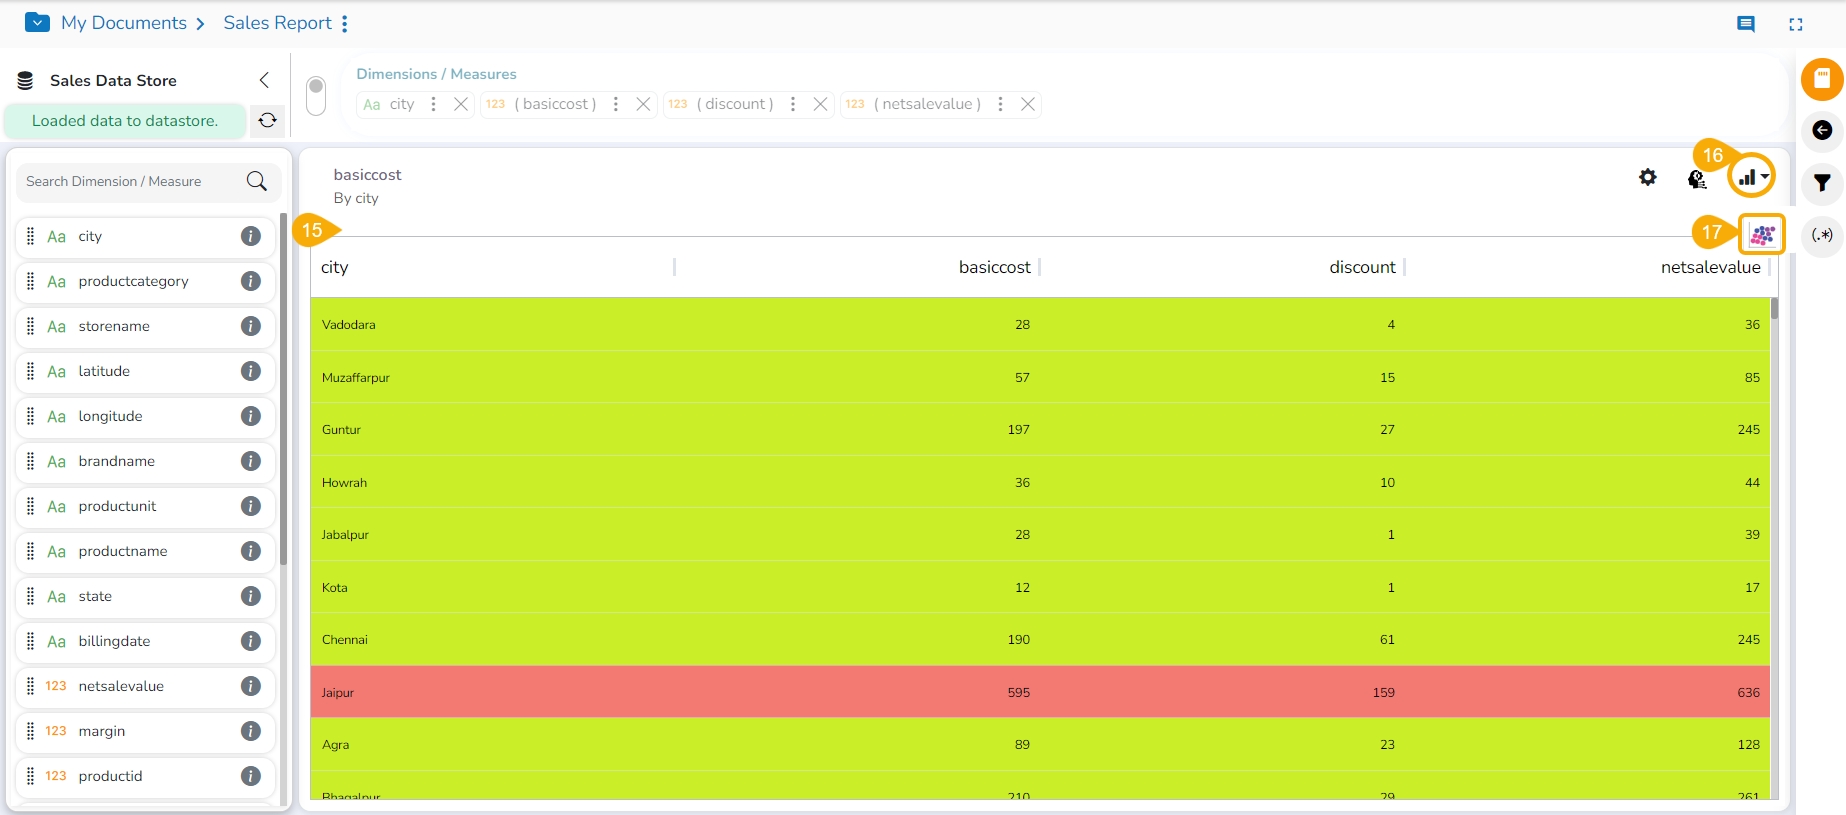
Based on the selected ML task the View gets displayed.
Click the Chart List icon.
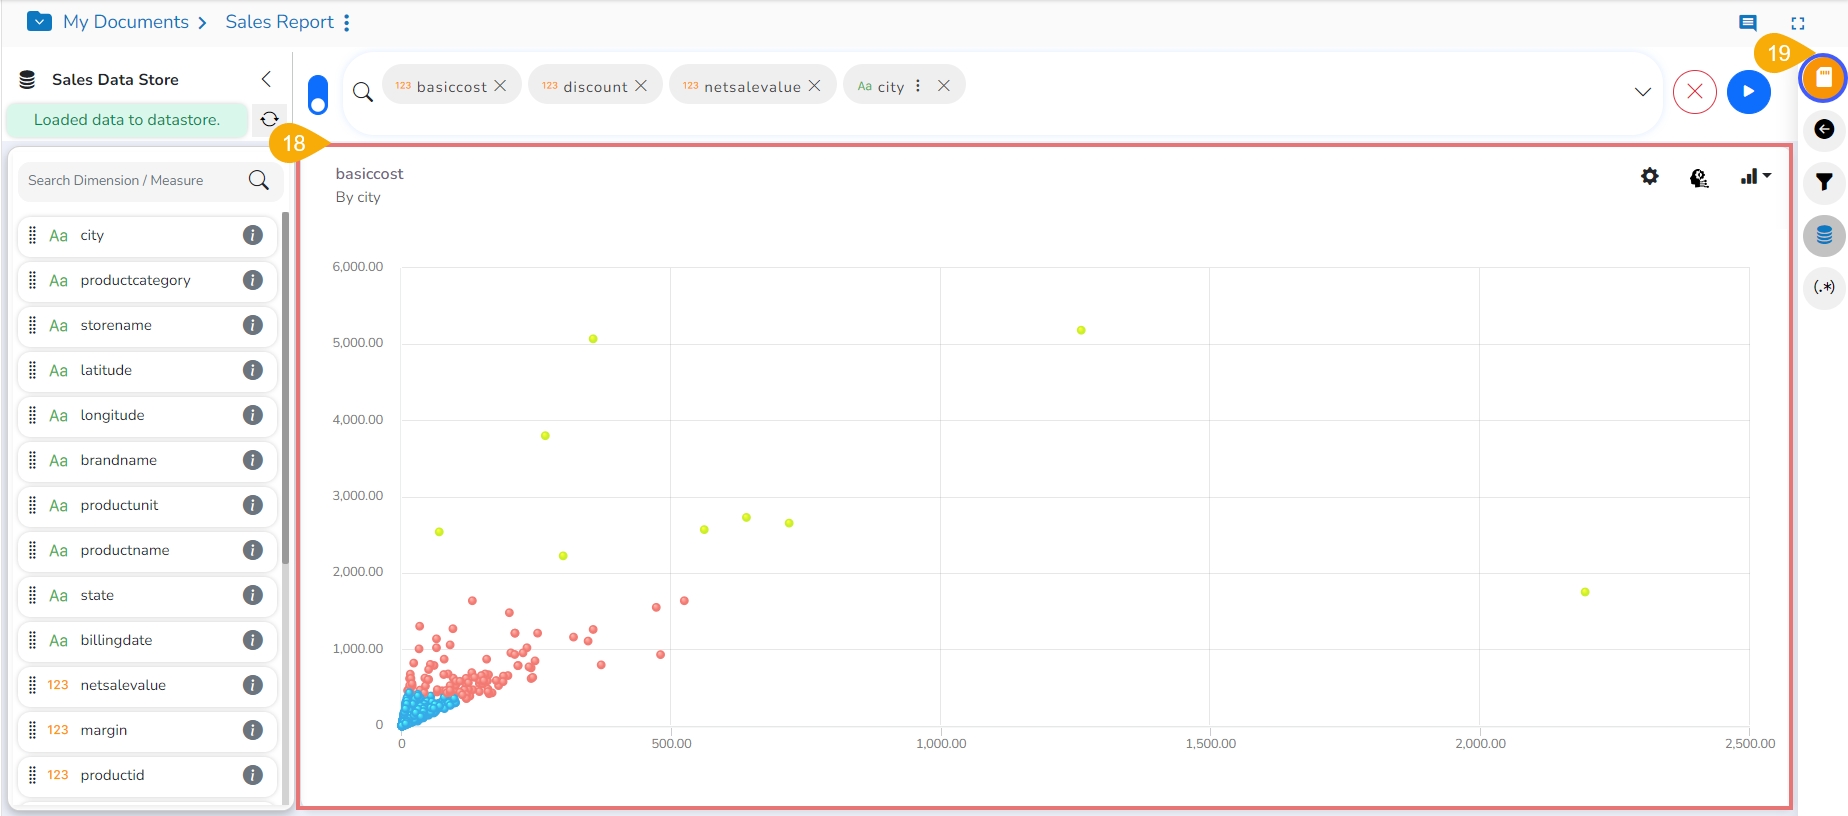
Click on the other chart option. In this case, it is scatter plot chart.
The View appears in the selected (scatter plot) chart option.
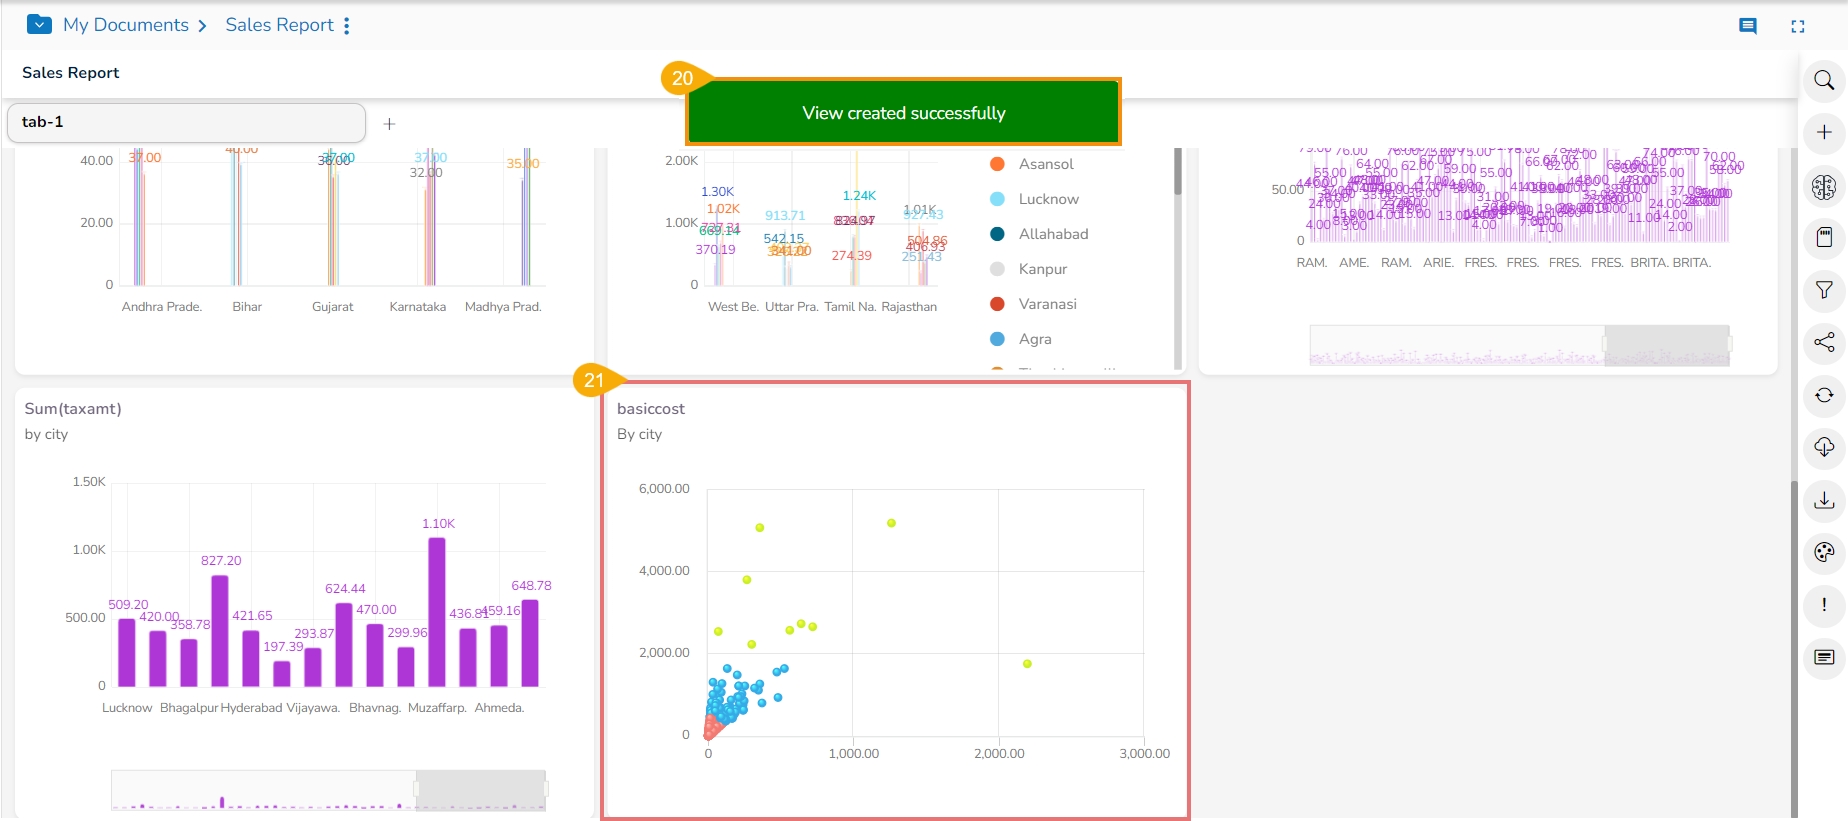
Click the Save View icon to save the View to the report.
A notification message appears.
The ML task based View gets added to the final screen of the Report.
Group your data based on similarities in measures and numeric features.
View results:
Table: Up to two measures visualized together for easy comparison.
Scatter Plot (2 measures): Visually explore relationships between two measures for each segment.
Check out the given video to know the details on ML View creation based on the Segmentation Task.
Identify unusual data points that deviate from patterns in your measures.
View results:
Line Chart: Track anomalies highlighted as points diverging from the overall trend.
Table: See individual rows flagged as anomalies, allowing for further investigation.
Check out the given video to learn the details on ML View creation based on the Anomaly Detection Task.
Select the column you want to predict. The Auto-ARIMA model will automatically train and choose the best parameters.
View results:
Table: See predicted values highlighted at the end of the model.
Line chart: Visualize historical data with predicted values as dotted lines.
Check out the given video to learn the details on ML View creation based on the Time Series Forecasting Task.
The analysis will process your text column and analyze sentiment.
The analysis is performed in the browser; the processing time varies based on the availability of client browser resources.
View results:
Pie Chart/ Mixed chart: Get a quick overview of overall sentiment distribution (Positive and Negative).
Positive and negative sentiments count will be shown in tiles.
Check out the given video to learn the details on ML View creation based on the Sentiment Analysis Task.
Please Note: The maximum supported word count for Sentiment Analysis is 2000.

