Loading...
Loading...
This section aims to describe the available Data Drill options for a specific report view.
Loading...
Loading...
This data drill functionality allows the user to drill through a data dimension.
Check out the walk-through on how to Drill through a dimension value.
The Drill Through option allows the users to drill down in the data values of a saved view on the storyboard for the selected story.
Navigate to the final screen of a report.
Select a View that has at least one Dimension. Click the ellipsis icon for such a View.
Select the Analyse option for the selected View.
The View opens in the Analyse window.
Left-click on a column displaying a data value.
This action opens a context menu.
From the context menu, locate and select the Drill Through option.
A list of related drill-through options will appear. Select the desired option to proceed with the drill-through analysis.
Once a drill-through option is selected, the view dynamically updates to reflect the chosen data perspective. For example, selecting a source-wise drill-through option displays the sum of the USD billing for the selected skills (BizViz, SQL, Algorithms) in a data grid.
Users can refine the displayed data by selecting a different dimension for the drill-through. To do this, use the drop-down menu located next to the currently selected dimension.
Select another Dimension from the displayed context menu to Drill Through the View.
The View gets modified based on the selected Dimension. E.g., the given image displays the Previous organization-wise sum of USD billing for the same set of skills.
Please Note: Click the Close icon next to the selected Drill Through option to be redirected to the original View display.
This data drill allows the user to penetrate into deeper granularity level of the time dimension.
Check out the given walk-through on the Drill Into functionality.
The Drill Into option allows users to drill down in the time values of a saved View on the selected report.
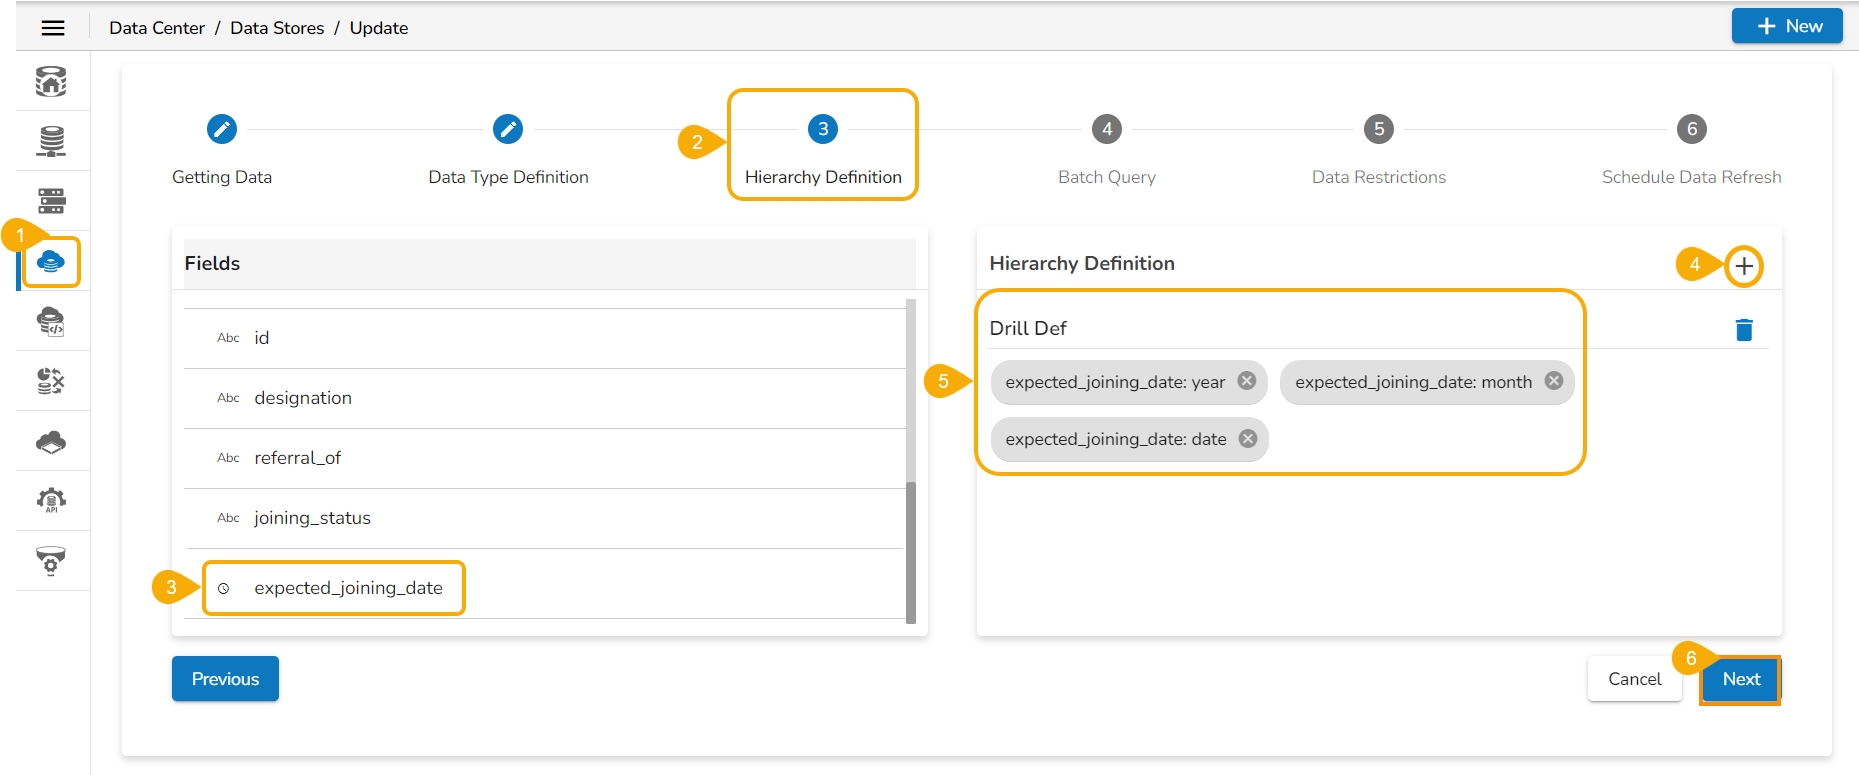
Pre-requisite: The user must define a hierarchical pattern among the date dimensions under the Data Center Module before using the Data Drill/ Drill into functionality in the Report.
Select an existing Data Store (or you can define the hierarchy while creating a new Data Store).
Navigate to the Hierarchy Definition tab.
Select a Date Dimension field.
Click the add icon to add a new Drill Def space.
Drag the selected Data Dimension to the Drill Def space (By default the dragged Date Dimension gets divided into 3 granularity levels).
Click the Next option.
Please Note: To save the Data Store with the defined hierarchy. Please refer to the Data Store section for more details about the Datastore creation process.
Access the saved View from a report. Use the double-clicks to open it in the Analyse mode or Click the Analyse option for the saved View.
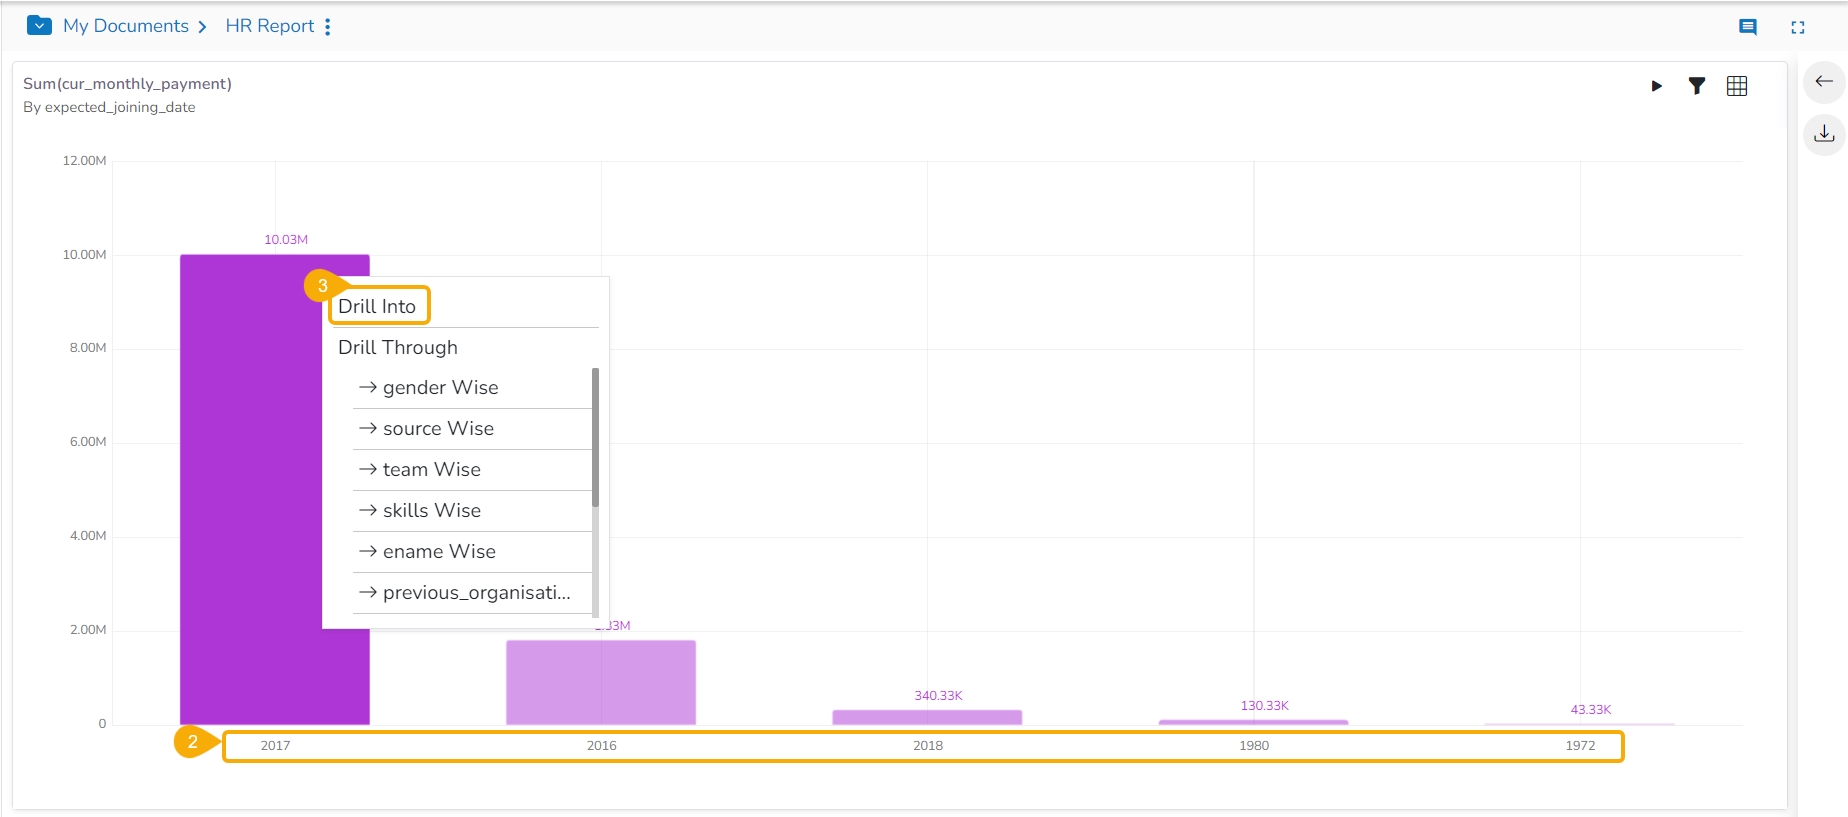
The Analyse window opens displaying Year as the highest-level granularity of the date drill.
Select the Drill Into option for drilling down the time dimension.
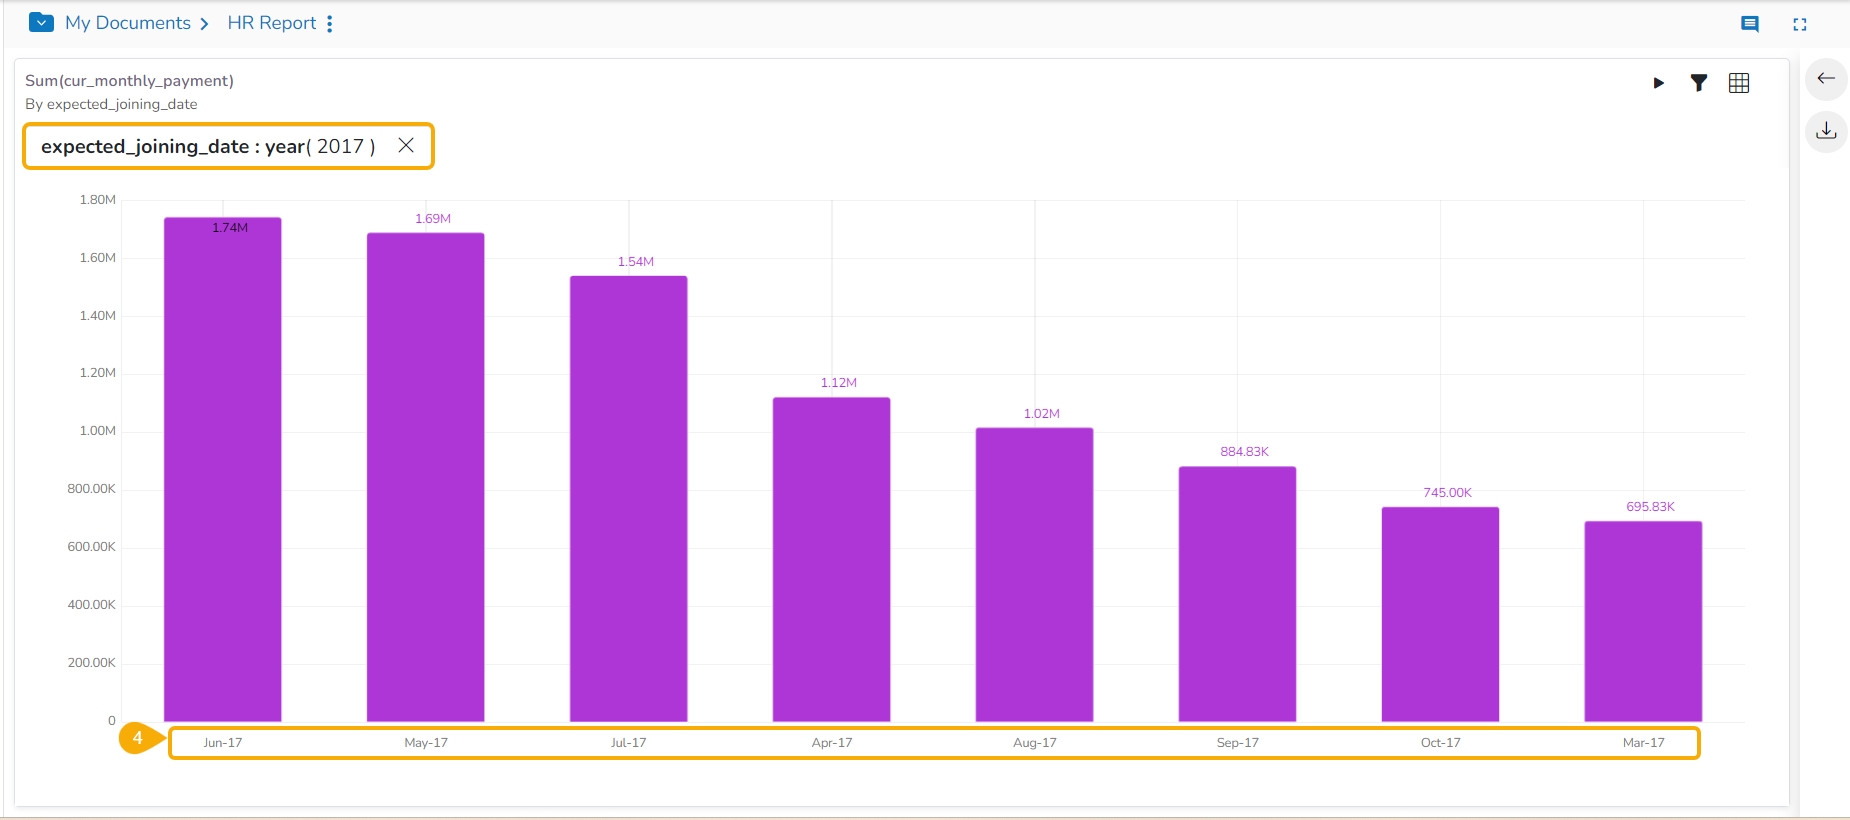
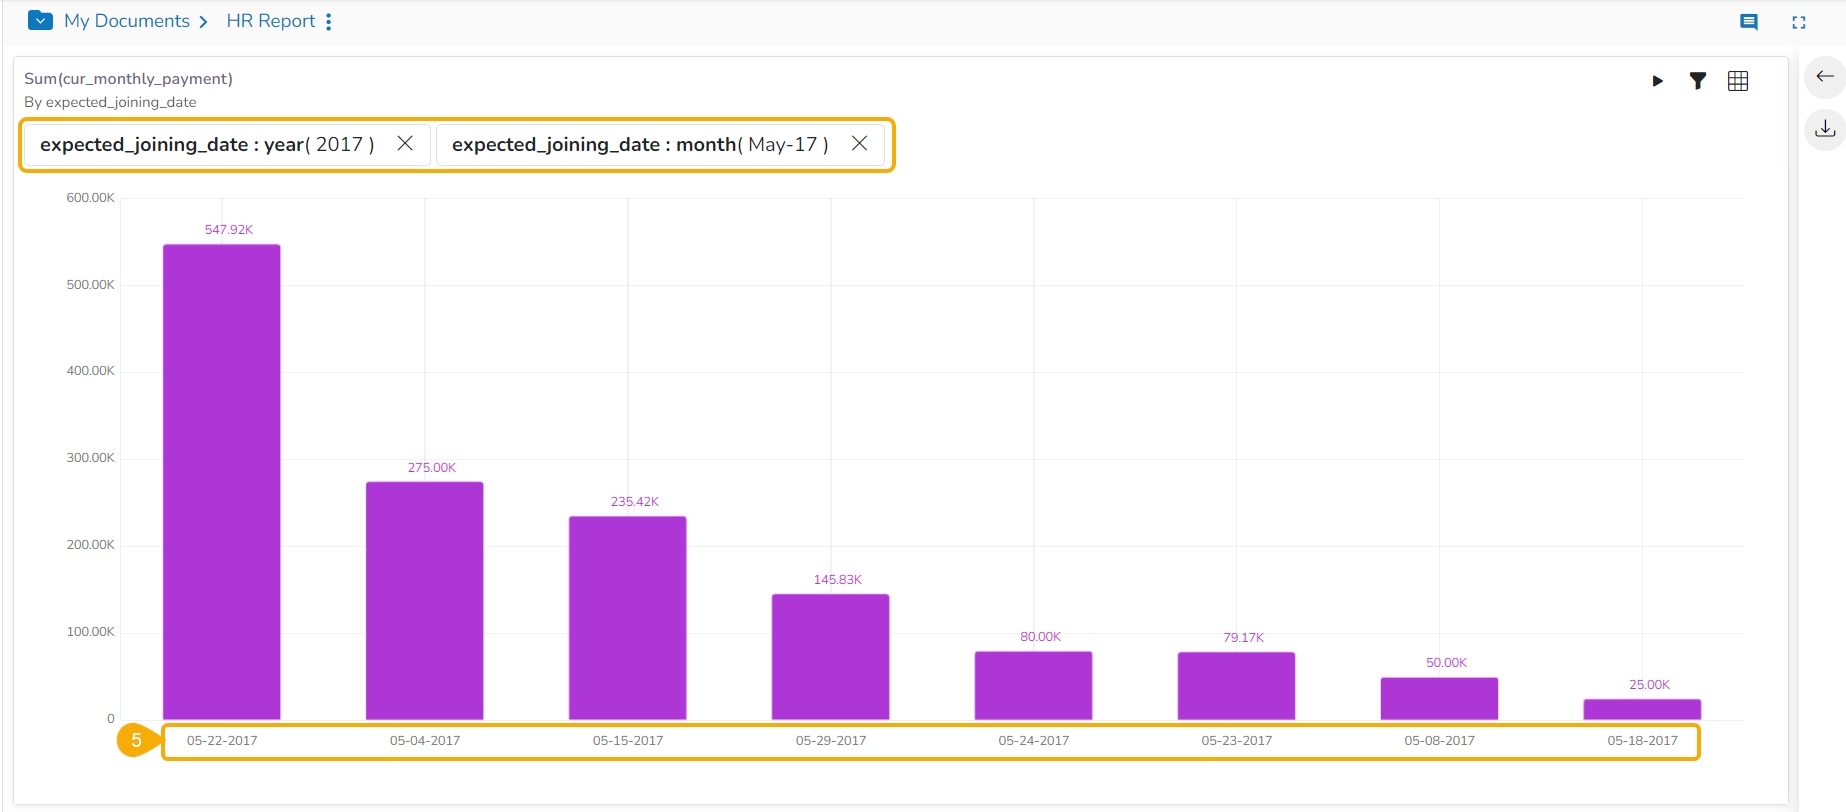
By clicking the Yearly granularity of the time value, the user gets the monthly value displayed in the selected view.
Click on the monthly granularity to display the exact dates of joining.
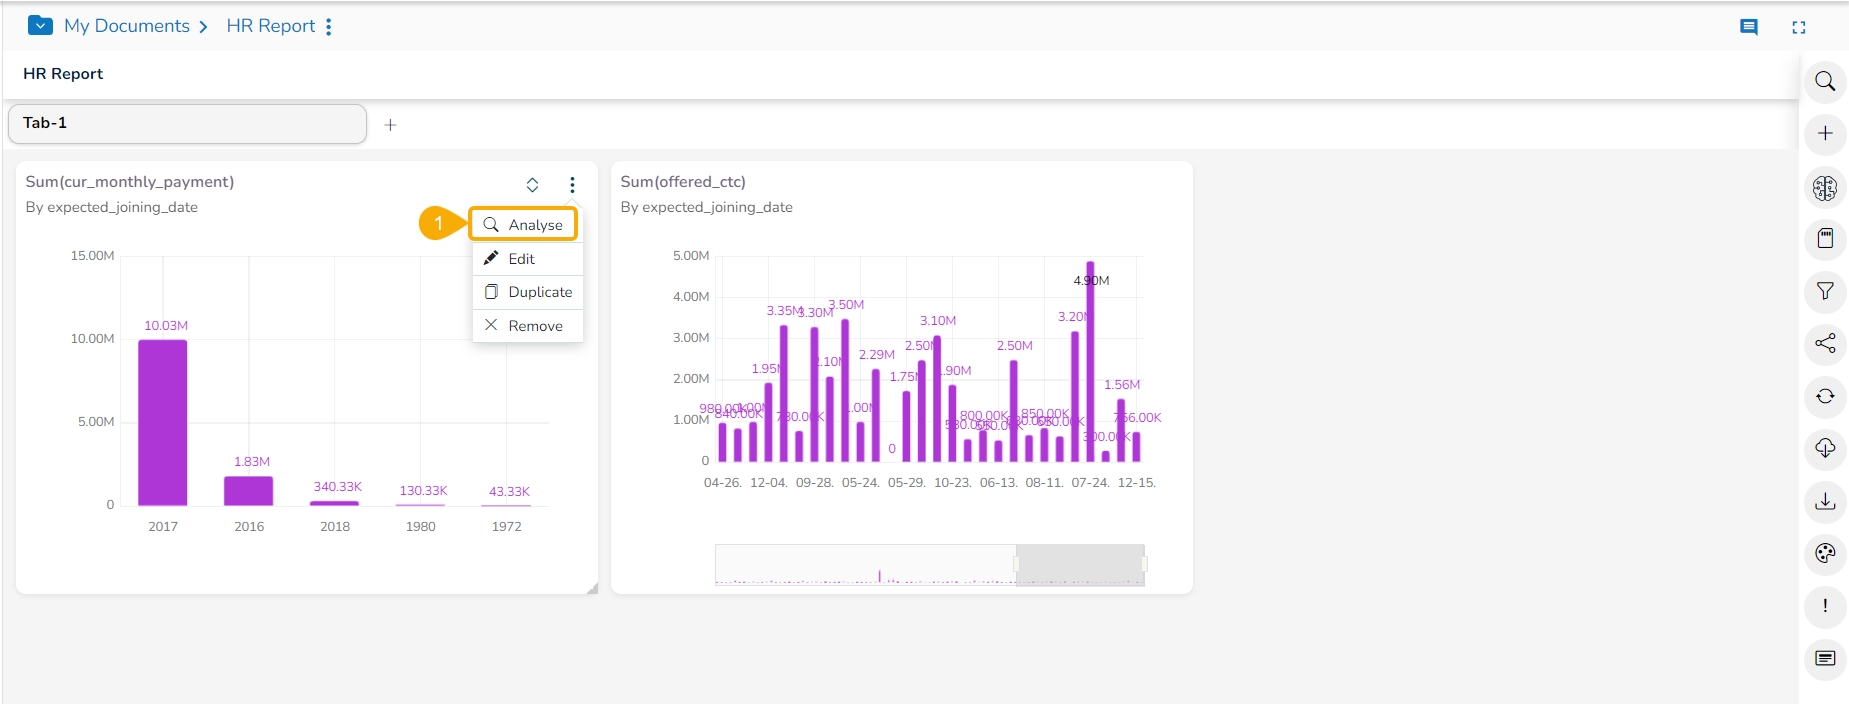
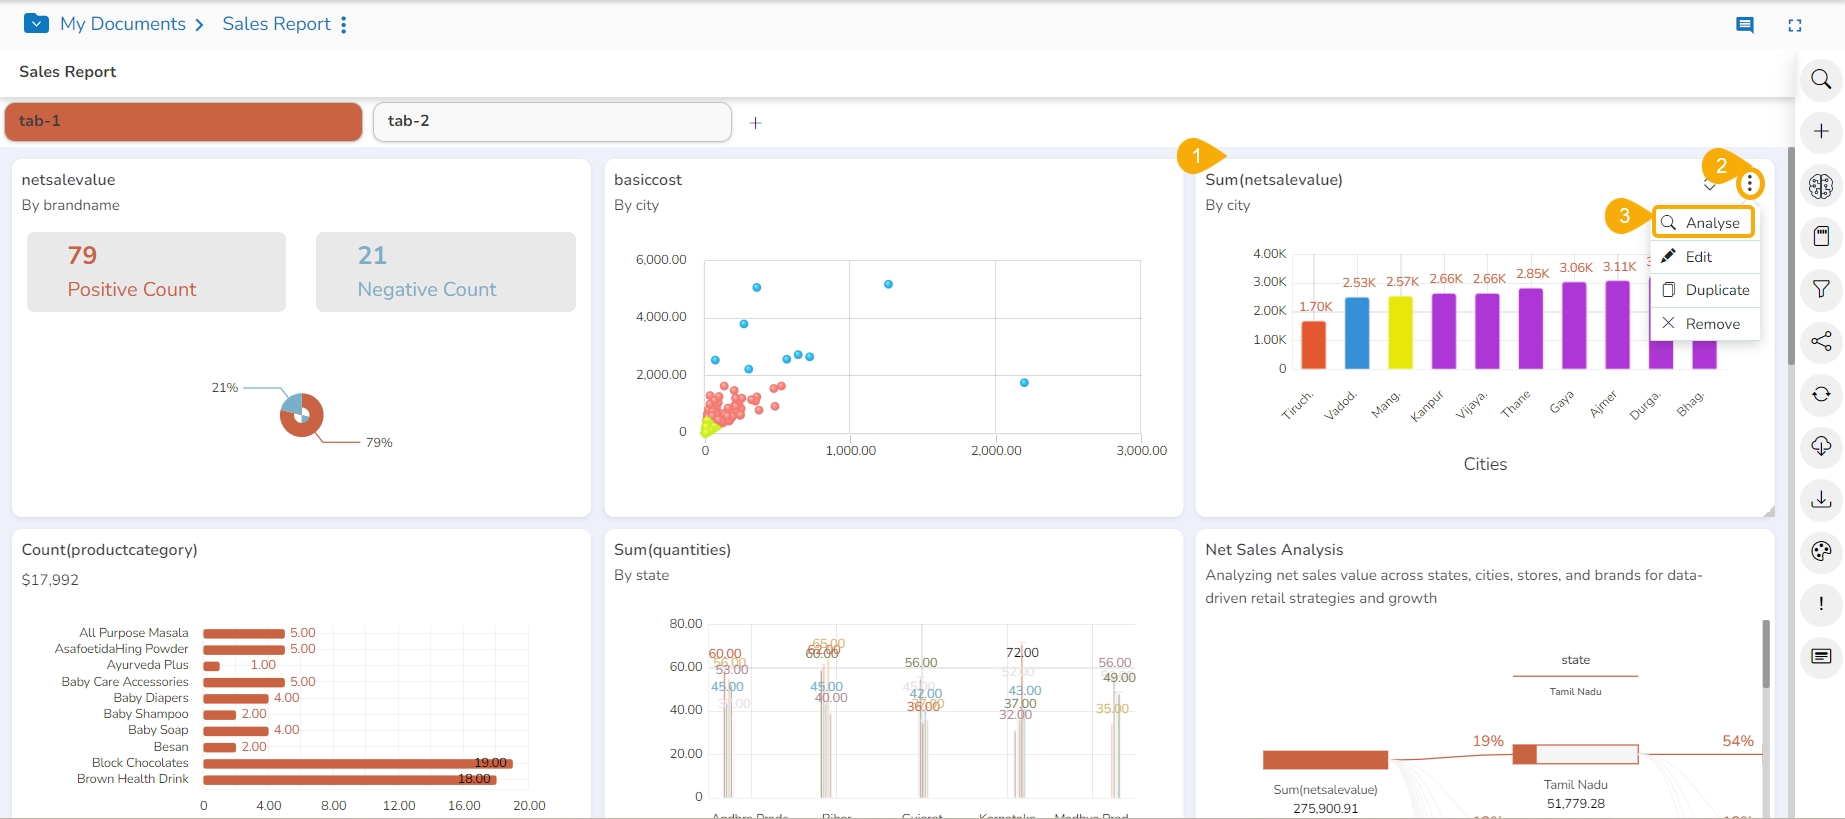
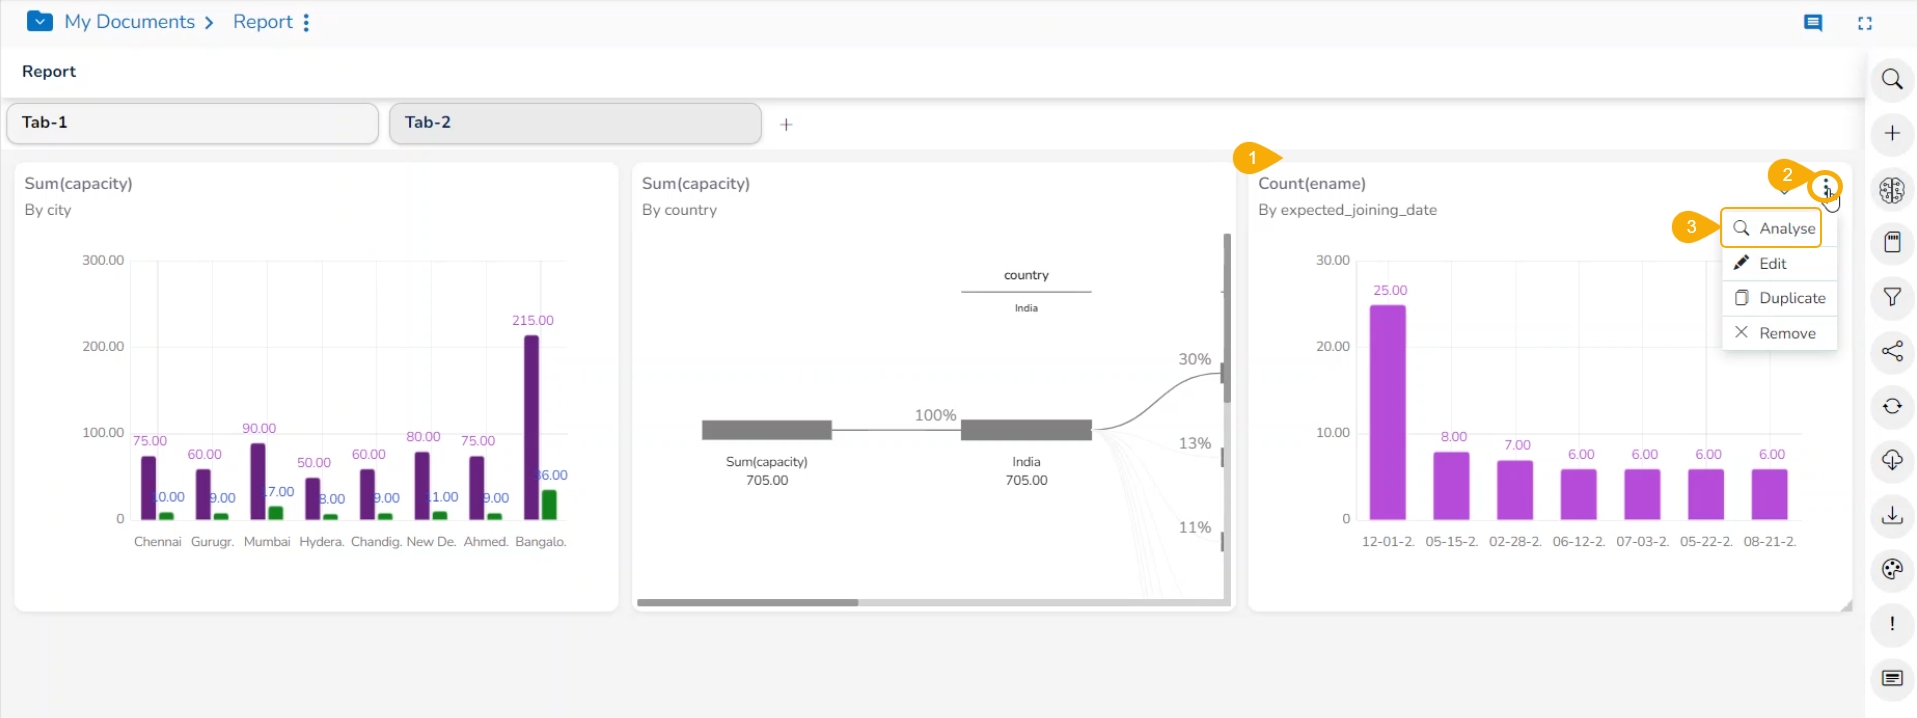
Select a View from the final screen of the Report.
Click the Options icon.
Click the Analyse option from the displayed context menu.
The selected View opens in the analysis mode.
The user can select any of the following options to analyze a saved view:
Icon
Name
Action
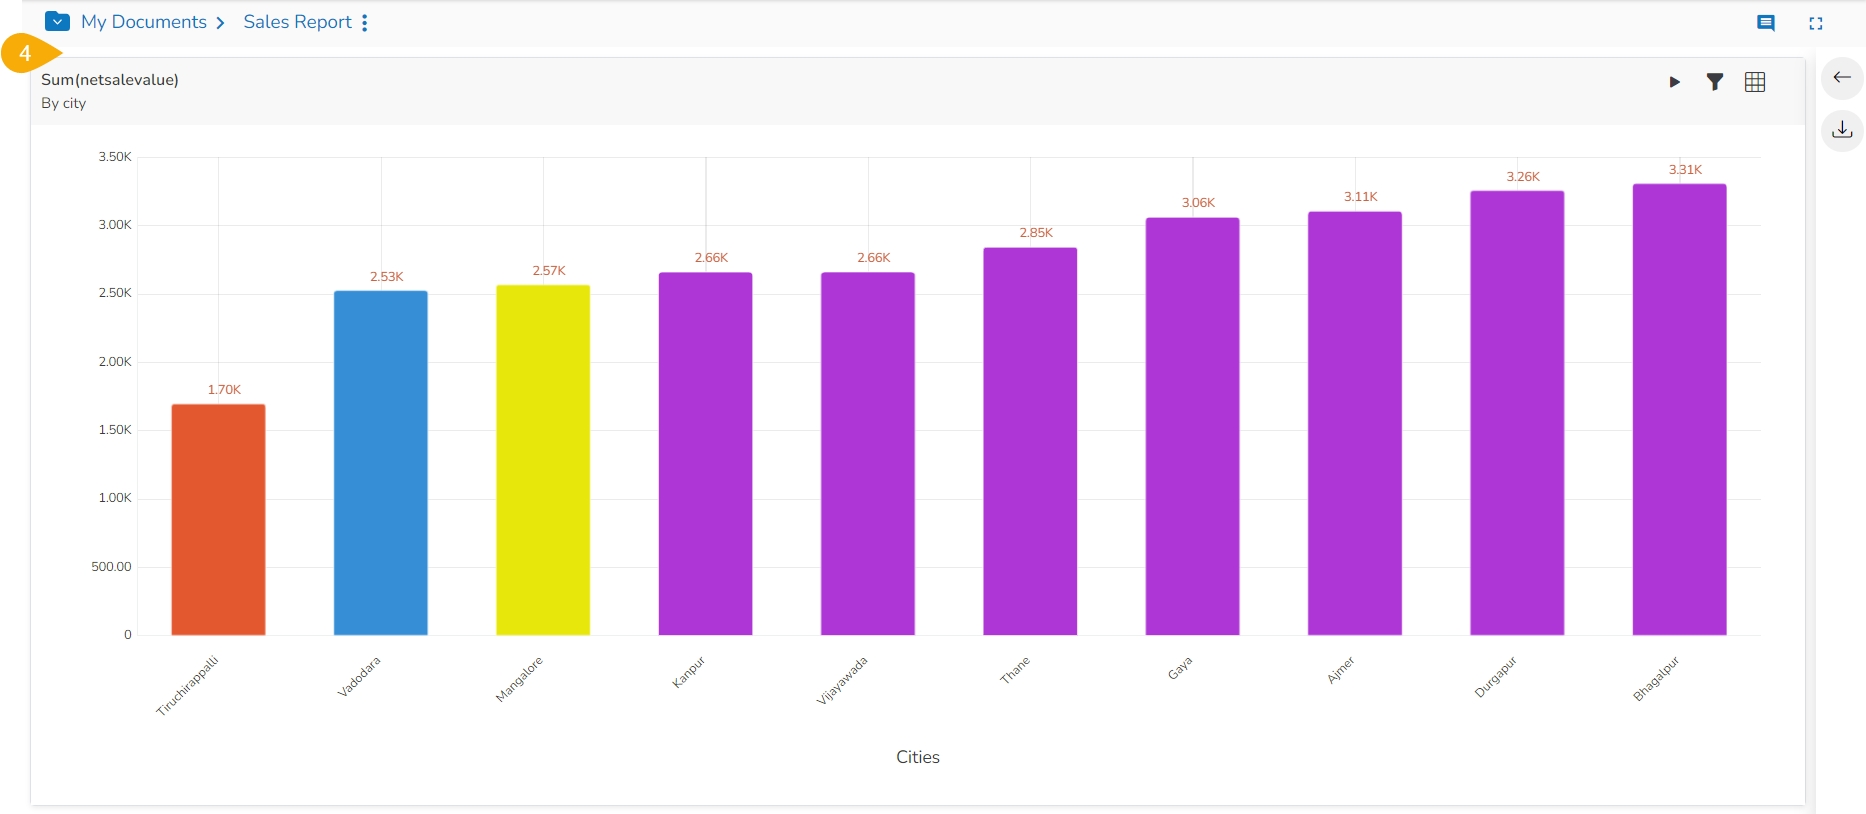
Chart
Displays data in the chart format.
Grid
Displays data in the grid format.
Export
Exports the Story in CSV/XLSX/PDF format.
View Filter
Displays filter panel to apply or edit view-specific filter conditions.
Timeline Play
Displays changes in the selected data over a period.
Back
Redirects back to the storyboard.
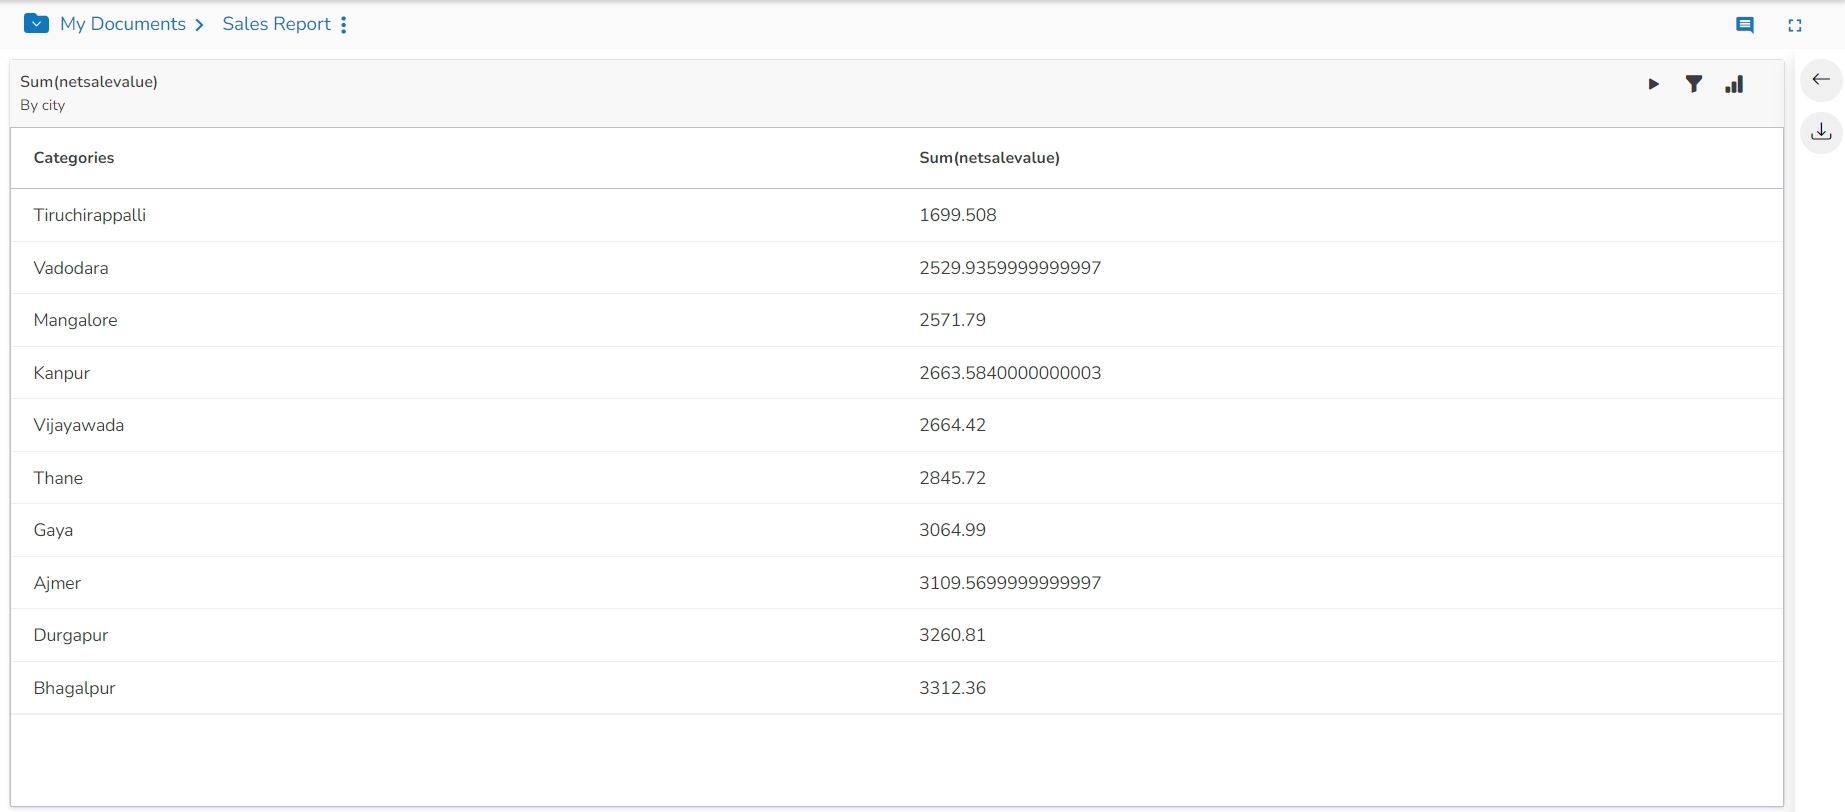
Displaying the View Data in the Grid View.
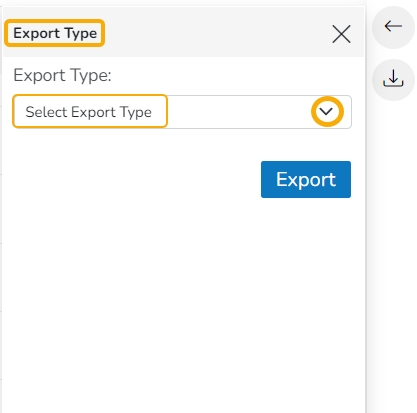
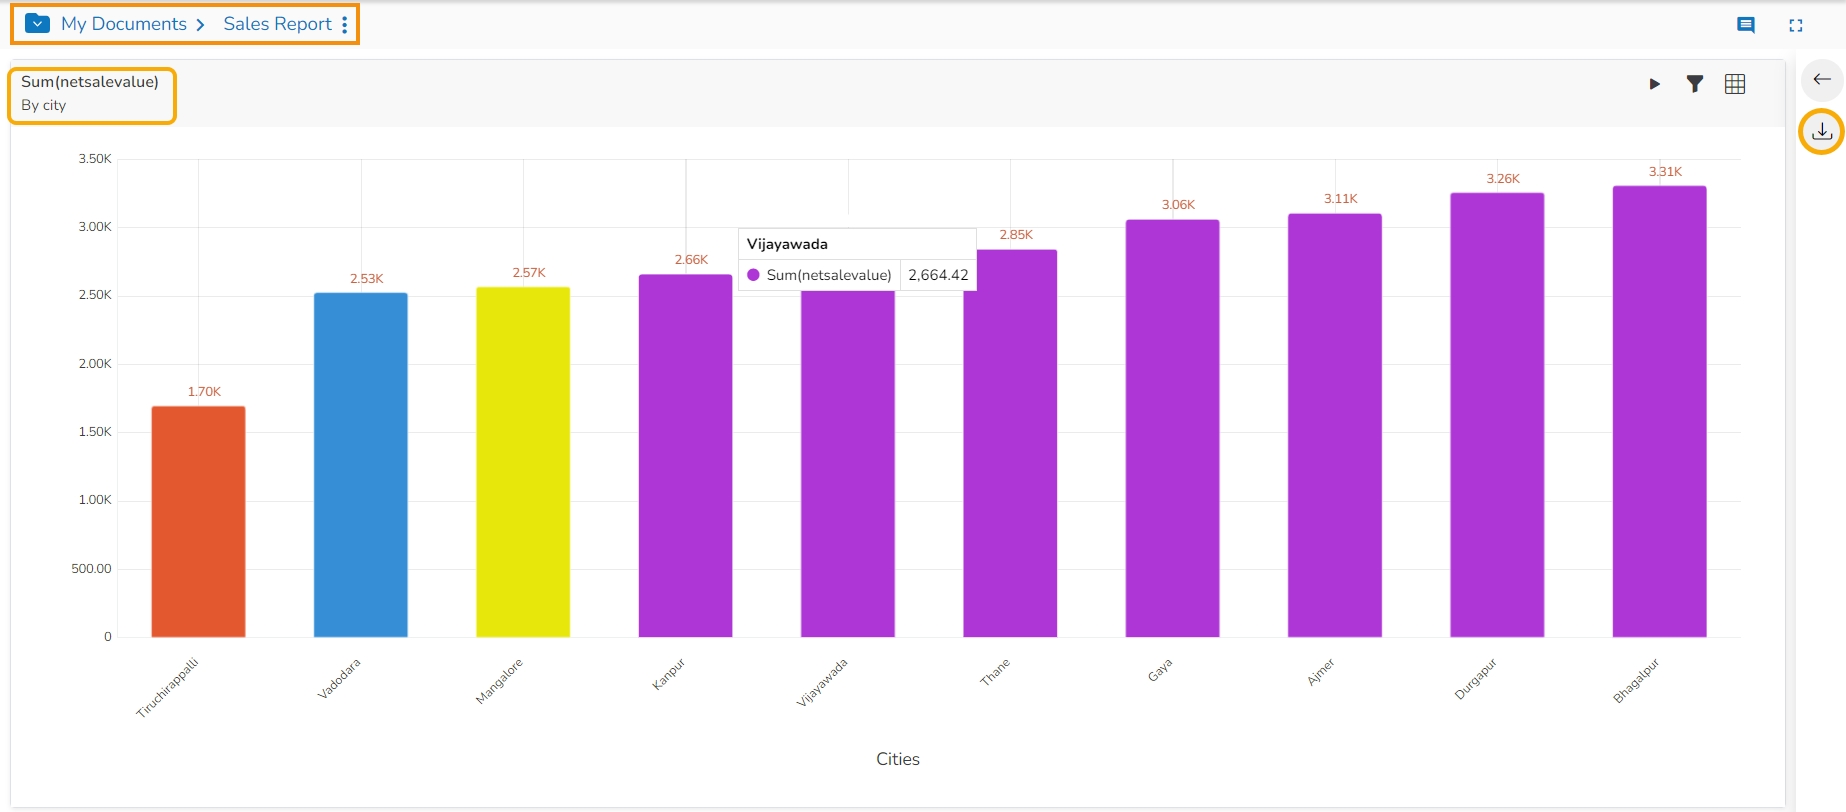
The supported Export option on the Analyze mode for a view is displayed in the following image:
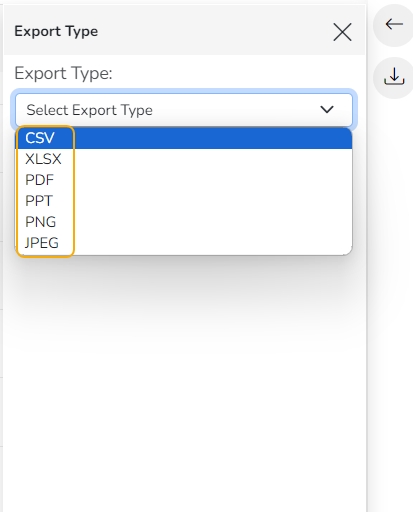
The Export Type window opens. Use the Select Export Type drop-down menu.
The supported Export types for a View are CSV, XLSX, PDF, PPT, PNG, and JPEG.
Please Note:
The Export as JEPG Image and Export as PNG Image options are provided in the Analyze mode for a view.
PDF Export in Tabular Format: The PDF export option for the Data Grid chart now exports the data in a tabular format. This enhancement easily exports and shares their Data Grid chart data in a PDF file.
The user can avail a timeline play for a saved View that contains time value.
The user can access the Timeline play for a saved View from the Report. This feature allows the users to see the data changes over time.
Pre-requisite:
In order to utilize the Timeline Play feature, it's essential to have at least one Time dimension within the chosen Data Store. This time element should be linked to the relevant View during the configuration of Timeline Play.
Check out the below-given walk-through on the Timeline Play functionality.
Steps to apply Timeline Play action:
Navigate to the final screen for a report.
Select a View.
Click the Analyse icon.
The View gets opened in the Analyse mode.
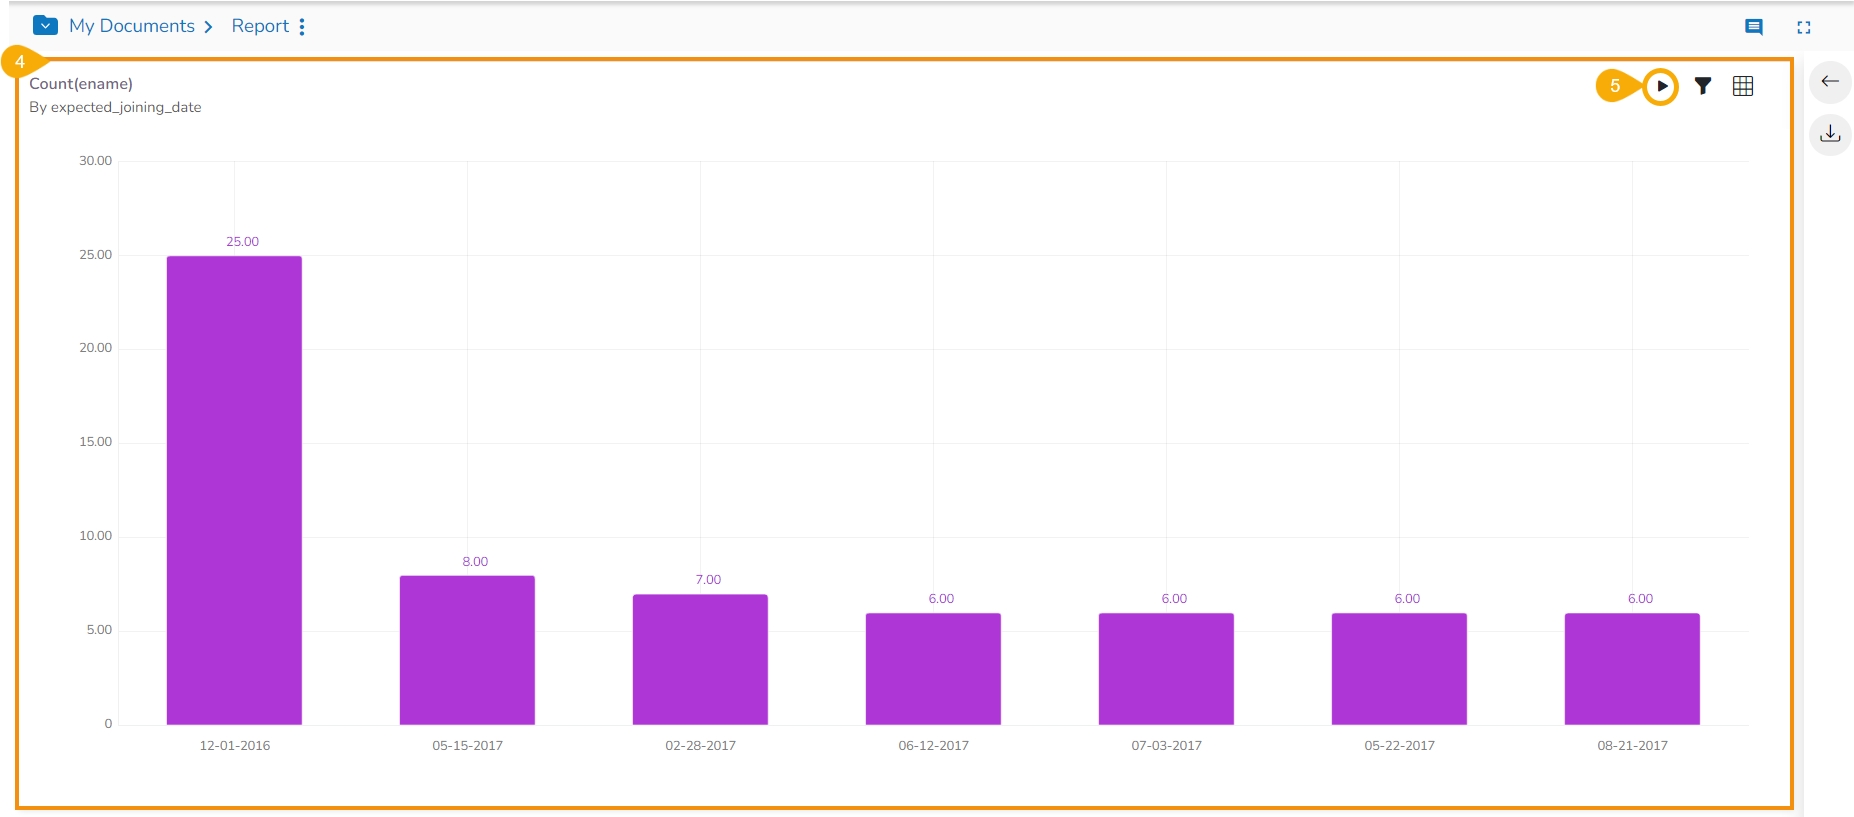
Click the Timeline Play icon.
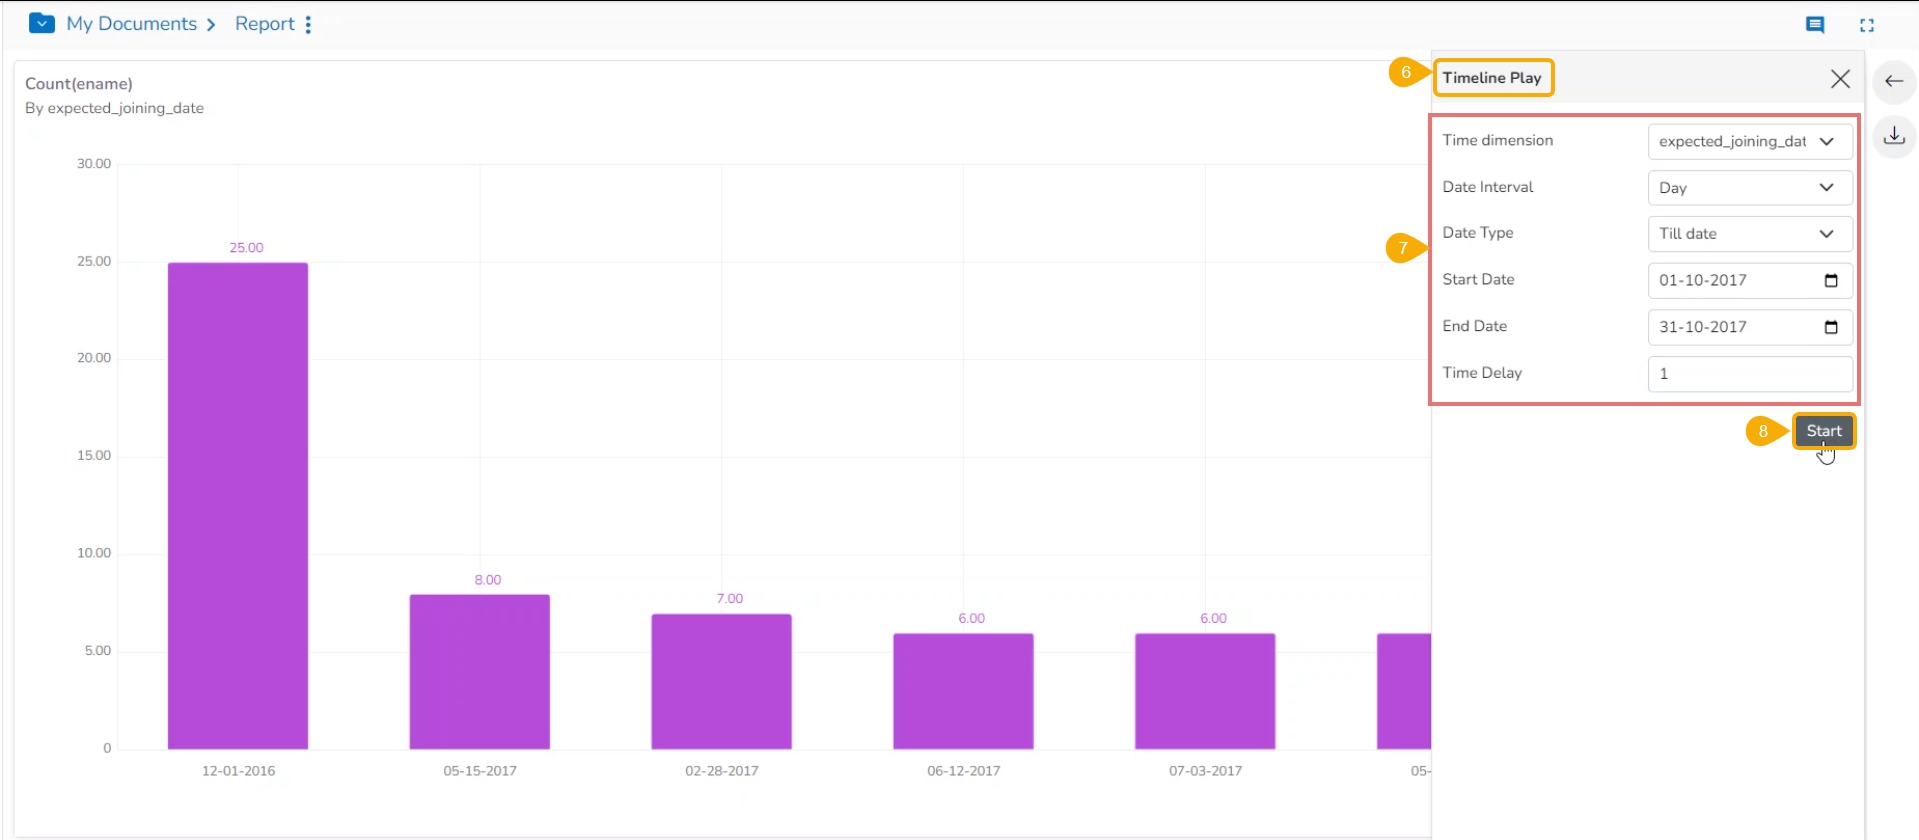
The Timeline Play window opens.
Fill in the required information in the Timeline Play window:
Time Dimension
Date Interval
Date Type
Start Date
End Date
Time Delay
Click the Start option.
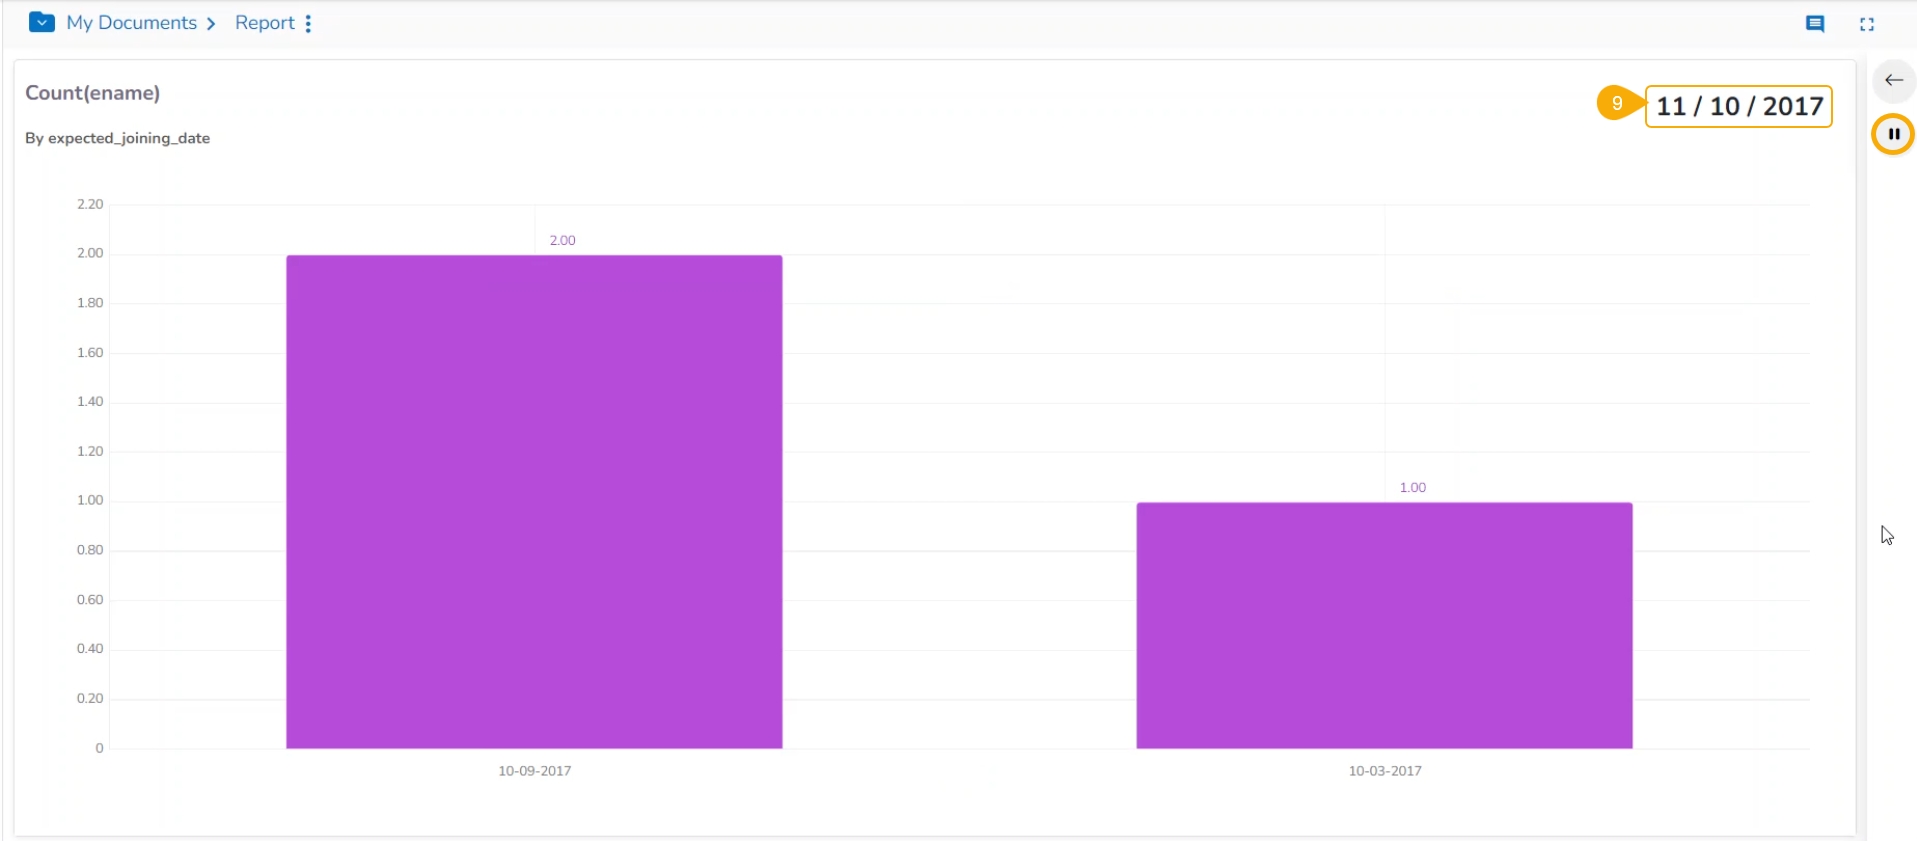
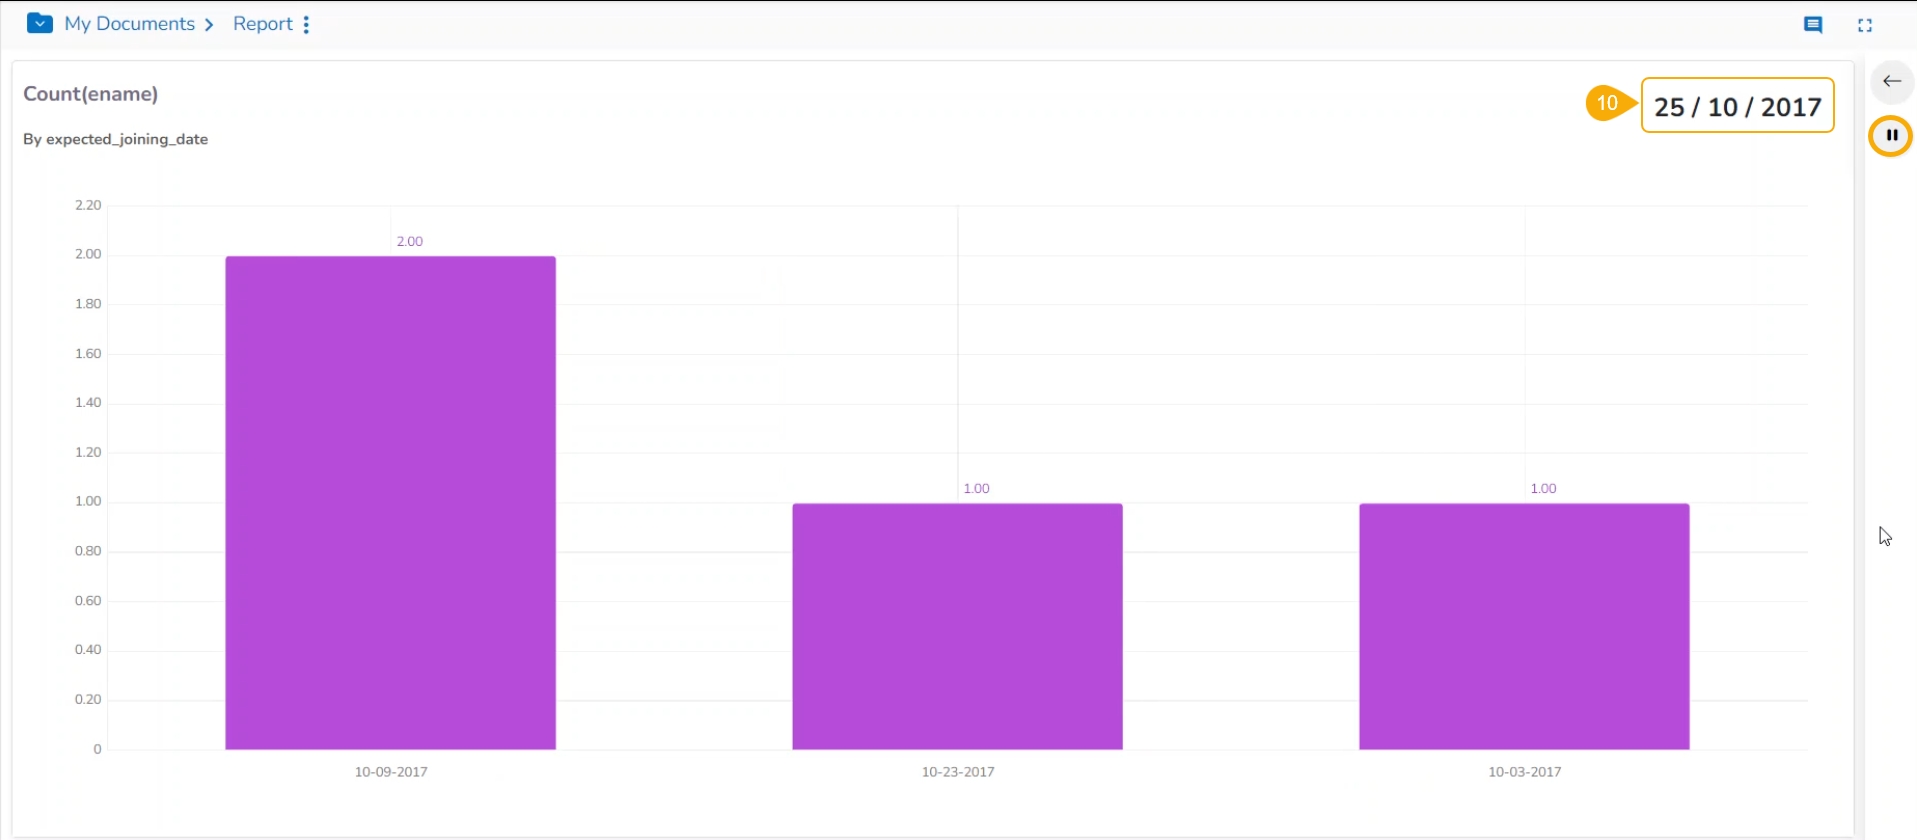
The timeline play is displayed for the selected time. The given images display-wise.
E.g., the below image displays data for the date 11th October 2017.
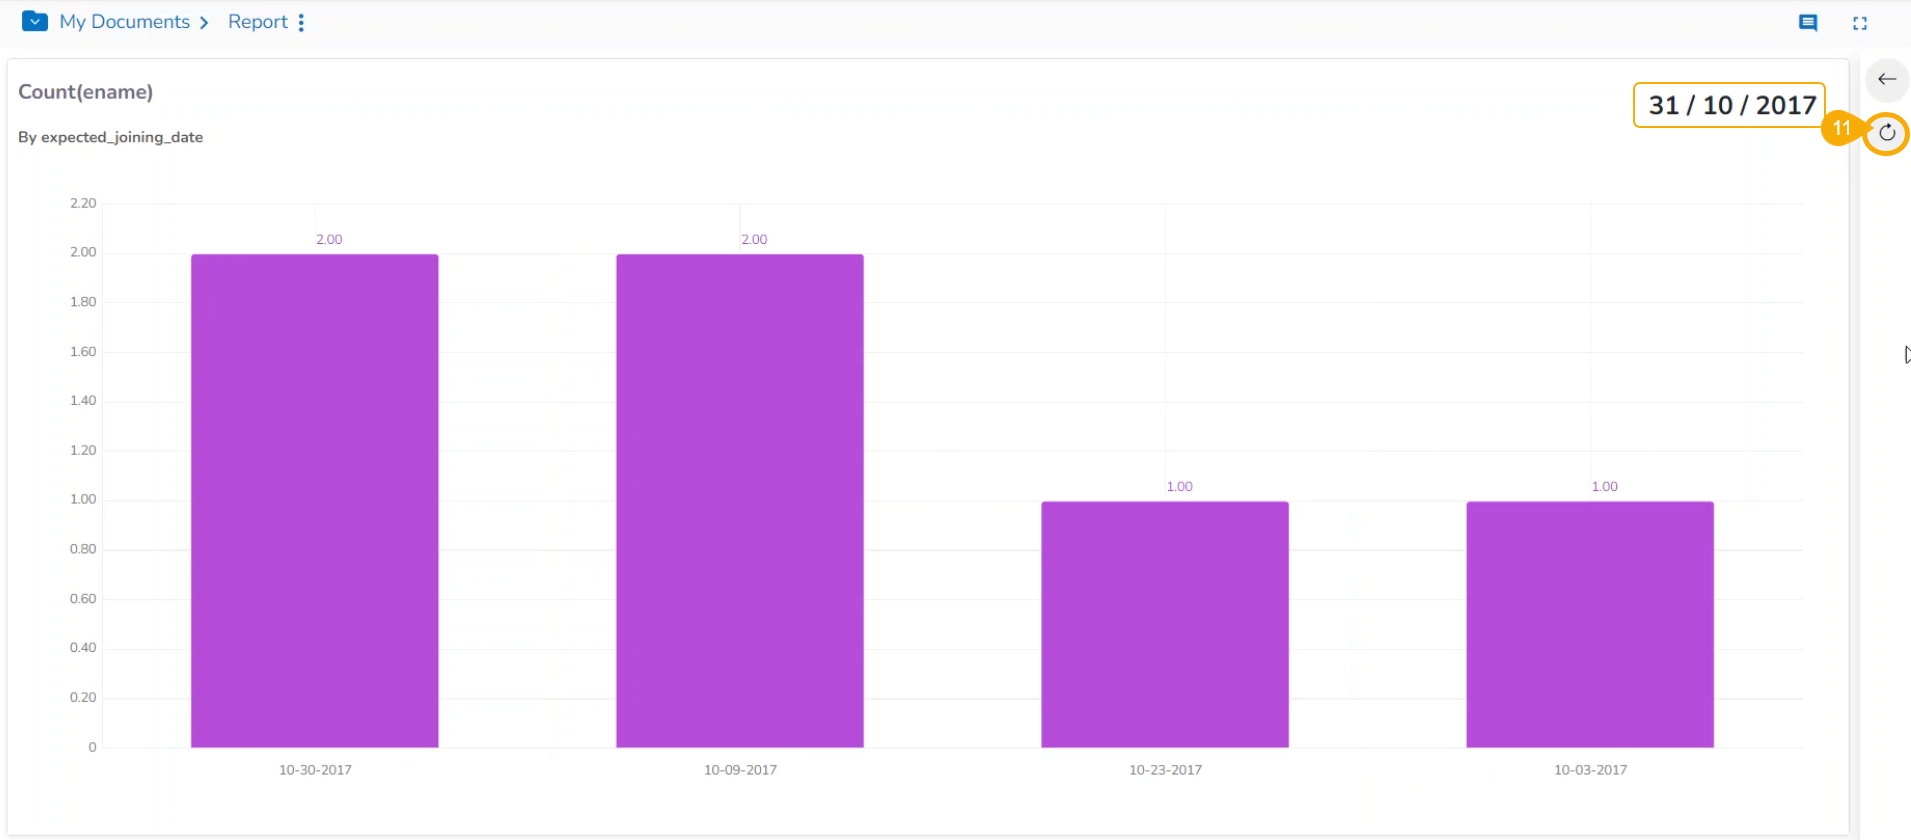
E.g., the following image displays data for the date 25th October 2017.
After all the selected Timeline values get played, the Resume icon gets changed into Replay.
Please Note:
The timeline play can be paused by clicking the Stop icon.
The user can resume the stopped timeline play by clicking the Resume icon.
Once the timeline play is over, a Chart icon (Replay) appears using which the users can replay the timeline play.
You can click on the Close Timeline Play icon to close the Timeline play screen.


