
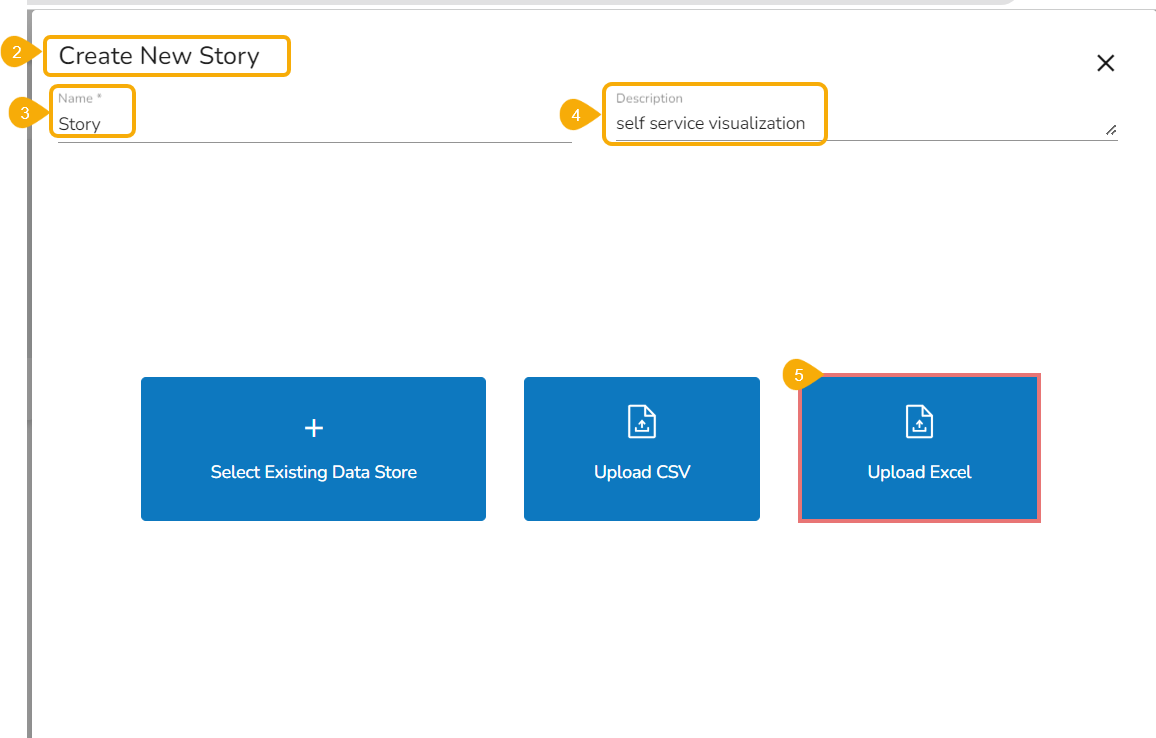
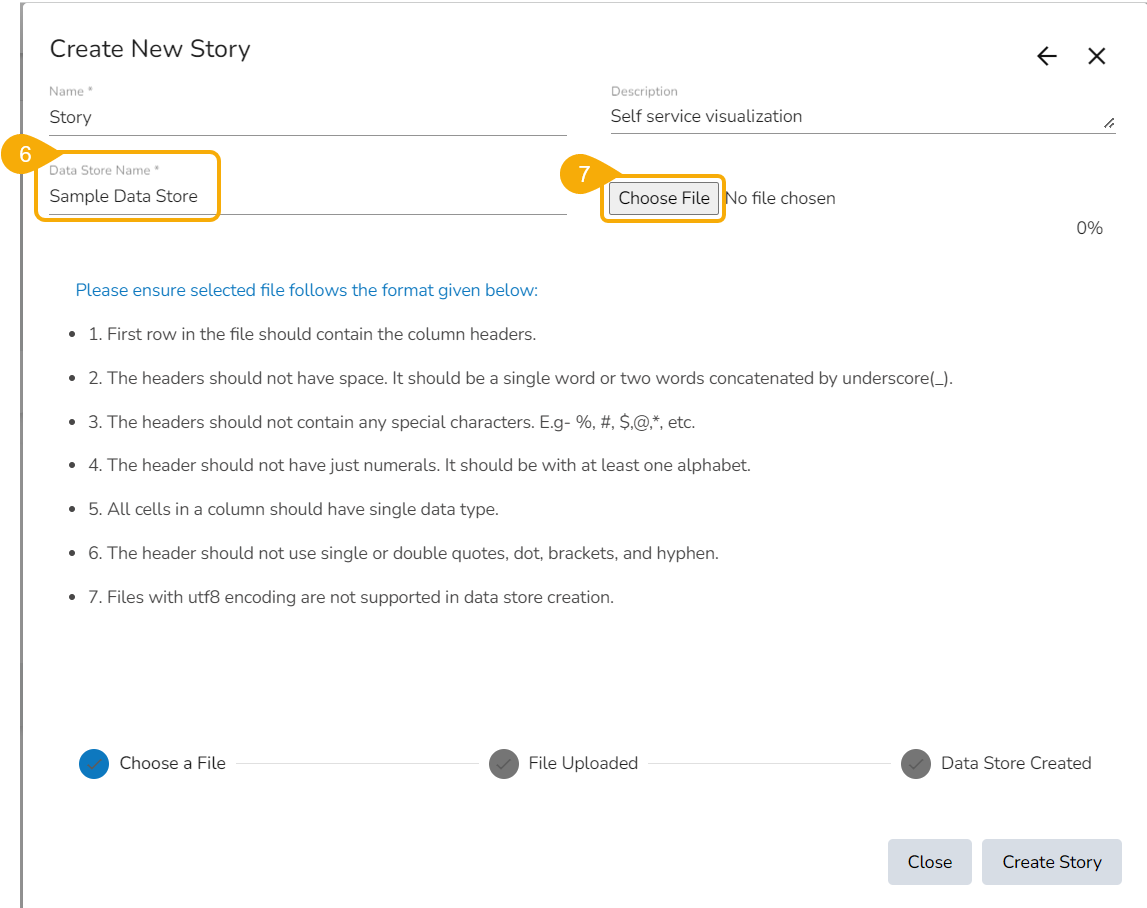
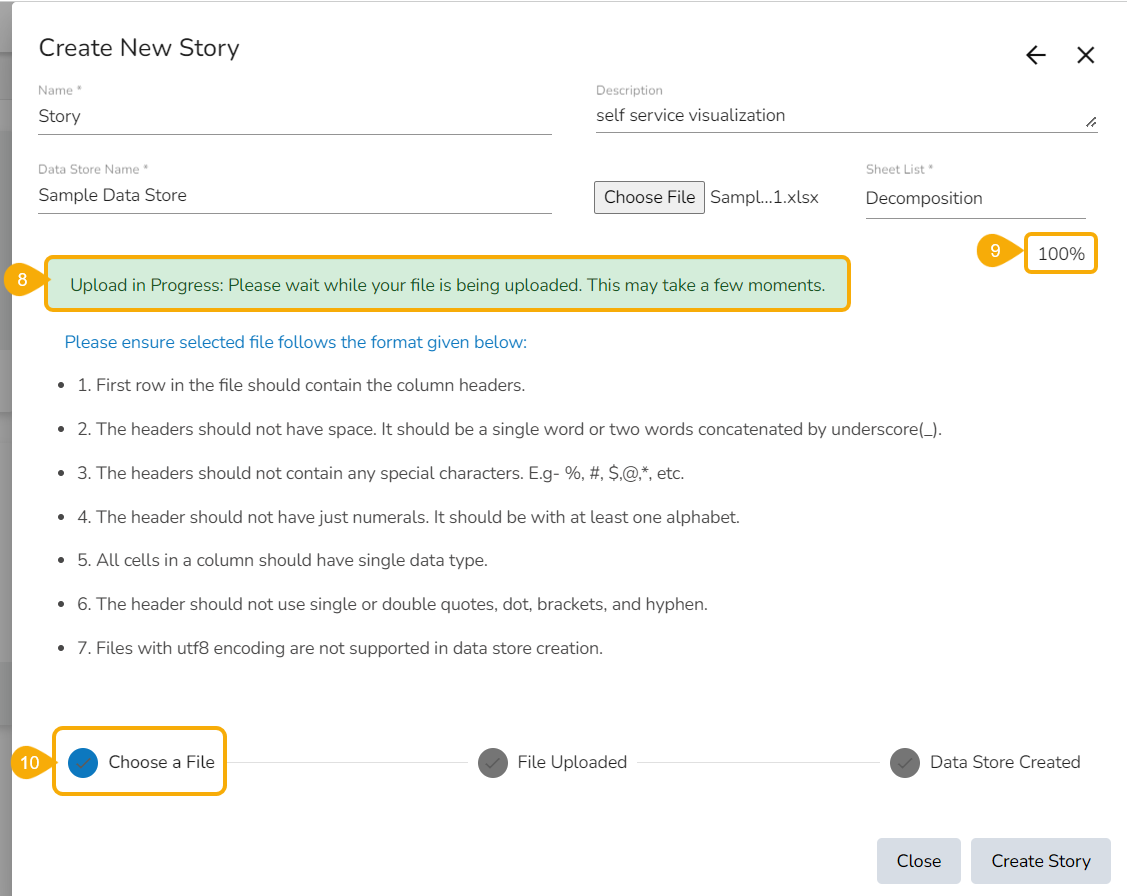
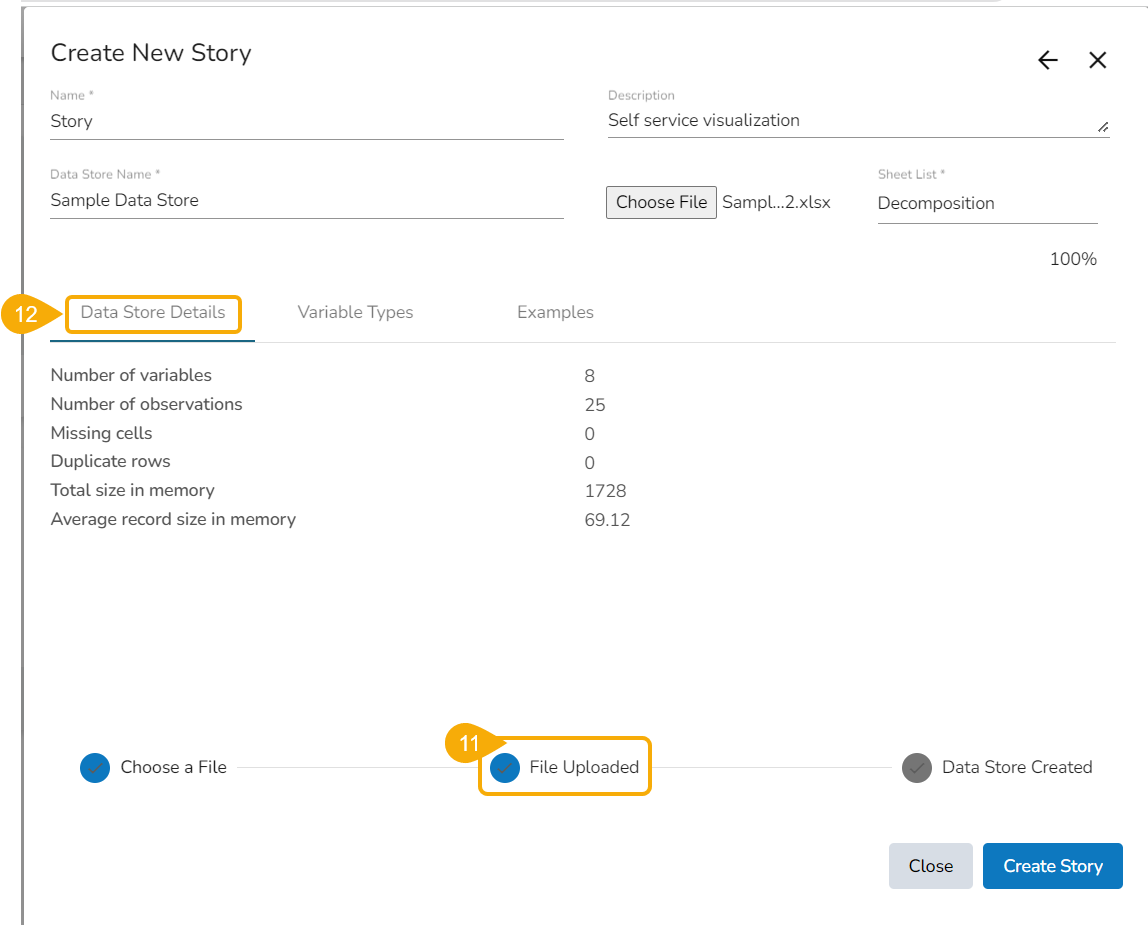
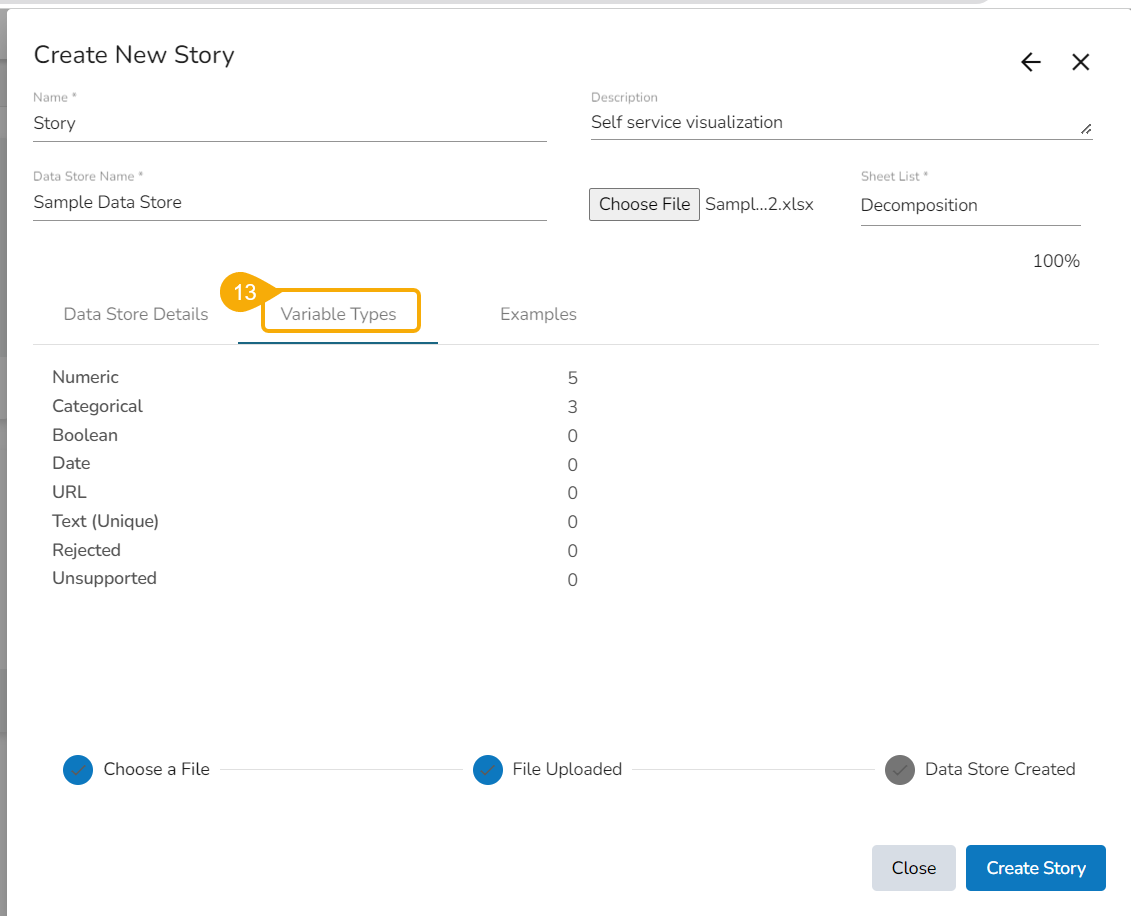
Creating a new Report by Uploading an Excel File
This page describes steps on how upload a CSV file to create a New Story. The user can try this functionality themselves by using the sample file.

PreviousCreating a new Report by Uploading a CSV FileNextCreating a new Report with Data Preparation
Last updated