Loading...
Loading...
Loading...
Loading...
Loading...
Loading...
Loading...
Loading...
Loading...
Steps to develop a data connection based on the Data Sheet.
Check out the given walk-through on how to create a Data Sheet connection under the Designer module and associate it to a charting component.
Click the Data Connectors icon to display all the available data sources.
Click the Create New Connection icon provided next to the Data Sheet connector.
A new connection gets created under the Data Sheet connector type.
The configurable connection-specific fields display on the right side of the page as explained below:
Name: Provide a name for the connection.
Data Sheet: Select a Data Sheet from the drop-down menu.
Load at Start: Enable this option to get up-to-date data / pull the updated data from the data source before loading it into charts.
Timely Refresh: Enable this option to get the refreshed data.
Refresh Interval: Set the time for refresh interval. (This field will appear only when the Timely Refreshed field has been enabled.)
The Field Set tab displays all the fields after establishing the data connection.
This page lists all the enhancements that are released for the Data Sheet.
Please check out the given walk-through to understand the enhancements for Data Sheet.
The following enhancements are provided for Data Sheet as a Data source connection:
Navigate to the Dataset Properties and select a column.
Enable the Frozen Column option from the Properties tab of the Dataset.
The selected column gets frozen and becomes non-editable in the Preview mode.
Add a new row using the Add new Row option, the cell added under the frozen column is editable.
Please Note: Other than the above listed enhancements the below given enhancements are also provided to the Data Sheet data source.
Updated the JExcel DataGrid and JSuites library with the latest stable version (4.6.1).
Able to retrieve more records of data.
Provided the Add Row (+) option to add a new row in the Data Sheet.
The Freeze Column option can be enabled from the Properties tab provided for the Dataset.
Provided pagination within the General Properties option. By enabling the Pagination option from the General properties, the page number gets displayed on the Data Sheet component.
Introduced the Delete Selected Row option with a confirmation message before a row gets deleted in the Preview mode.
The Save option gets updated in red color when something is edited in the datasheet.


Steps to develop a data connection based on the Merged data.
Check out the given walk-through on how to create a data connection based on the multiple merged connections and associate it to a charting component.
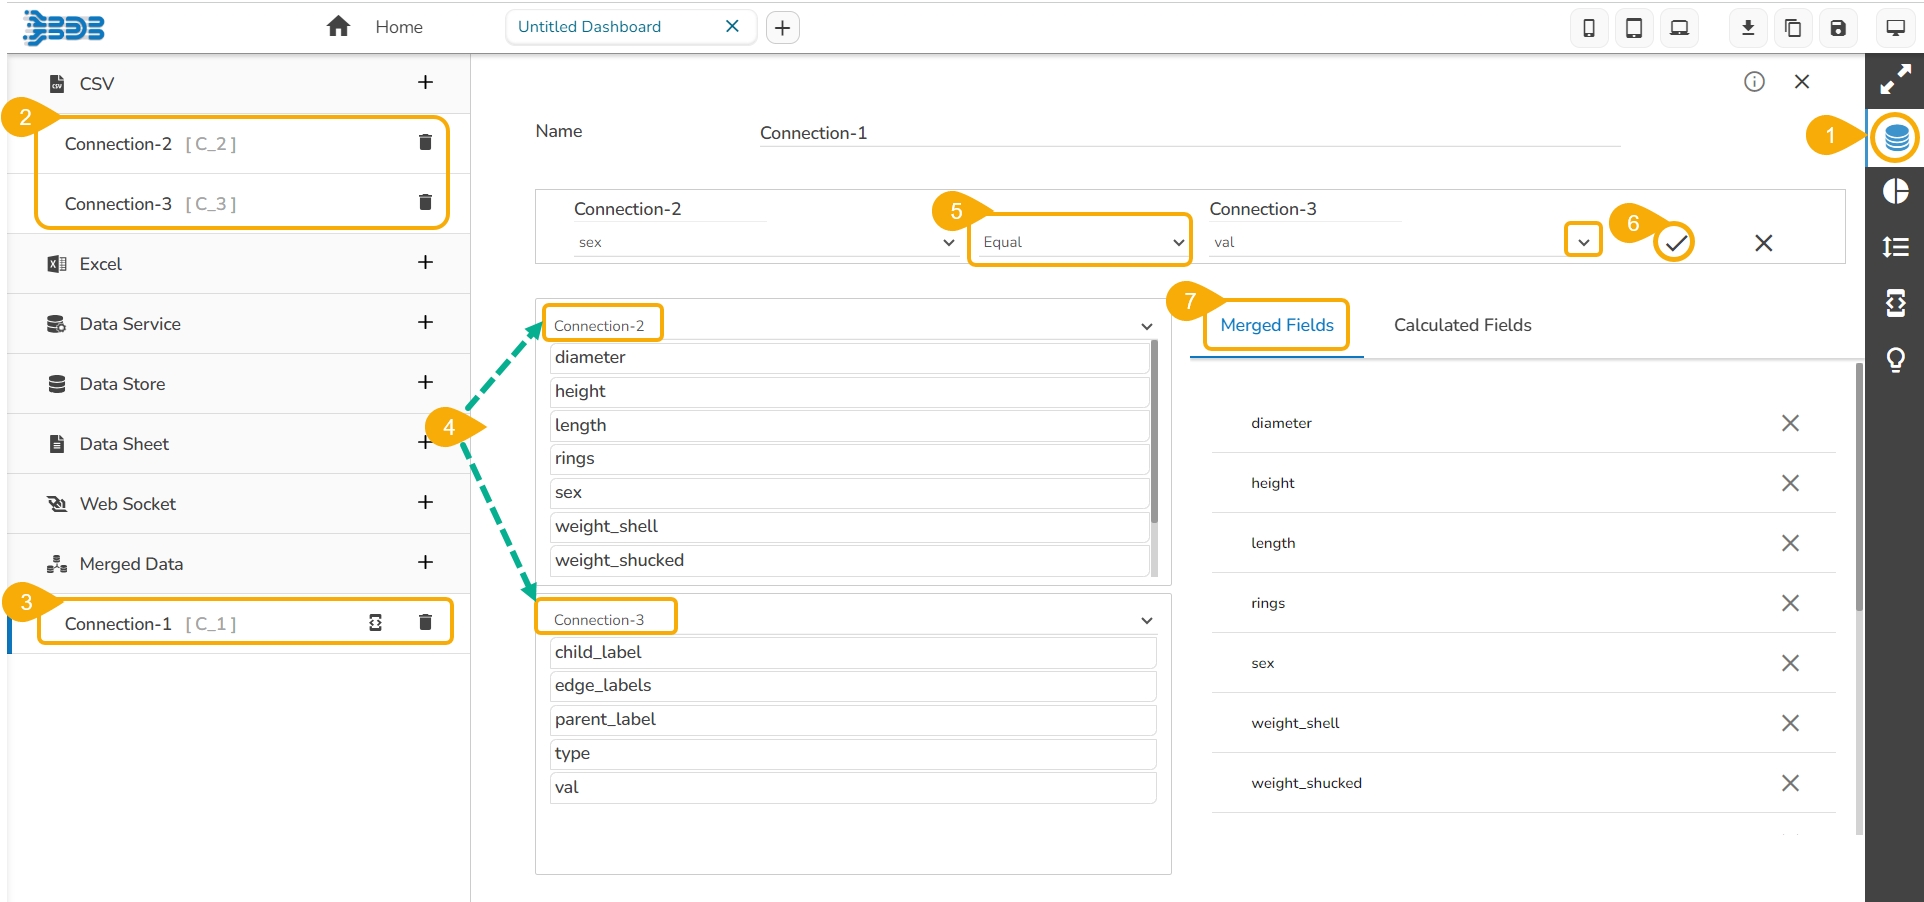
Click the Data Connectors icon.
Create new connections using any data connector option (In this case, Excel connections are created. E.g., Connection-1, Connection-2).
Create a connection under the Merged Data connector. (E.g., Connection-3).
Configure the new connection created for Merged data by mapping the created Excel connections.
Define a condition via the drop-down menu in the Criteria space. (E.g. Equal or Not Equal)
Click the Create Criteria icon.
The Merged Fields displays all the data fields from the merged connections.
After clicking the Create Criteria icon, the created criteria get added to space.
Trigger a script to produce some action on the connection part using the Script on Load icon.
Select the Calculated Fields tab to access Calculated Field Editor and add the calculated fields.
Click the Calculated Fields tab.
Click the Add icon.
The Calculated Field Editor window opens.
Provide a title for the calculated field.
Insert calculation formula inside the Script Editor space.
Click the Create option.
The newly created Calculated field gets added under the Calculated Fields tab.
The users can remove the fields added to the merged data connection using the Remove icon.
This page displays steps involved in establishing various choices of Data Connectors available inside the Designer module.
Steps to develop a data connection based on the Data Service.
Check out the given illustration on how to create a Data Service connection and associate it to a charting component.
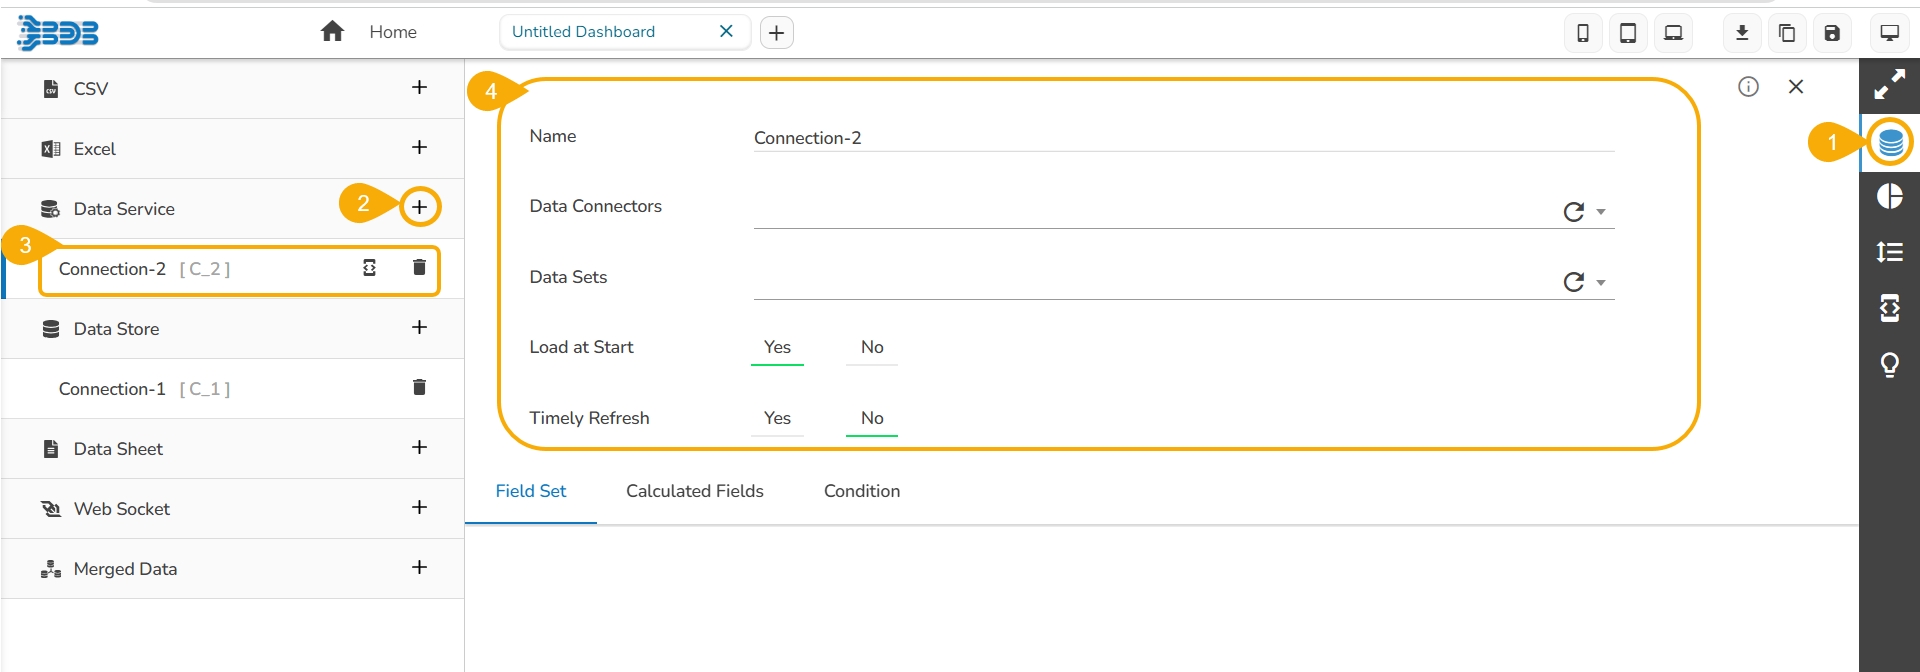
Click the Data Connectors icon to display all the available data sources.
Click the Create New Connection icon provided next to the Data Service connector.
A new connection gets added under the Data Service connector type.
The configurable connection-specific fields display on the right side of the page as explained below:
Name: Name the connection.
Data Connectors: Select a data source from the drop-down menu.
Data Services: Select a data service from the drop-down menu.
Load at Start: Enable this option to get up-to-date data / pull the updated data from the data source before loading it into charts.
Timely Refresh: Enable this option to get the refreshed data.
Refresh Interval: Set the time for refresh interval. (This field appears when the Timely Refresh the field has been enabled.)
The Field Set tab displays all the fields after establishing the data connection.
Please Note:
Click the Reload Data Sources icon to reload the existing data connectors.
Click the Refresh Service icon to refresh all the available data services.
The users can filter the targeted data set using the Condition option.
Steps to develop a data connection based on the Excel file.
Check out the given illustration on how to create an Excel connection and associate it to a charting component.
Click the Data Connectors icon to display all the available data sources.
Click the Create New Connection icon provided next to the Excel option.
A new connection gets added under the Excel connection type.
The connection-specific details get displayed on the right side of the page.
Configure the following information:
Name: Name the connection.
Browse: Click the Browse icon to browse an Excel file.
Sheet Name: Select a specific sheet using the drop-down menu.
Load at Start: Enable this option to get the updated data from the data source before loading it into charts.
The Field Set tab displays all the fields after establishing the data connection.
Select the Condition tab and provide a condition to be applied as a filter on the selected data by putting checkmarks in the given boxes. E.g., The selected Conditions for the Category field is Catalog.
Please Note: Click on the Script on Load icon provided next to the connection to navigate to the Script tab where the user can trigger a script to produce some action on the connection.

Steps to develop a data connection based on the Data Store.
Check out the given walk-through on how to create a Data store connection and associate it to a charting component.
Click the Data Connectors icon to display all the available data sources.
Click the Create New Connection icon provided next to the Data Store connector.
A new connection gets created under the Data Store connector type.
The configurable connection-specific fields display on the right side of the page as explained below:
Name: Provide a name for the connection.
Data Store: Select a datastore from the drop-down menu.
Load at Start: Enable this option to get up-to-date data / pull the updated data from the data source before loading it into charts.
Timely Refresh: Enable this option to get the refreshed data.
Refresh Interval: Set the time for refresh interval. (This field will appear only when the Timely Refreshed field has been enabled.)
The Field Set tab displays all the fields after establishing the data connection.
Please Note:
Click the Refresh Data Stores icon to refresh the selected Data Store data connection.
The users can filter the targeted data set using the Condition tab.


Steps to develop a data connection based on the WebSocket.
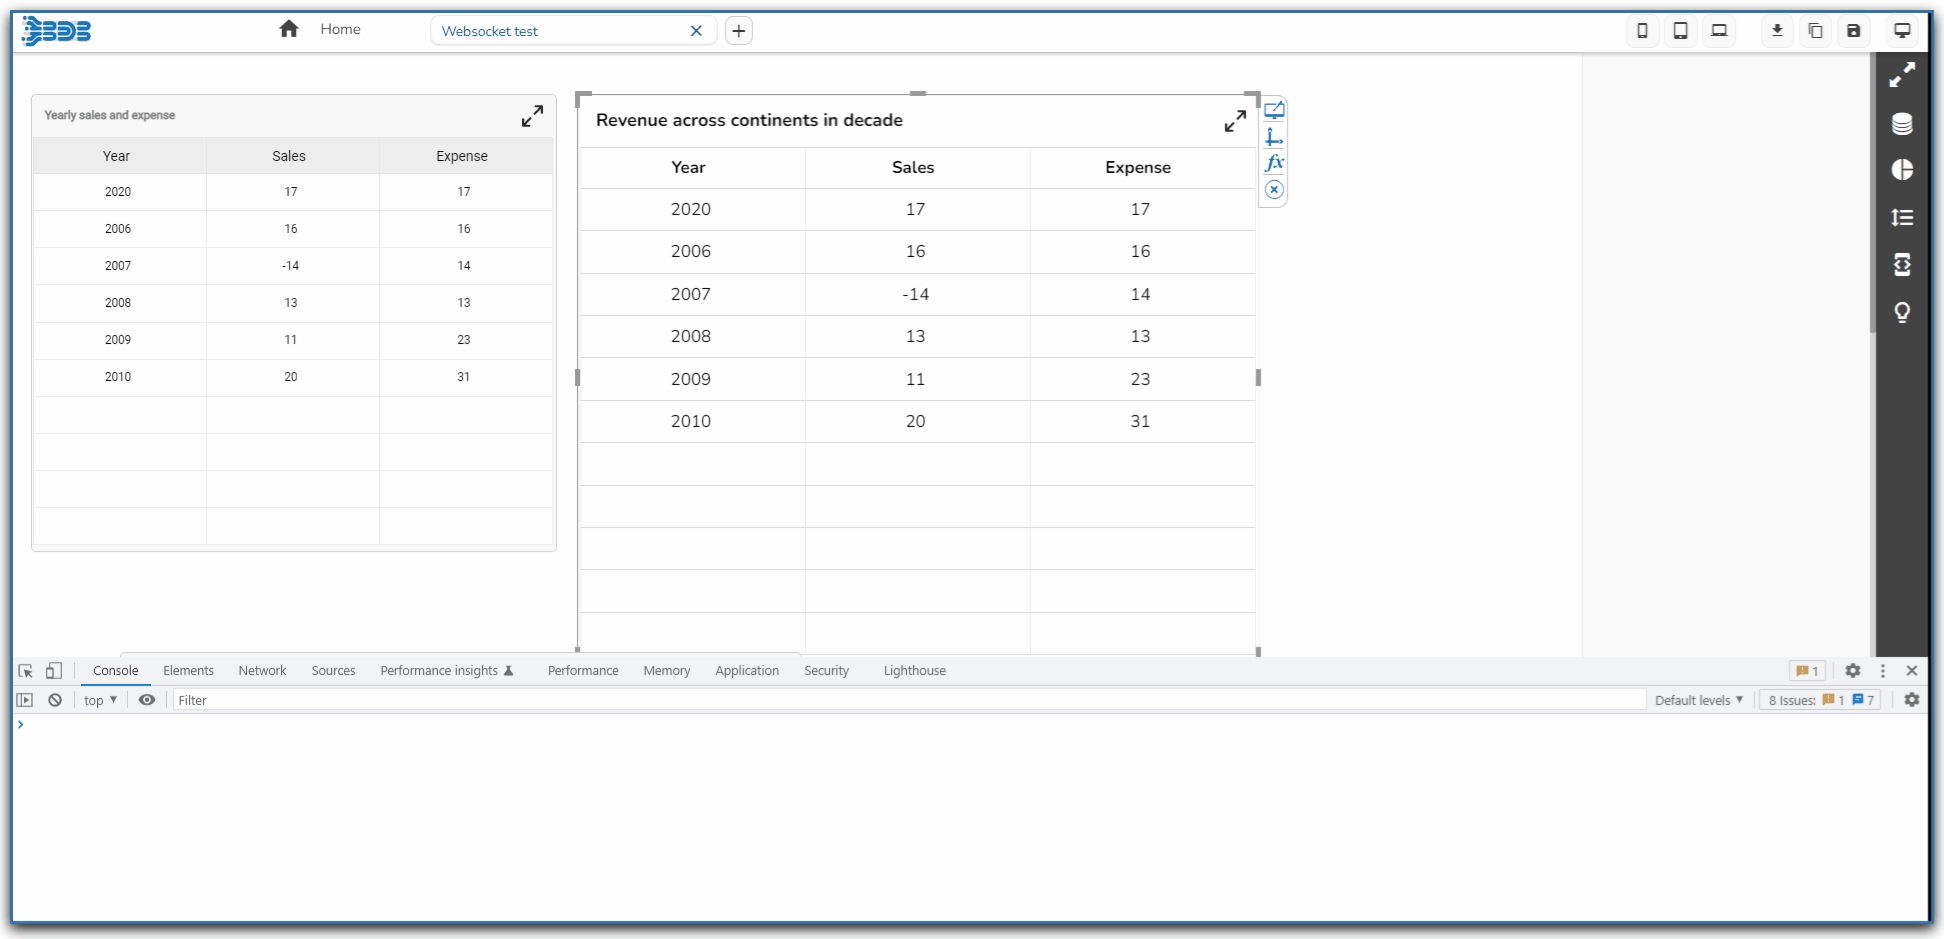
Check out the given walk-through on how to establish a WebSocket Connection using the Designer module.
Click the Data Connectors icon.
Click the Create New Connection icon provided next to the WebSocket connector.
A new connection gets created under the Web Socket connector type.
The configurable connection-specific fields display on the right side of the page as explained below:
Name: Provide a name for the connection
URL: Enter a URL link
guid: Provide the guid.
Ingestion ID: Provide the ingestion id.
Ingestion Secret: Provide the ingestion secret key.
Load at Start: Enable this option to get up-to-date data / pull the updated data from the data source before loading it into charts.
The WebSocket connection gets established.


Steps to develop a data connection based on the CSV file.
Check out the given walk-through on how to create the CSV data connection and associated it with a charting component.
Please Note: Click the Data Connector icon provided on the right side of the canvas, and view the database connectivity options.
Click the Data Connectors icon to display all the available data connector types.
Click the Create New Connection icon provided next to the CSV option.
A new connection gets added under the CSV connection type.
Click the connection to display the connection-specific details.
Configure the following information:
Name: Name the connection.
Browse: Click the Browse icon to browse a CSV file.
Load at Start: Enable this option to get the updated data from the data source before loading it into charts.
The Field Set tab displays all the fields after establishing the data connection.
Select the Condition tab.
Provide a condition to be applied as a filter on the selected data by putting a checkmark in the given box.
E.g., As displayed in the following image, specific date has been provided under the Conditions column for the Timeline so, data for the given date will be taken.
The users can add a calculated field by using this tab.
Navigate to the Data Connectors page.
Create a connection by selecting a specific Data Connector type.
Connect to the desired data source to access the available fields.
Click the Calculated Fields tab.
The Calculated Field Editor dialog box opens.
Name: Provide a name for the calculated field
Script Editor: Use the Script Editor space to insert the desired calculation formula using the rule given below.
Click the Create option to create the calculated field.
Please Note:
Enclose field names in square brackets: [total_sales]/[number_of_items]
Enclose global variable in curly braces: {bar1.profit}*2+[profit_jan]
The newly created calculated field gets added under the Calculated Fields tab.
The users can apply their modifications or preferences at the connection level using the Scripting window to get the modified data.
Navigate to the Data Connectors page.
Select a Data Connector type.
Create a new Connection and configure it.
Select the Script on Load icon provided next to the connection.
The Script tab appears to trigger a script to produce some action on the data connection.
The user can also use a script for the Dashboard, which can be accessed via the Components tab.
The user can search the script for the Dashboard, which can be accessed via the Script tab.
Click the Help icon from the Script on the Load page.
The Scripting Help tab opens with some predefined scripts.
Click the Advanced Scripting option to display the chart-wise advanced scripts.


