
Loading...
Loading...
Loading...
Loading...
Loading...
Loading...
Loading...
Loading...
Loading...
Loading...
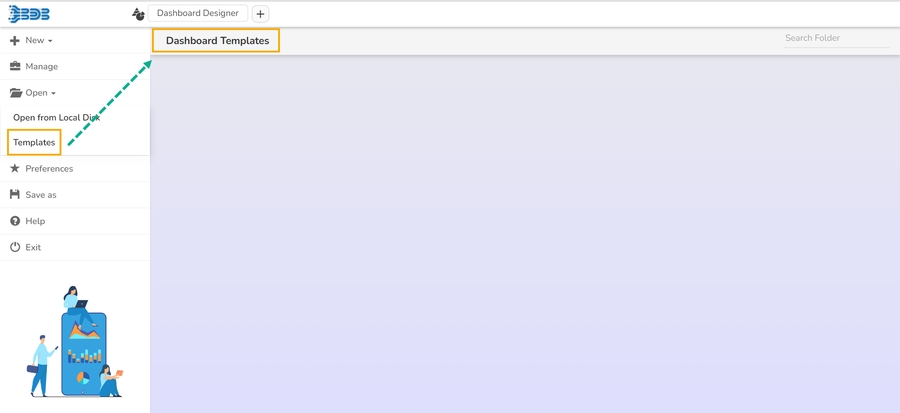
The Designer Homepage contains a menu panel on the left side. This section aims to explains the options provided under that panel.
The user gets guided across various important sections of the Designer plugin. The tour begins from the Designer Homepage.
Click the Take a tour option provided on the top right side of the Designer homepage.
A new dialog box opens initiating the landing page tour.
Click the Next option to move ahead in the guided tour.
Click the Prev option to go back to the guided tour.
Click the End Tour option if you want to end the tour at any given point (The End Tour option will get highlighted by default at the end of the guided tour).
It is the landing page for the Designer module.
The Designer homepage displays a list of tasks in the left panel that users can perform on a dashboard.
The Designer Homepage also contains Guided Tour.
Navigate to the Designer homepage.
Click the Open option from the given options.
The Open from Local Disk appears.
The user gets directed to open the downloaded files (.bvzx) from the local disk.
The selected dashboard (.bvzx file) opens inside the designer workspace.
Navigate to the Designer homepage.
Open the Manage option.
Open an existing dashboard from the list of available dashboards (You can find the list of dashboards inside a Workspace).
Click the Save As option from the left panel.
The Save As window appears to confirm the action.
The original dashboard name appears with the “Copy_Of” prefix (the users can edit the name as per their wish).
Select a workspace from the drop-down menu.
A copy of the selected dashboard gets saved in the chosen workspace.
Navigate to the Designer homepage.
Click the Exit option.
If work is not saved, the user gets an option while closing to leave or cancel the action of exit. Select the Cancel option if you require to save the work, or else choose Leave to close the designer.
The user gets directed to the Platform homepage.
Click the Save option.
This option directs users to create a new workspace or dashboard.
Navigate to the Designer homepage.
Click the New drop-down menu.
The user gets two options:
Workspace: Clicking this option redirect the users to create a new workspace/place holder for the dashboard.
Dashboard: By clicking this option, the users get redirected to the Designer Canvass to create a new dashboard.

This option helps to manage the created Workspaces or Dashboards inside a user account.
Navigate to the Designer homepage.
Click the Manage option.
The user gets directed to manage the following tasks for a Workspace or Dashboard:
Search in Workspaces: Searches for a specific Workspace.
Reload Workspaces: Reloads all the Workspaces.
New Workspace: Adds a new Workspace.
To access the options, the users need to select a dashboard from an existing workspace as displayed in the following image:
Search: Searches for a Dashboard
GIT Export: Export a dashboard to GIT and get a pushed version from the GIT repository (Push to VCS and Pull from VCS)
Open in Designer: Opens the dashboard in Designer to Edit or modify
The users get the following options while clicking the More Actions icon provided for a Dashboard.
Preview the dashboard
Export to Local Disk
Rename the Dashboard
Delete Dashboard


Remove: Removes the selected workspace from the list and move to the Trash Workspace.
Share: Shares the selected workspace to a user or user group. The rights to access an already shared workspace can be excluded by using the same option.
Empty the Trash: Removes all the workspaces from the Trash workspace.
Remove: Deletes the Dashboard
Actions: Applies the various actions on a dashboard
Move the Dashboard from one Workspace to another Workspace
The Preferences for a dashboard canvass appear.
Set the desired preferences either by enabling it through a checkmark or selecting it from the provided menus.
Click the Save option.
The selected preferences get applied to the dashboard canvass.
The available preferences for a dashboard are as described below:
Property Name
Description
Show Grid Lines
Enable this option to display grid lines in the designer area
Snap to Grid Size
Select an option to display the grid size (None/5/10/15)
Notify on Success
Enable this option to get a notification of success
Block Notification
Enable this option to block the notification message
Show Settings Button
Enable this option to display the toolbar when any component is selected


The Help content gets displayed to understand the Designer plugin.
Selection Color
Redirects to select a color to display when any component when dragged to the canvass
Selection Thickness
Set (increase/decrease) the thickness of the component border
Show Border
Enable this option to display a border on the dashboard
Border Color
Redirects to select a border color to display in the Dashboard
Background Color
Redirects to select a color to display in the dashboard background
Hide Shadow
Enable this option to hide the shadow of the components
Sync Component Property
Enable this option to synchronize the component property
Enable Multiple Drag
Enable this option to select multiple charts and then move them together in the dashboard
Fixed Dimension
Enable this option to set the fixed height & width of the dashboard


