Loading...
Loading...
Loading...
Loading...
Loading...
Loading...
Loading...
Loading...
Loading...
Loading...
Loading...
Loading...
Loading...
Go through the given illustration on opening a dashboard from the Manage options.
The users can open the desired dashboard into the designer workspace once they have created and saved it to a workspace.
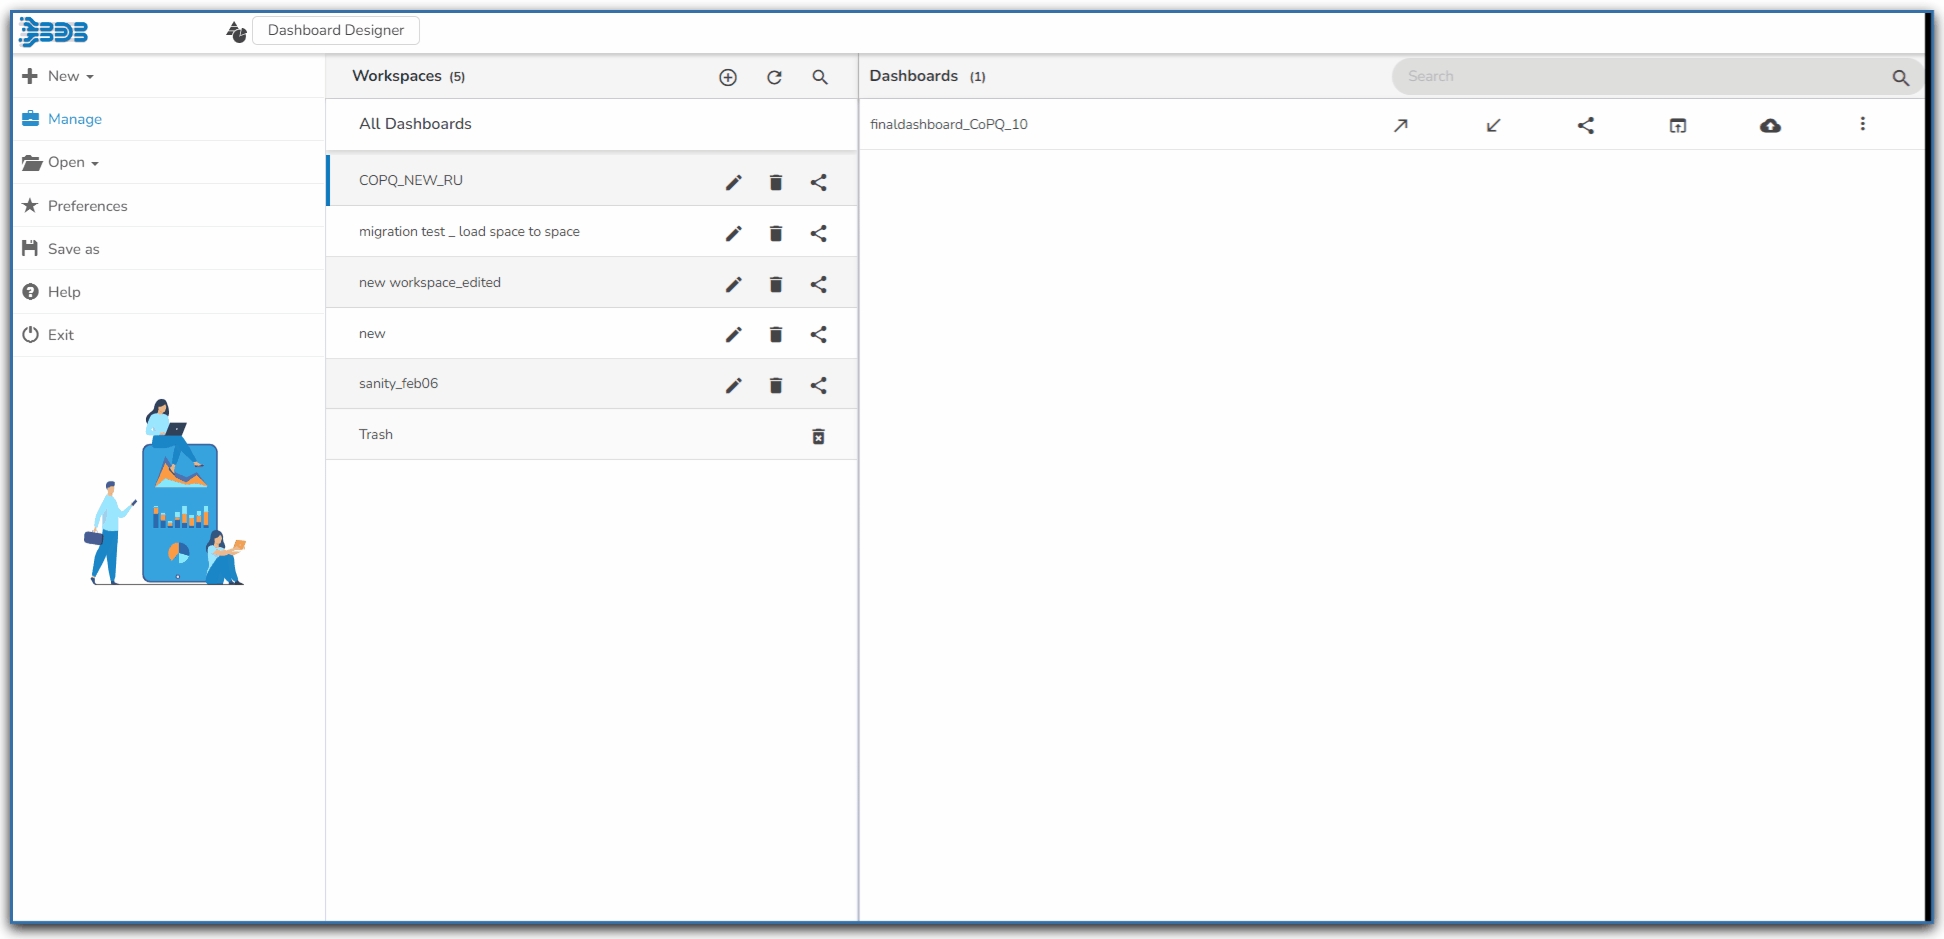
Click the Manage option on the Designer homepage.
Select and click on a workspace from the list of Workspaces.
Select a Dashboard from the list of all the saved dashboards under the selected workspace.
Click the Open in Designer icon.
The selected dashboard opens in the designer workspace.
Please Note: The users can also open a dashboard in the designer canvas by using double clicks on the dashboard name from the list of saved dashboards.
The Actions menu contains some more options like Preview, Export to Local Disk, Rename and Move to that can be applied on the dashboards Action.
The page focuses on the various options provided for a saved dashboard while using the Manage option.
Manage and share your work with others. This section explains how to edit, save, and publish the dashboards created by users.
Generally created dashboards are saved under a workspace. Based on the requirement, the users can edit the dashboards by adding some modifications and saving them to the disk. This tutorial explains how to edit, open, and save dashboards.
The created and saved dashboards can be shared among the users for a purpose. There are options provided to move and publish dashboards.
The below given description helps you how to access those options in the Designer:
Navigate to the Designer homepage.
Click the Manage option.
A list of Workspaces gets displayed.
Choose a workspace.
A list of all the saved dashboards under the selected workspace gets displayed.
Options provided next to a dashboard name can be used to manage or move that dashboard.
Options provided to a Dashboard:
Option
Name
Description
Push To VCS
To push the dashboard to the git version control
Pull from VCS
To Pull the version dashboard from VCS
Share Dashboard
To share the dashboard file with the other user
Open in Designer
To open a created dashboard in the designer canvas.
Publish to Portal
To publish a created dashboard onto the portal.
More Actions
To provide more actions to be applied to the selected dashboard.
Options provided under the More Actions:
Option
Name
Description
Preview
Opens preview for the selected dashboard
Export to Local Disk
Exports the dashboard to a local disk
Rename
Renames the dashboard
Delete
Removes the dashboard
Move To
Moves the dashboard
The below-given illustration will help you to understand how to publish a Dashboard.
Dashboards need to be published for end-users to access them. This section explains the steps to publish dashboards.
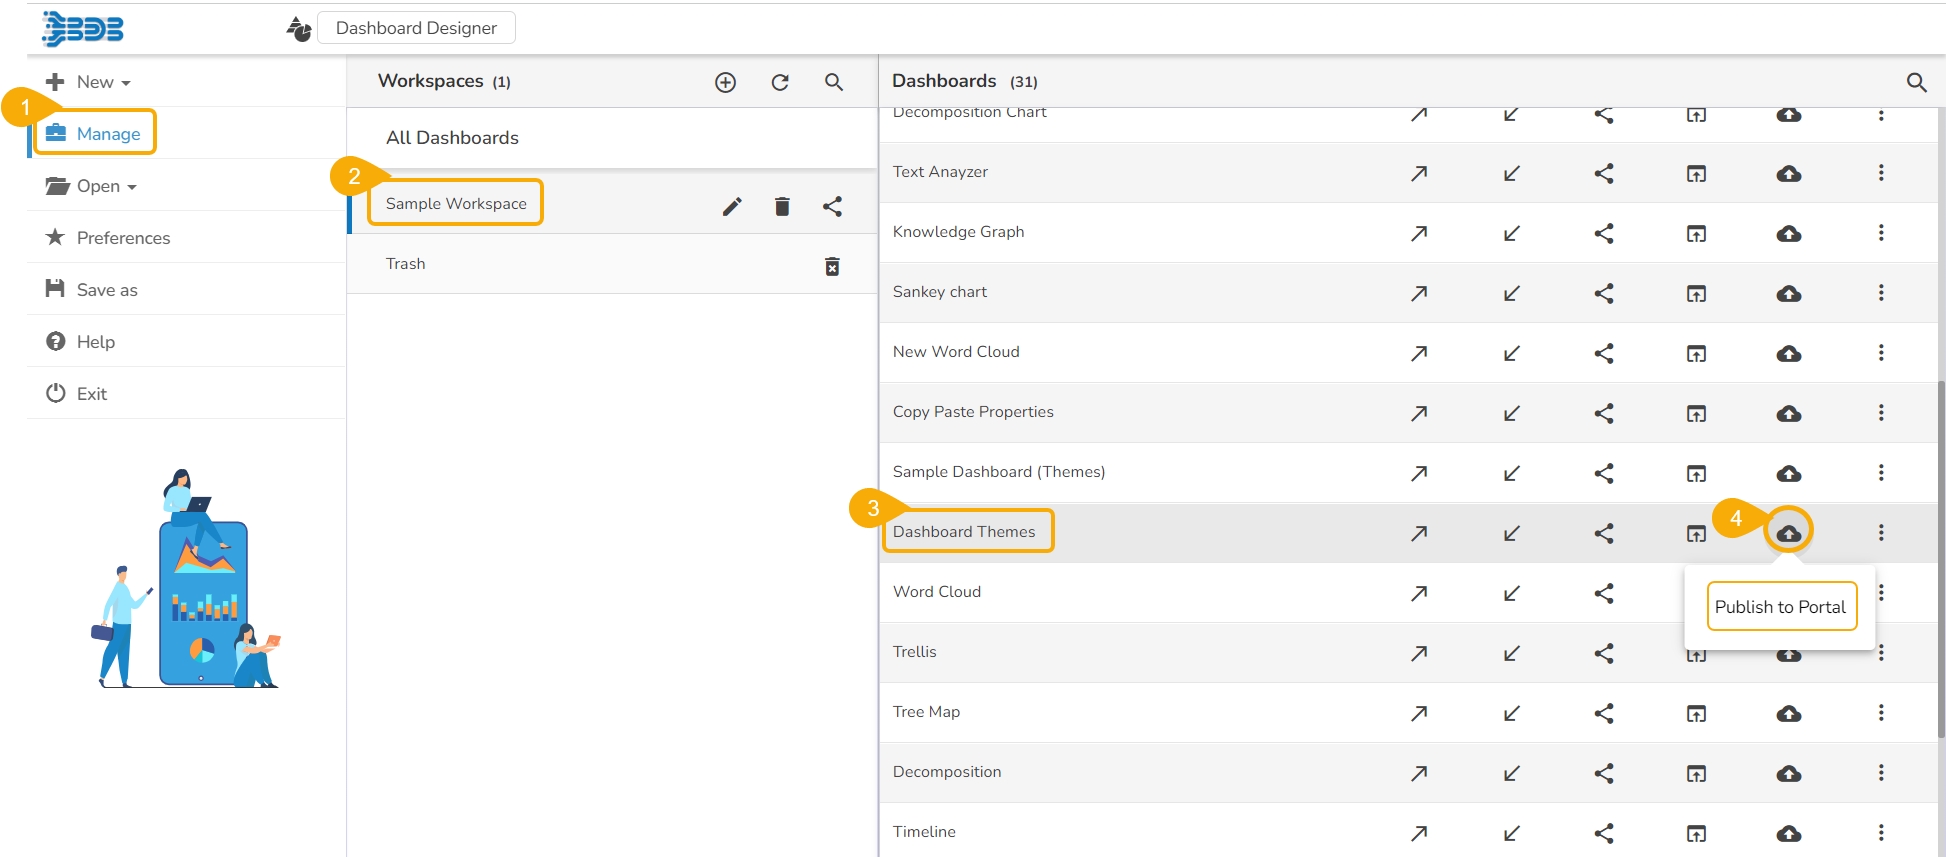
Click the Manage option on the Designer homepage.
Select and click on a workspace from the list of Workspaces.
Select a Dashboard from the list of the saved dashboards under the selected workspace.
Click the Publish to Portal icon.
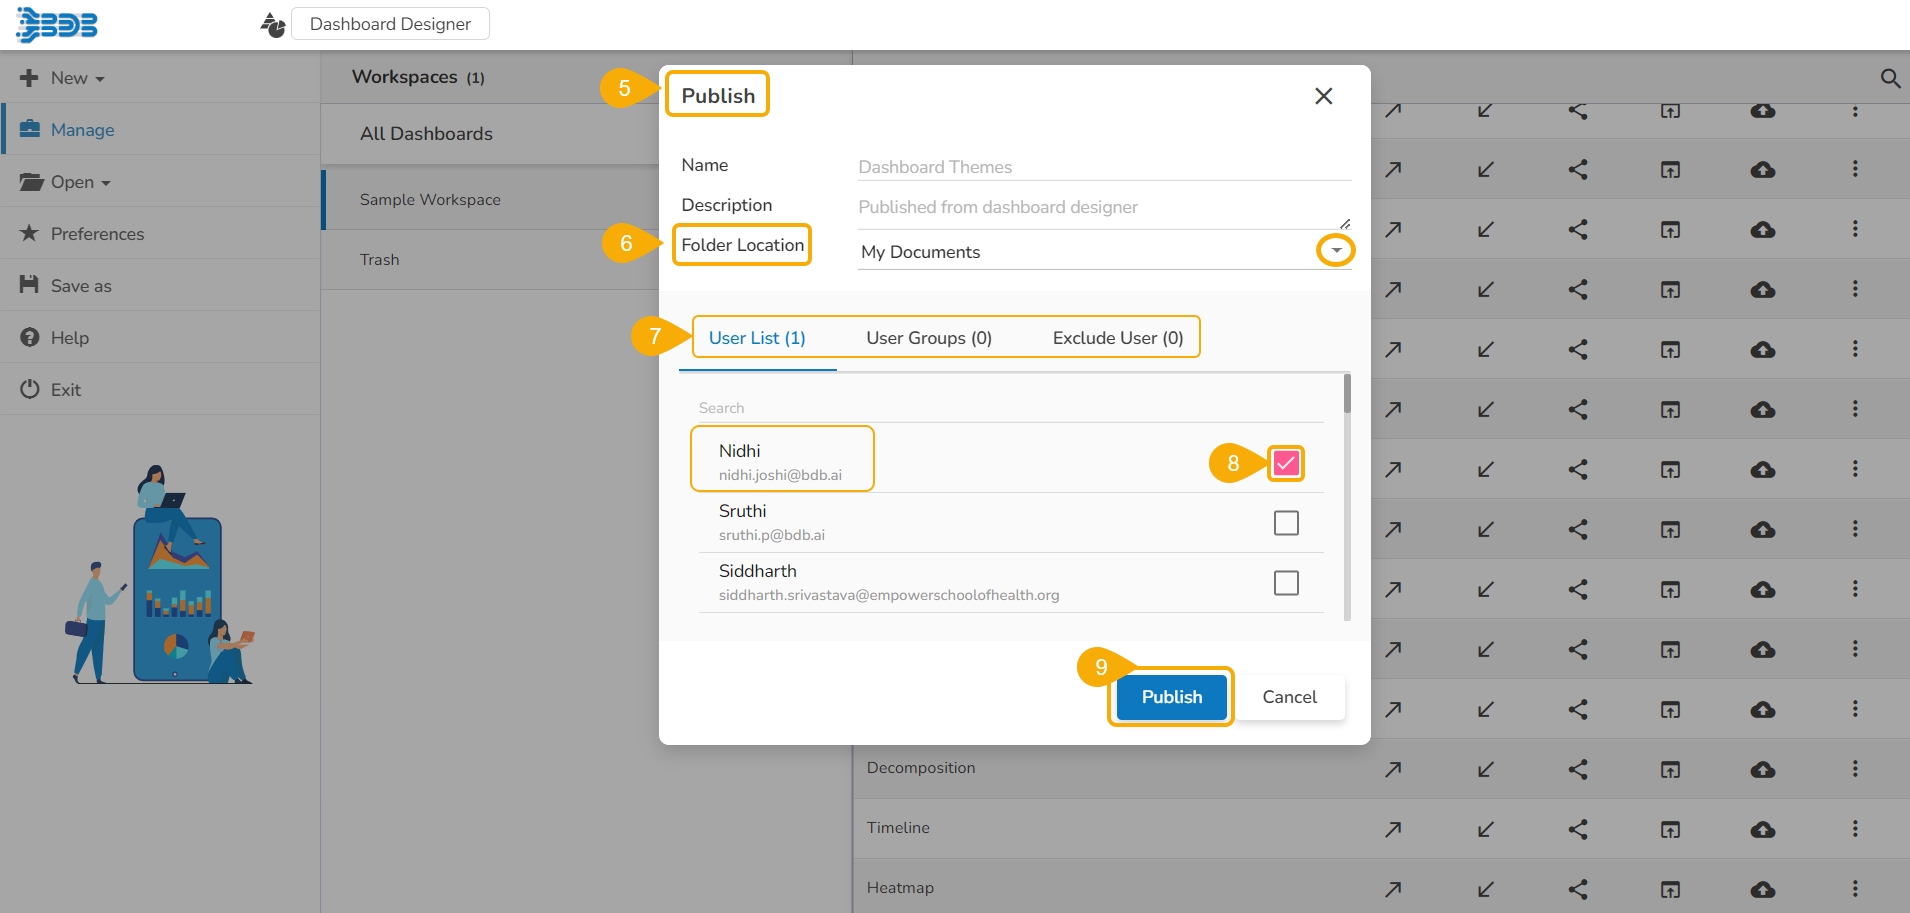
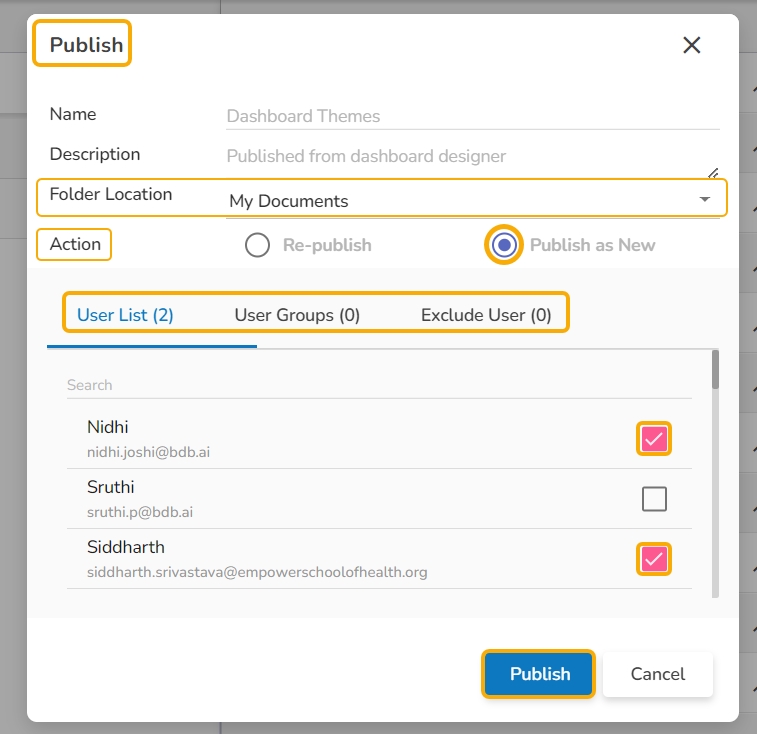
The Publish dialog box appears to assure the action with the dashboard name and description.
Select Folder Location using the drop-down icon.
The supported folders are My Documents and Public Documents.
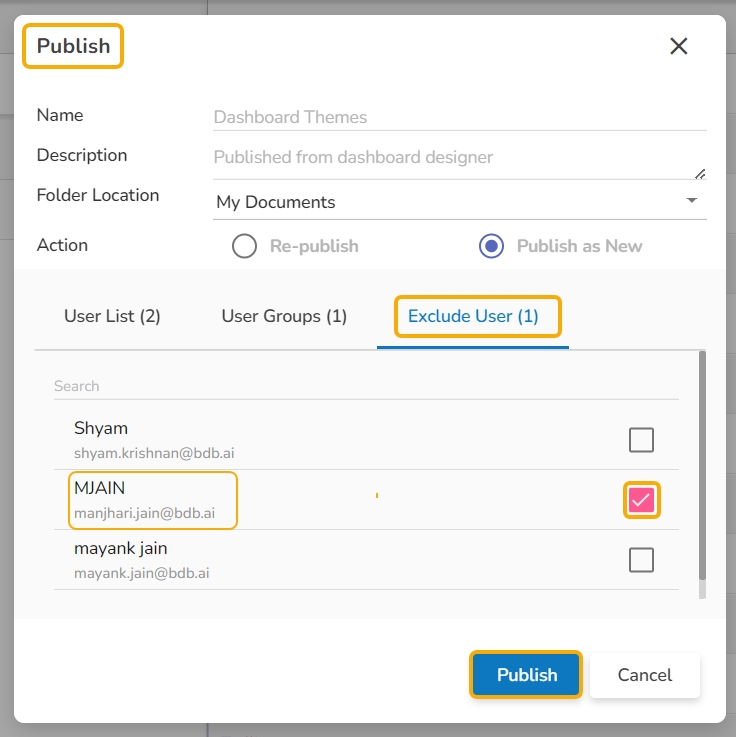
The user needs to specify a user or user group using the following options:
User List: To select a user or multiple users by using a checkmark in the box.
User Groups: To select a user group or multiple user groups by using a checkmark in the box.
Exclude User: To exclude a user or multiple users by using a checkmark in the box.
Click the Publish option.
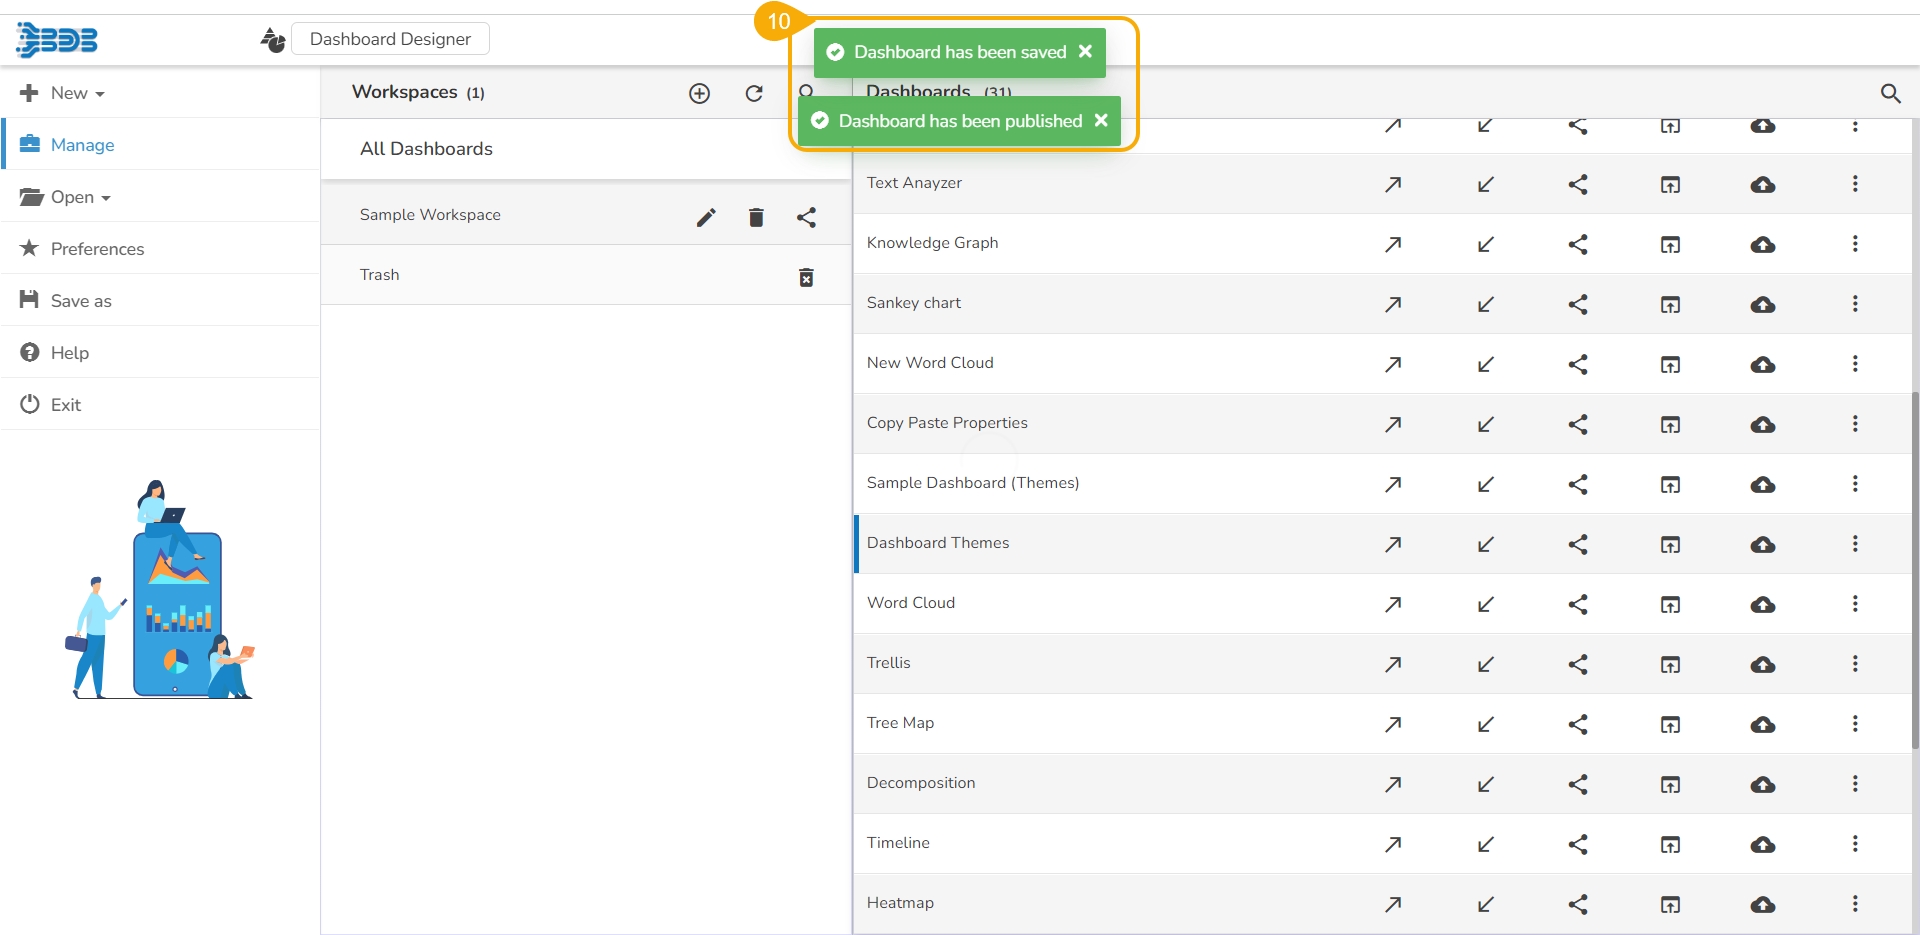
Two consecutive notification messages appear to assure the completion of the action.
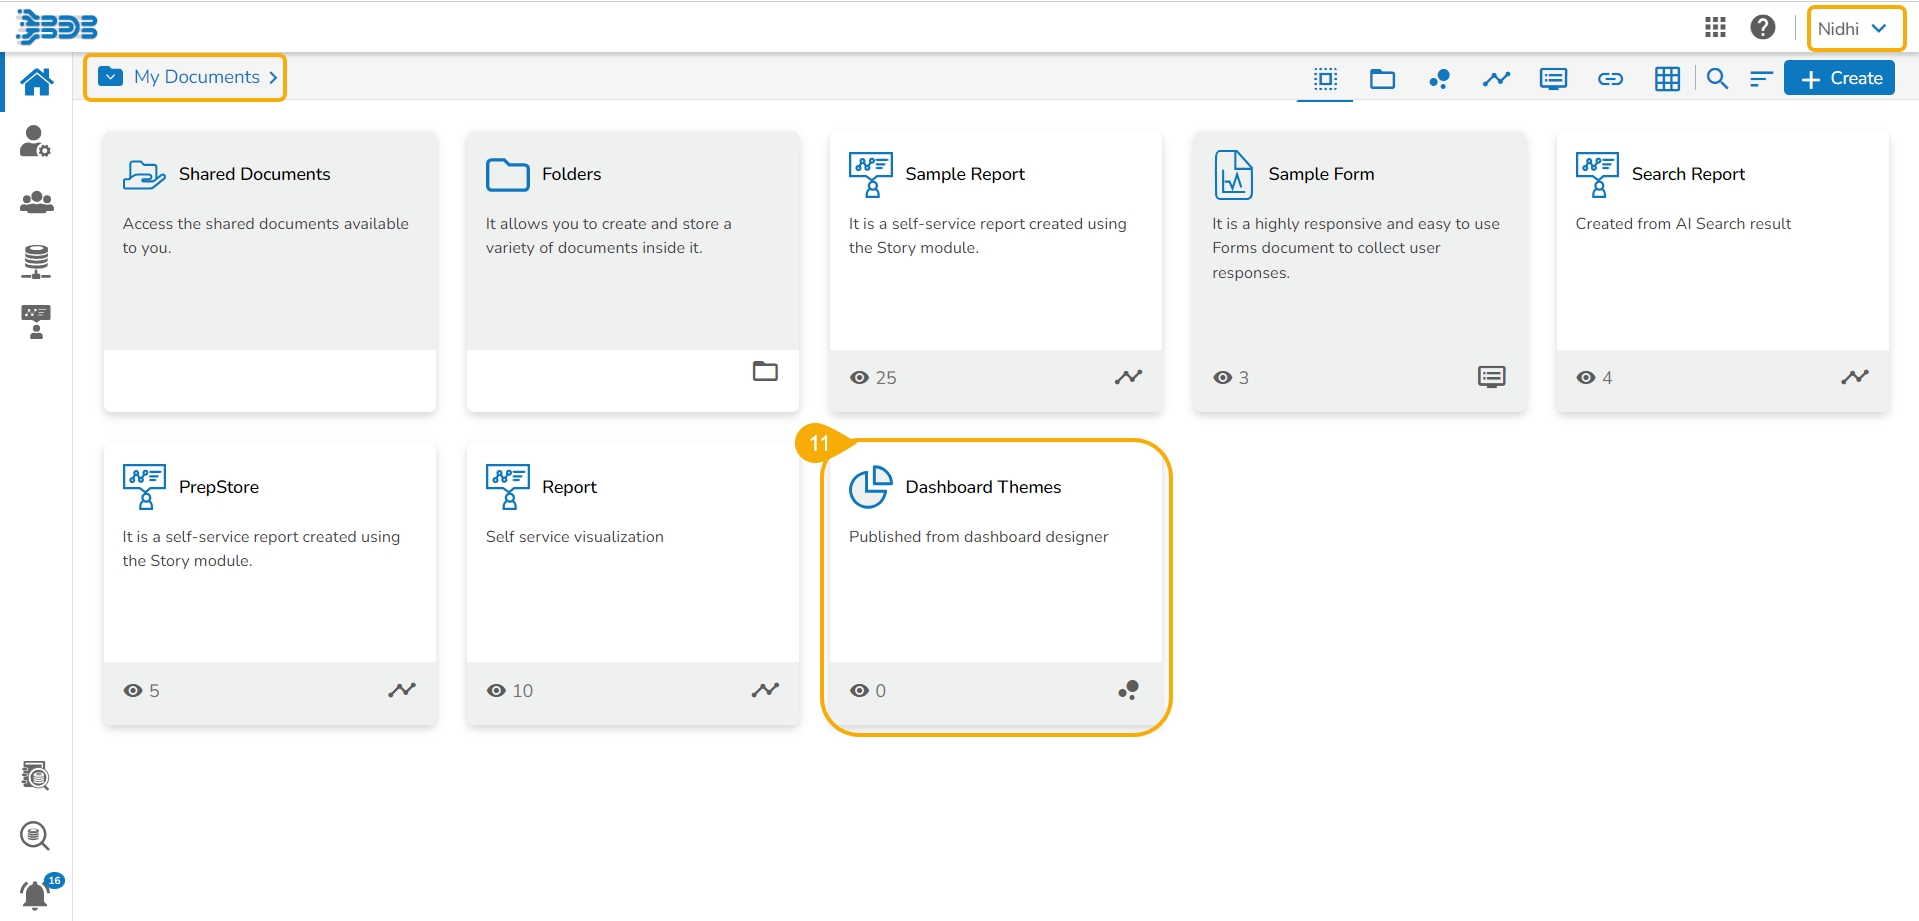
The selected dashboard gets published at the desired place.
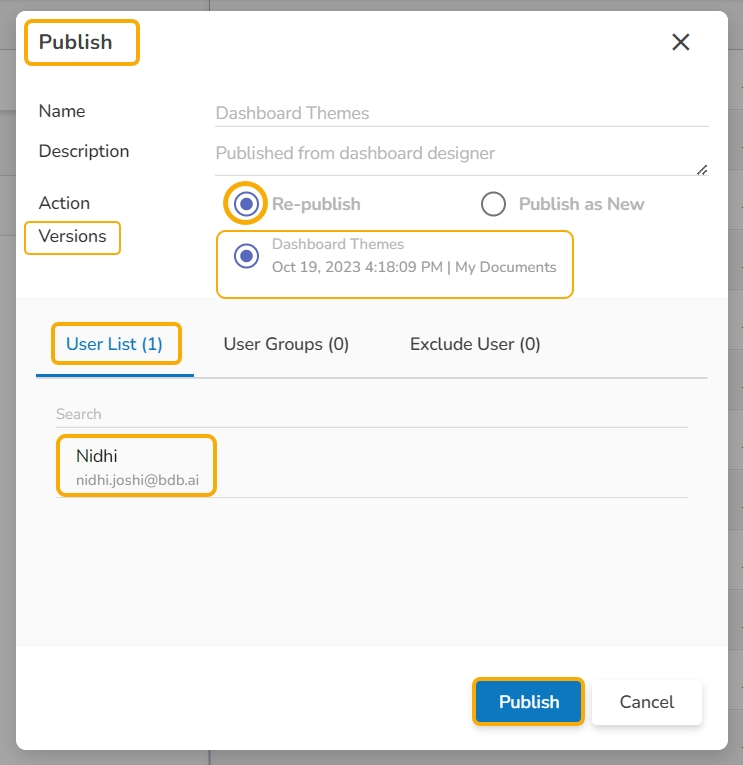
For the published dashboard, the below-given dialog box appears while clicking the Publish to Portal icon.
Select an action option out of Re-Publish or Publish as New.
The Republish option if selected displays the following details:
The available version(s) of the published dashboard. The user can select a version to republish.
The selected user(s) or user group(s) gets appeared in the dialog box.
The Publish as New action allows the user to publish the selected dashboard as new.
Select Use(s) or User Group(s) using either USER LIST or USER GROUPS tab.
Select the desired user(s) or user group(s) using check marks in the given check boxes.
Please Note:
Click the Publish option to complete the action of republishing a dashboard or Publishing a Dashboard as New.
Click the Publish option even to Exclude a user from the rights to access a dashboard.
Each published Dashboard gets a set of options to be performed on it. Refer to Options for a Published Dashboard section provided under the Document Options to get more details on it.
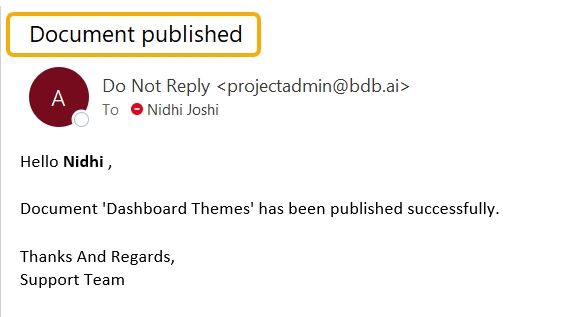
The selected user receives an email from the BDB Support Team after the selected Dashboard gets published to the user.
Check out the walk-through on how to share a Dashboard.
Open the Manage option.
Open a Workspace from the list of workspaces.
Select a dashboard from the list of dashboards.
Click the Share Dashboard icon for the selected dashboard.
The Manage Access window opens for the selected dashboard.
Select permissions using the checkboxes provided for the Grant Permissions.
Use the User List or User Groups option to select user(s)/user group(s) to share the dashboard.
Search for the user or user group using the search bar.
Use the checkboxes to select the user(s) or user group(s) you want to share the dashboard.
Click the Share option.
A success message ensures that the dashboard is shared successfully.
Open the Share Dashboard window again for the same dashboard, the user to whom it has been shared will be listed under the Granted Permissions section.
Navigate to the target user's account, and access the Designer module. Open the Manage section. The shared dashboard gets notified by the letter 's' next to the dashboard name. Even the workspace will be notified with 's' next to it indicating that it is a shared workspace.
Check out the illustration on excluding the users while sharing a dashboard with a user group.
Navigate to the Share Dashboard window.
Choose permissions from the Grant Permissions section.
Go to the User Groups tab.
Search for a specific user group using the search bar.
Select a user group using the checkbox. The user is allowed to select multiple user groups.
Open the Exclude User tab.
Select users whom you wish to exclude by using the checkboxes.
Click the Share option.
A notification message ensures the dashboard is shared with the user group.
Open the Manage Access window again for the same dashboard.
The excluded users will be listed under the Excluded Users section.
Please Note: The excluded users can be included to have the privileges of the shared dashboard by using the Include user option.
Check out the illustration on revoking the shared dashboard privileges for a user/ user group.
Navigate to the Manage Access window for a shared dashboard.
The user(s)/ user group(s) to whom the dashboard has been shared appears under the Granted Permissions section.
Select a user or user group from the Granted Permissions section.
Click the Revoke icon.
The Revoke window appears to confirm the action.
Click the Yes option.
A notification message appears.
The selected user or user group's privileges would be revoked for that dashboard. The selected user or group will be removed from the Granted Permissions section.
Please Note: The shared dashboards can be opened only in the Designer module by the users with whom they are shared. The users do not get any further managing options credited to a shared dashboard.
This page provides steps to save a dashboard template using the Designer module.
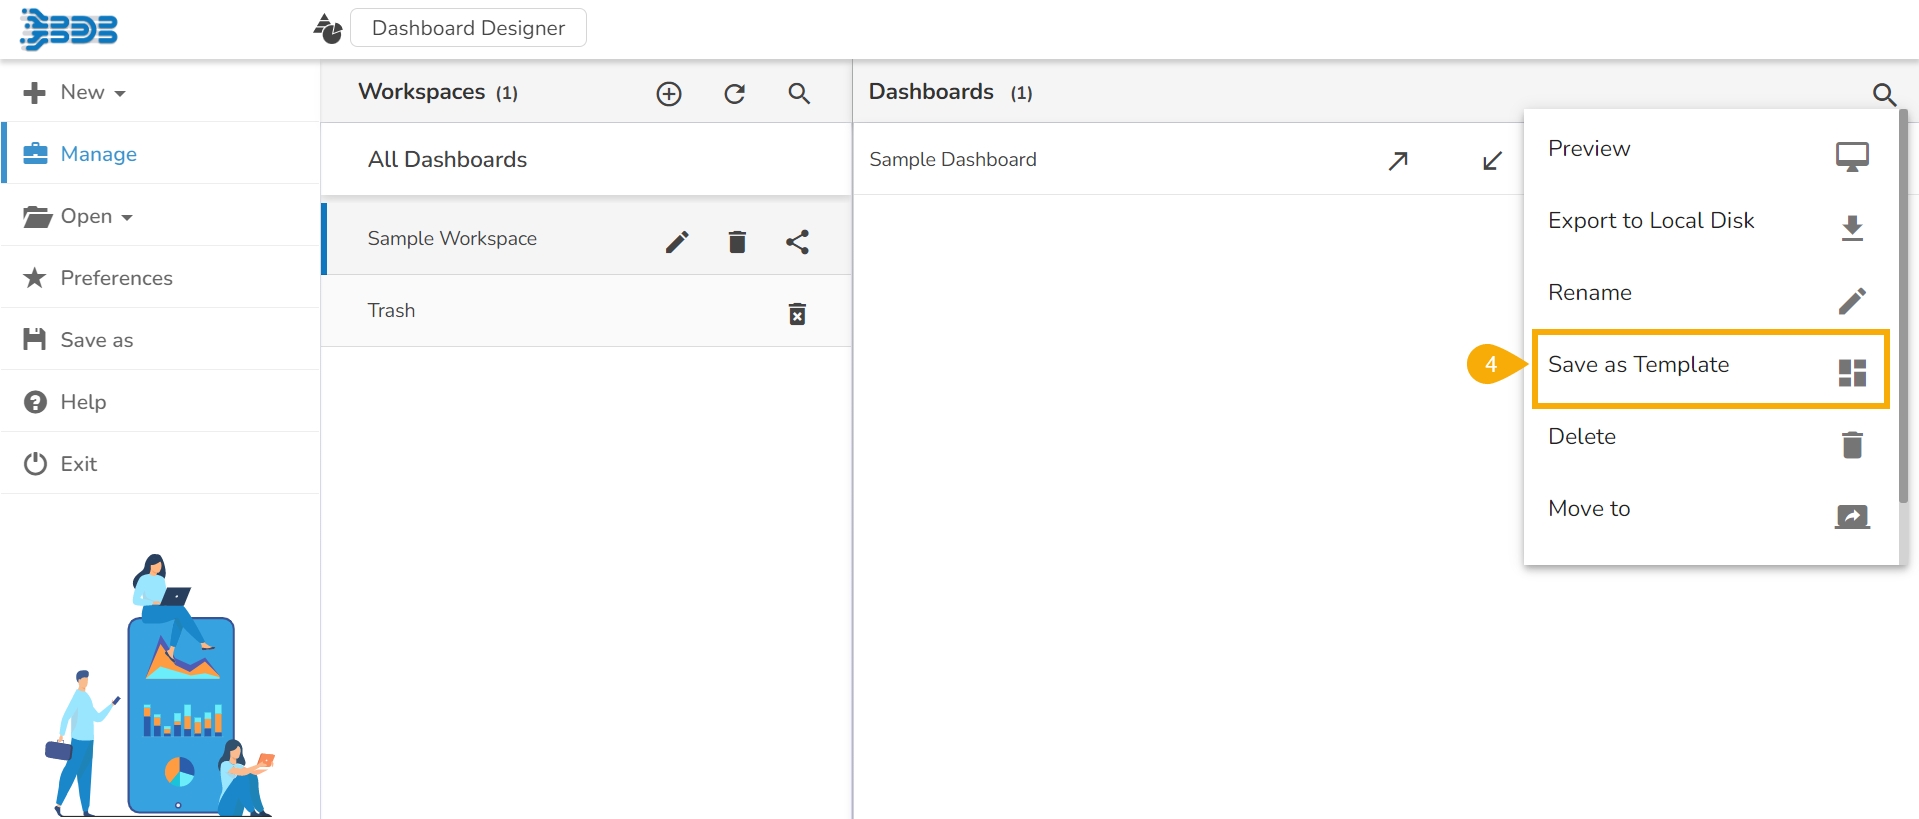
The Save as Template option has been provided under the More Actions menu for each saved dashboard. By clicking this option it will create the selected dashboard as a Card in the Templates section.
Check out the given illustration on how to create and use the Dashboard Templates inside the Designer module.
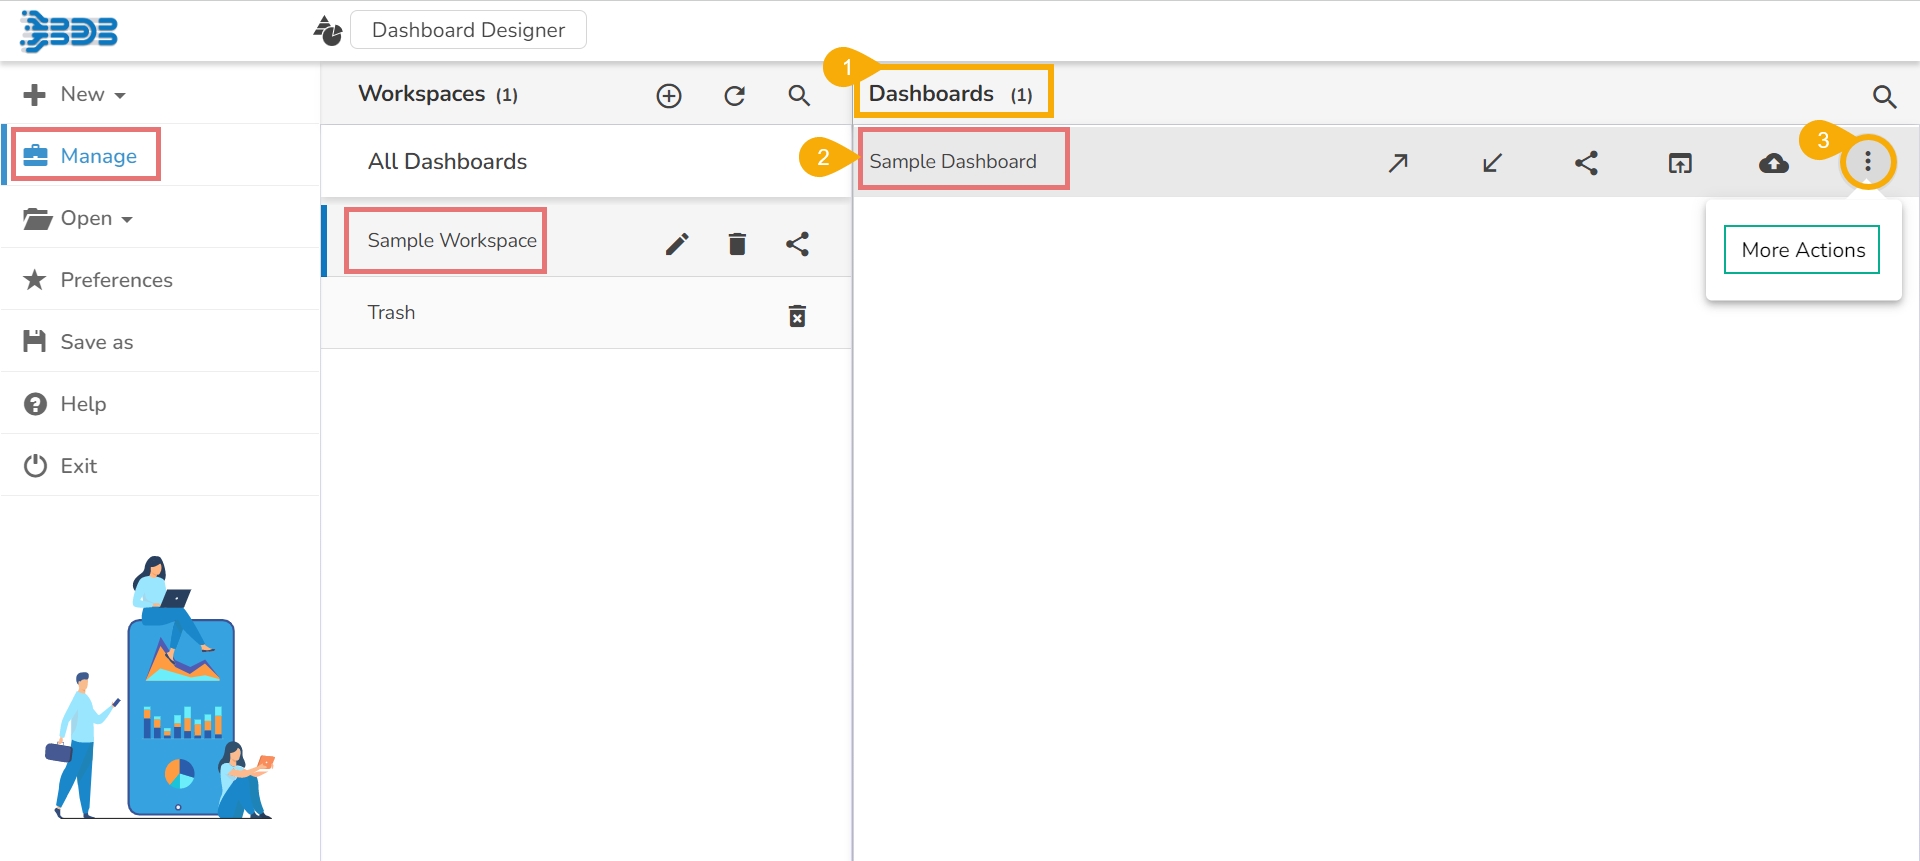
Navigate to the saved Dashboards list using the Manage option.
Select a Dashboard from the list.
Click the More Actions icon for the selected dashboard.
Click the Save as Template option from the More Actions context menu.
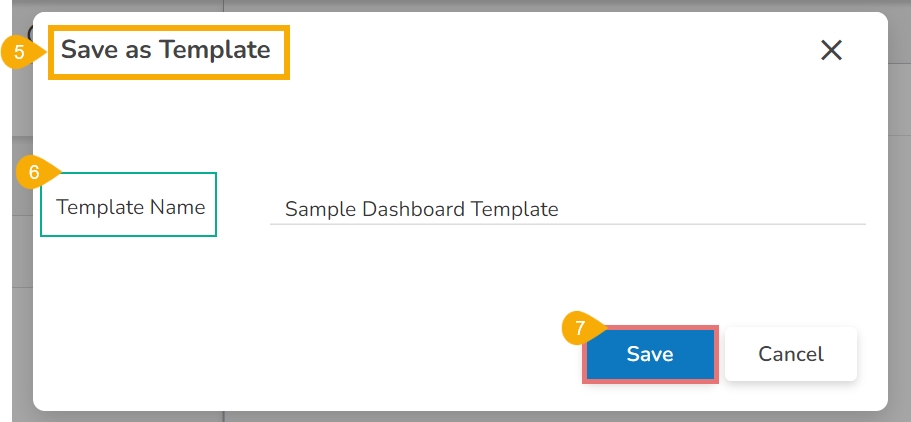
The Save as Template dialog box opens.
Provide the Template Name in the given space.
Click the Save option.
A notification message appears to inform the completion of the action.
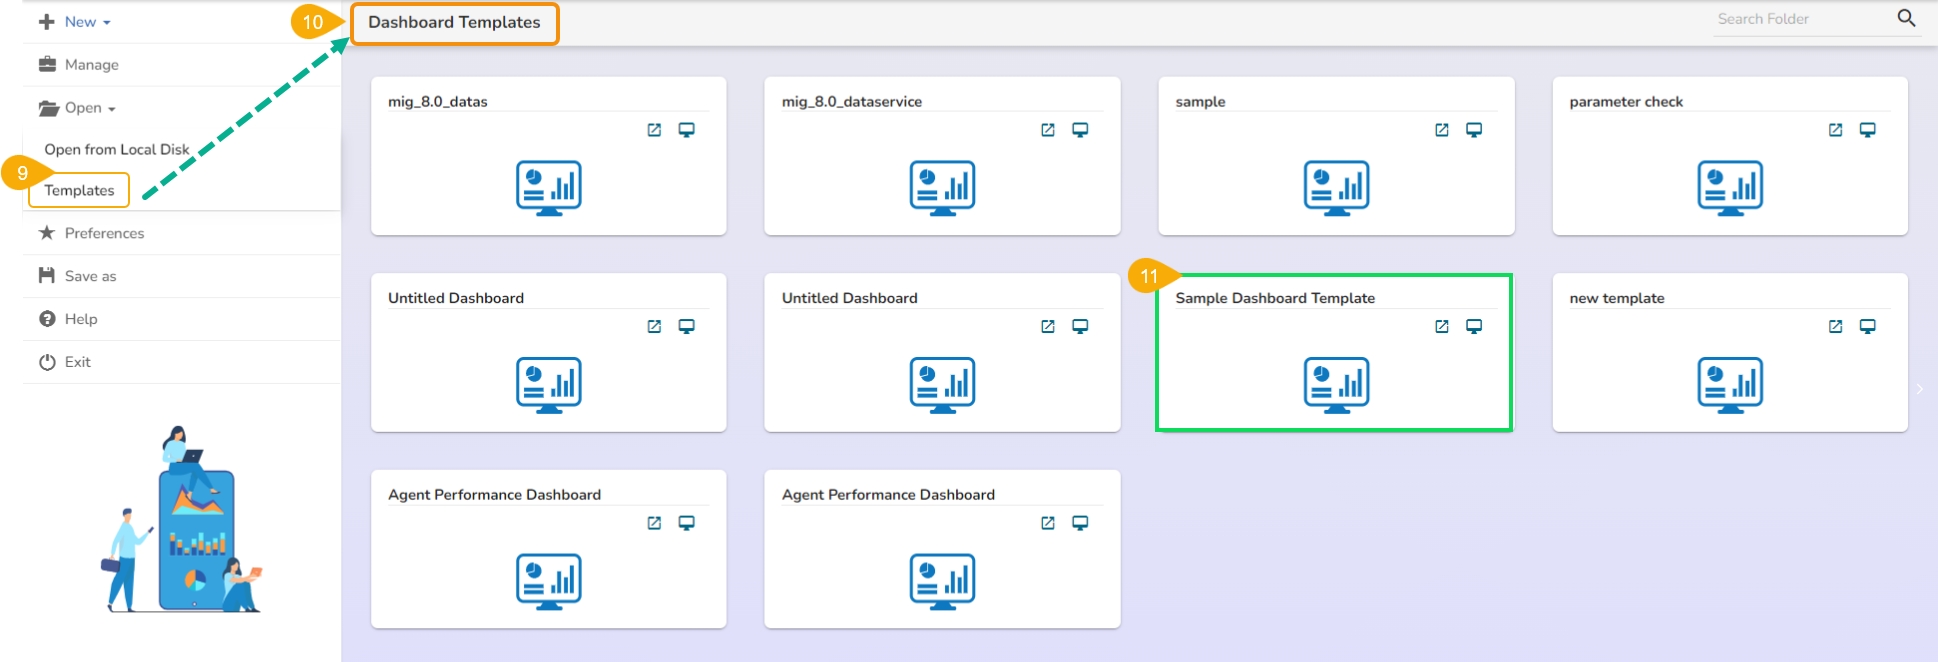
Click the Templates option provided under the Open option from the Designer homepage.
The Dashboard Templates page opens listing all the available dashboard templates.
The recently saved dashboard template gets listed under the Dashboard Templates page.
Please Note: The saved Dashboard template gets two icons to perform actions.
The users can move the created dashboards from one workspace to another using this option. This section explains the steps to move dashboards.
Select a dashboard using the Manage option.
Click the Move to icon from the More Actions context menu.
The Move to Another Workspace window appears.
Select a Workspace from the drop-down menu.
Click the Move option to move the selected dashboard into the desired workspace.
A success message appears.
The dashboard gets moved to the selected Workspace.
Check out the walk-through on how to use the Version Control functionality for the Dashboards.
Click the Manage option.
Select and open a Workspace from the list of Workspaces.
Select a dashboard from the dashboard list.
Click the Push to VCS icon for the selected dashboard.
The Push into Version Controlling System dialog box opens.
Provide a commit message.
Select a Push Type out of Dashboard Versioning and GIT Export
Click the Push option.
A Confirmation message appears and the selected dashboard version gets pushed to VCS.
Click the Manage option.
Select and open a Workspace from the list of Workspaces.
Select a dashboard from the dashboard list.
Click the Pull from VCS icon for the selected dashboard.
The Pull from Version Controlling System dialog box opens.
Select a Version by using the given checkbox.
Click the Pull option.
A confirmation message appears and the selected version of the dashboard gets pulled.
The Preview action option opens the selected dashboard in the preview mode.
Navigate to a saved dashboard using the Manage option.
Select a dashboard and click the More Actions icon.
Choose the Preview action from the context menu.
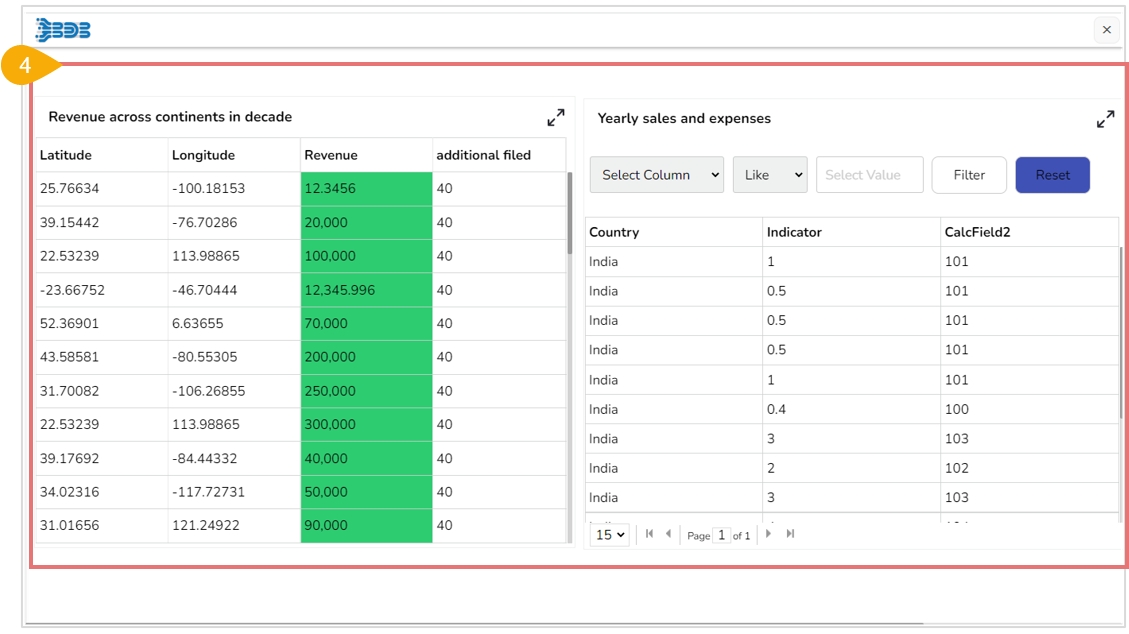
The selected dashboard opens in Preview mode.
The Export to Local Disk option exports the selected dashboard to the local disk.
Select a dashboard using the Manage option.
Choose the Export to Local Disk option from the More Actions context menu.
The selected dashboard gets exported to the local disk.
Previously created dashboards can be renamed using this option. This part provides steps on how to rename an existing dashboard.
Select a dashboard using the Manage option.
Click the Rename icon from the More Actions context menu.
The Rename window appears.
Enter a new name for the selected dashboard.
Click the Rename option to save the new name.
A success message appears.
The selected dashboard gets renamed.
This page explains the steps to Delete a dashboard and restore a deleted dashboard.
Users can delete a dashboard by following the steps explained over here.
Select a dashboard using the Manage option.
Click the Delete icon from the More Actions context menu.
A pop-up window appears to confirm the deletion.
Select the Remove option from the pop-up window.
A message appears to notify the completion of the action and the selected dashboard gets removed from the list.
By default, the dashboard gets moved to the Trash Workspace. The users can open the Trash Workspace and restore the dashboard to the desired workspace.
Click the Manage option from the Designer homepage.
Navigate to the Trash workspace created under the list of all the workspaces.
Select a deleted dashboard that you want to restore Click the Restore icon.
The Restore window appears.
Select a workspace using the drop-down menu.
Click the Restore option.
A success message appears to assure the restoration.
The dashboard gets restored to the selected workspace.
Open as dashboard
Preview Template
When the users click on the Open as Dashboard icon, they will get all dragged charting components in the Designer canvas view without the inserted scripts and mapped data connection for that dashboard.
When the users select the Preview Template icon, they will get the preview mode of the selected dashboard. It allows the inserted functionality together with the mapped dataset for the preview.
Accessing the Push to VCS icon for a dashboard
Please Note: The user gets the Preview icon on the Designer canvas header as well.
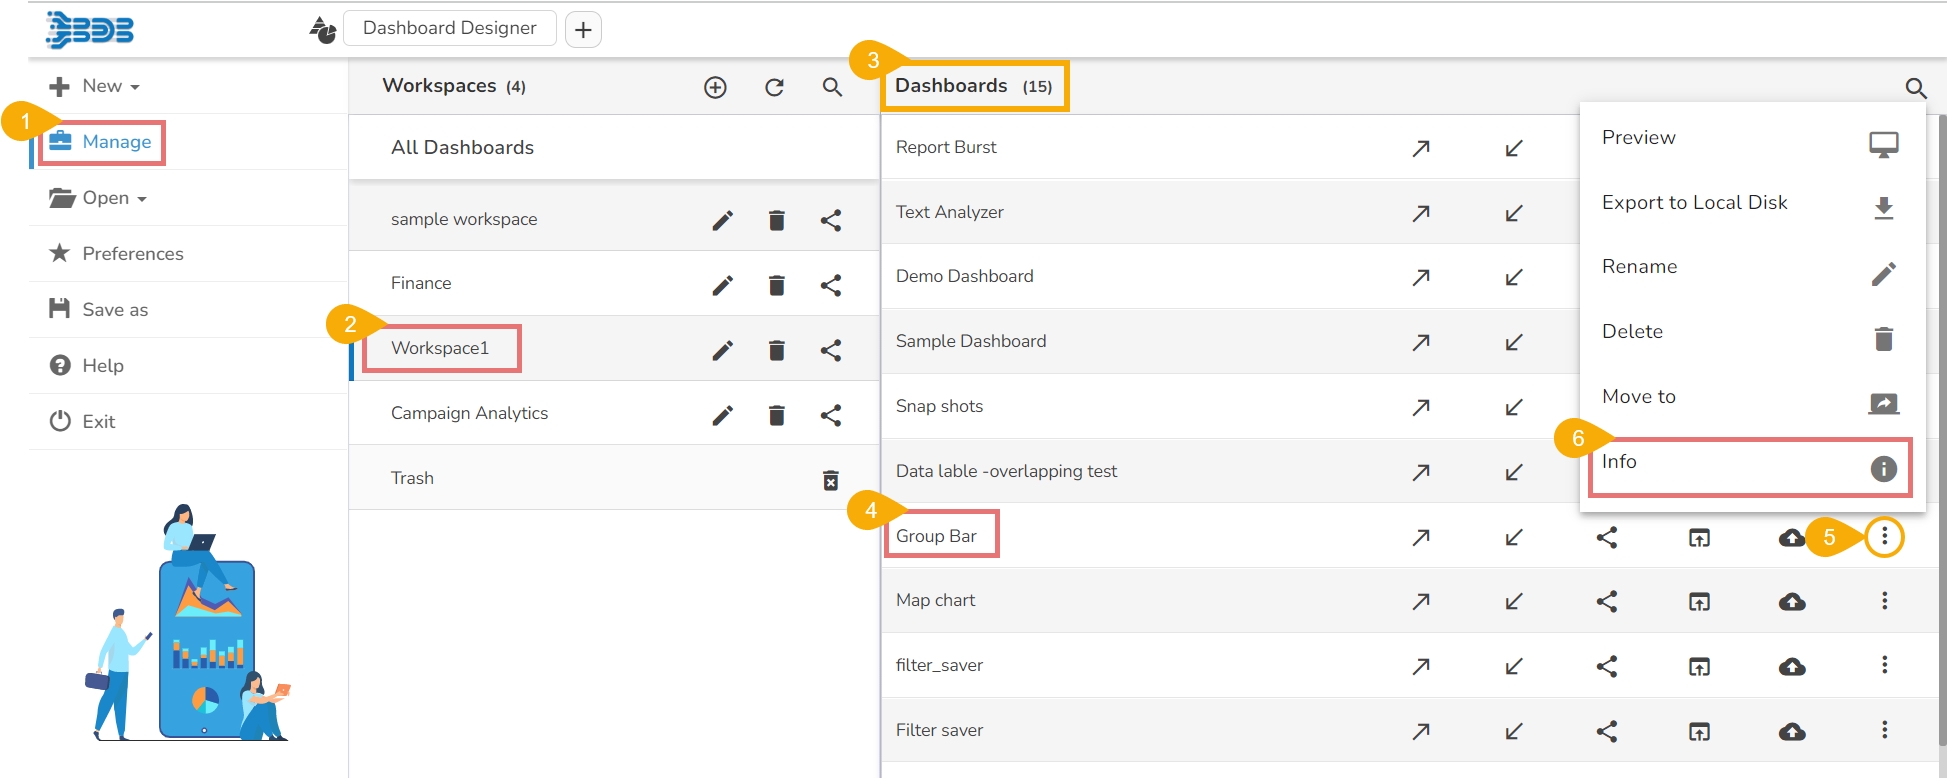
Click the Manage option from the Designer Homepage Left Menu Panel.
Select a Workspace from the list of available Workspaces.
A list of available Dashboards inside the selected Workspace opens.
Select a Dashboard from the list.
Click the Action menu icon for the dashboard.
Click the Info icon from the Action menu.
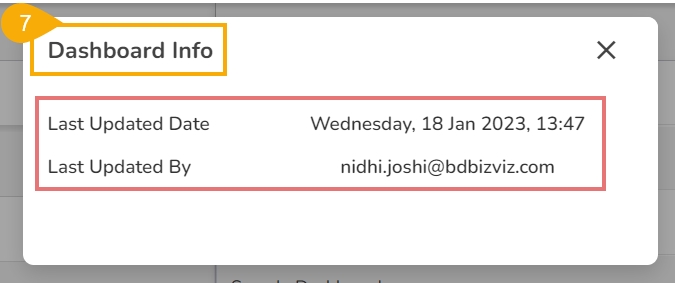
The Dashboard Info window opens displaying the related information such as Last Updated Date and Last Updated By.


