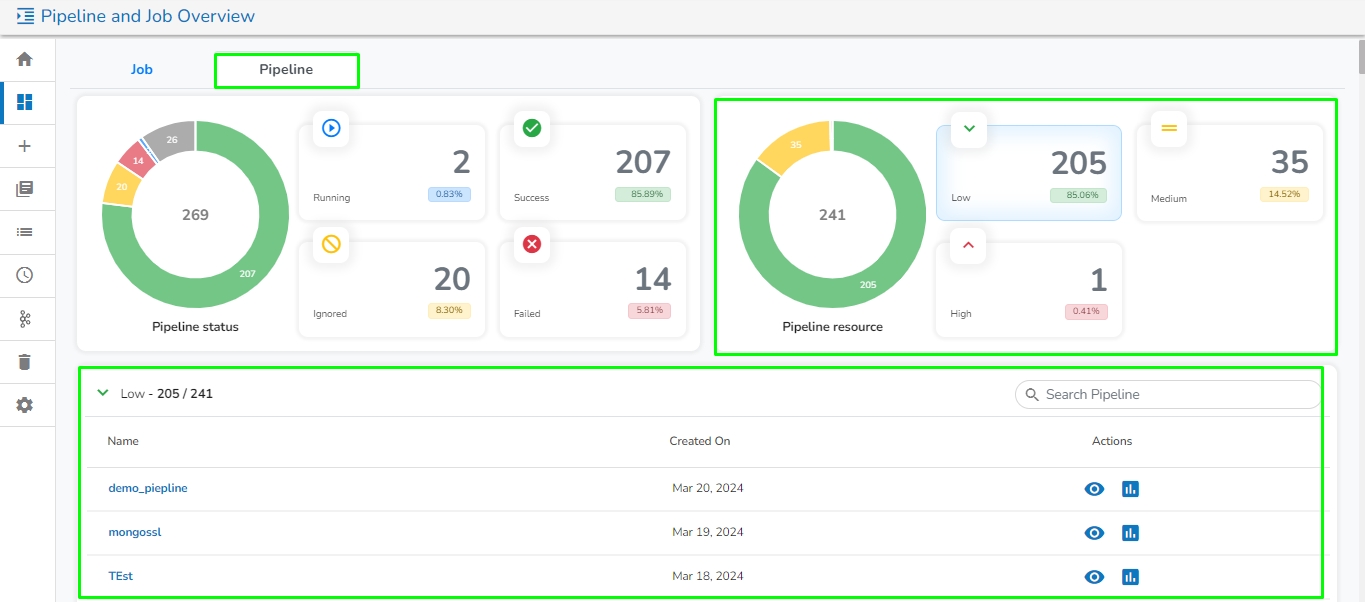
This page shows a summary of Pipelines in a graphical manner.
Please go through the below given demonstration for the Pipeline Overview page.
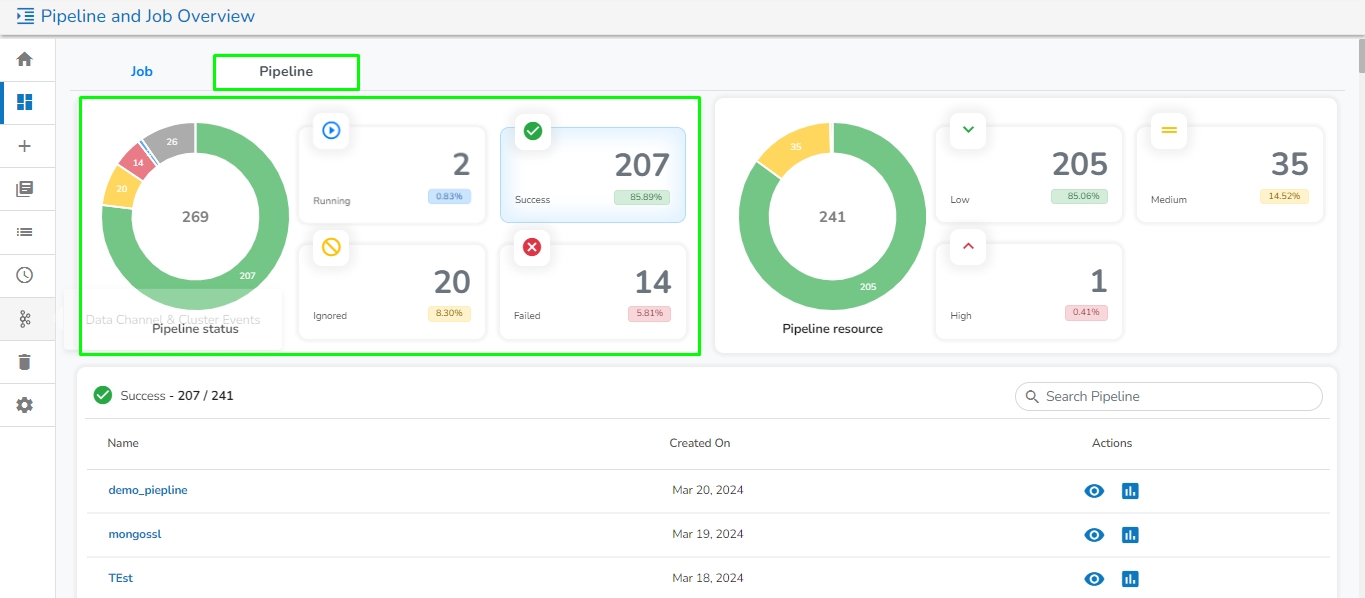
This page contains the following information of the Pipelines in the graphical format:
This section displays the total number of pipelines created along with their count and percentage in a tile manner for the following different running statuses:
Running: Displays the number and total percentage of running pipelines.
Success: Displays the number and total percentage of successfully executed pipelines.
It displays the total number and percentage of pipeline created for the following resource type in the graphical format:
Low
Medium
High
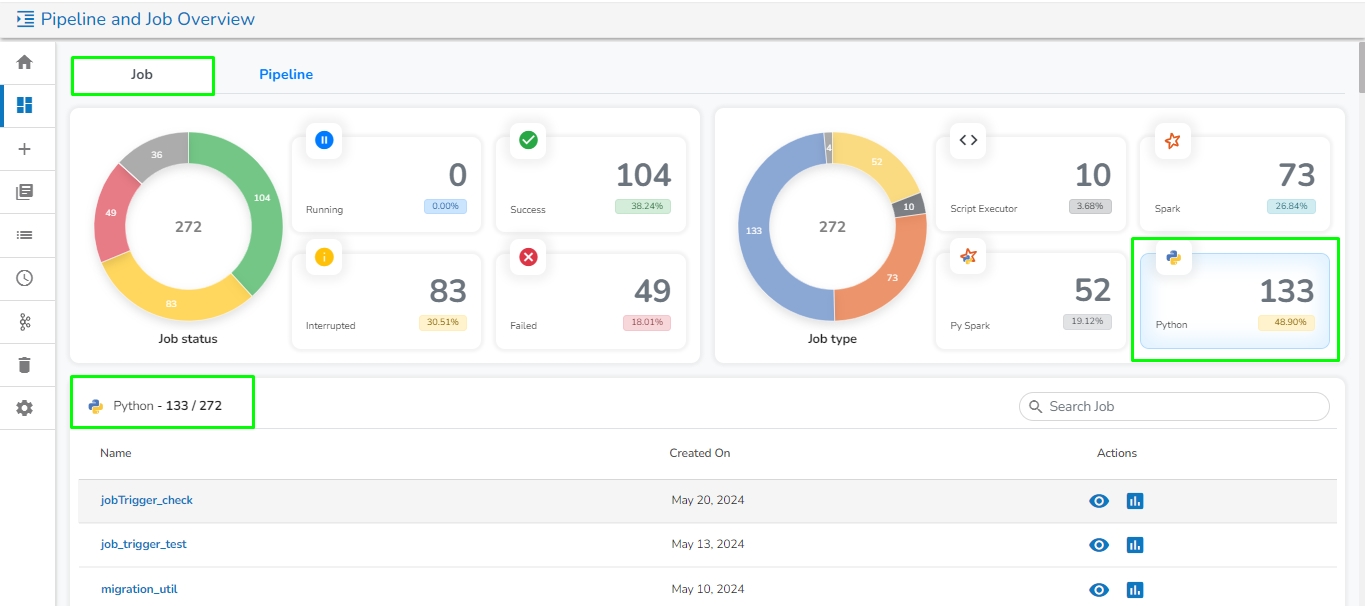
This page provides an overview and summary of the pipeline module, including details such as running status, types, number of pipelines and jobs, and resources used.
Please go through the below given demonstration for the Job Overview page.
This tab will open by default once the user navigates to the Pipeline and Job Overview page. It contains the following information of the Jobs in graphical format:
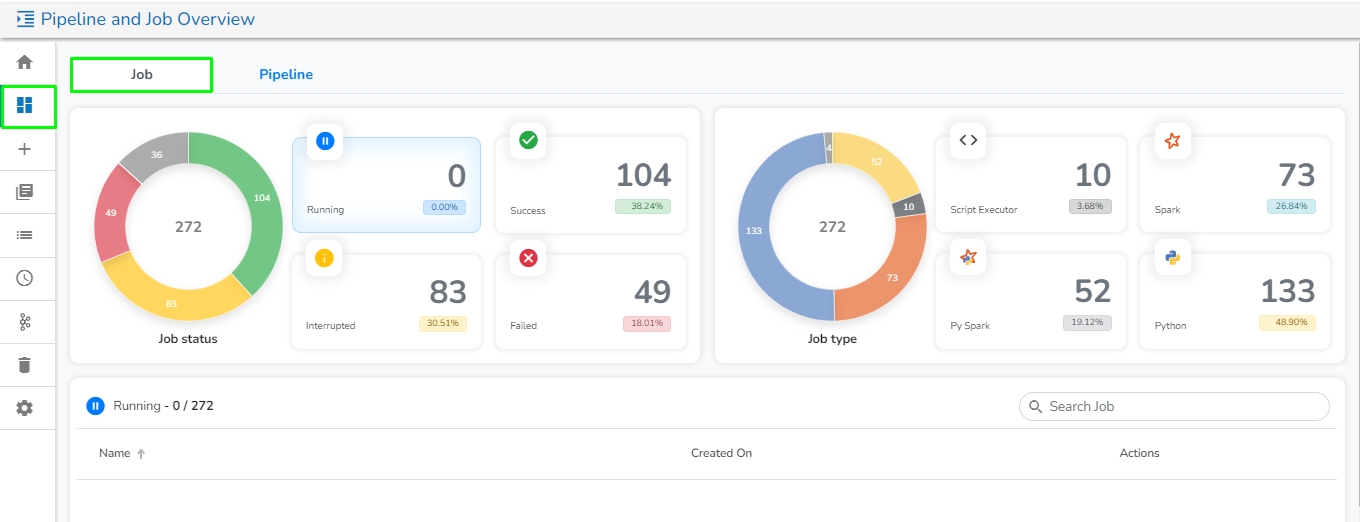
Job Status:
This section displays the total number of Jobs created along with their count and percentage in a tile manner the following different running status :
Failed: Displays the number and total percentage of pipelines where failure has occurred.
Once the user clicks on any of the status, it will list down all the pipelines related to that particular category along with the following option:
View: Redirects the user to the selected pipeline workspace.
Monitor: Redirects the user to the monitoring page for the selected pipeline.
Once the user clicks on any of the resource type, it will list down all the pipelines related to that particular resource type along with the following option:
View: Redirects the user to the selected job workspace.
Monitor: Redirects the user to the for the selected job.
Running: This section displays the number and total percentage of running jobs.
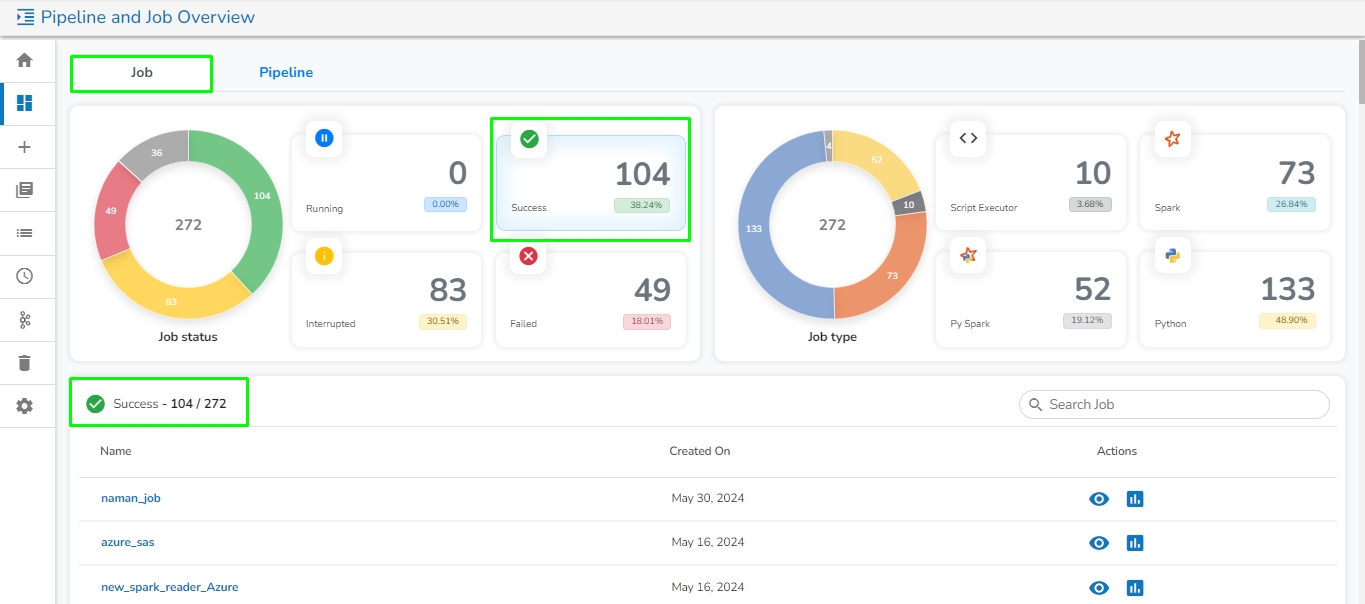
Success: This section displays the number and total percentage of successfully ran jobs.
Interrupted: This section displays the number and total percentage of interrupted jobs.
Failed: This section displays the number and total percentage of failed jobs.
Once the user clicks on any of the status, it will list down all the jobs related to that particular category along with the following option:
View: Redirects the user to the selected job workspace.
Monitor: Redirects the user to the monitoring page for the selected job.
Job Type:
It displays the total number and percentage of jobs created for the following categories in the graphical format:
Once the user clicks on any of the job type, it will list down all the jobs related to that particular job type along with the following option:
View: Redirects the user to the selected job workspace.
Monitor: Redirects the user to the for the selected job.