Loading...
Loading...
Loading...
Loading...
Loading...
Loading...
Loading...
Loading...
Loading...
Loading...
Loading...
Loading...
Loading...
Loading...
Loading...
Loading...
Loading...
Loading...
Loading...
Loading...
Loading...
Loading...
Loading...
Loading...
Loading...
Loading...
Loading...
Loading...
Loading...
Loading...
Loading...
Loading...
Loading...
Loading...
Loading...
Loading...
Loading...
Loading...
Loading...
Loading...
Loading...
Loading...
Loading...
Loading...
Loading...
Loading...
Loading...
Loading...
Loading...
Loading...
Loading...
Loading...
Loading...
Loading...
Loading...
Loading...
Loading...
Loading...
Loading...
Loading...
Loading...
Loading...
Loading...
Loading...
Loading...
Loading...
Loading...
Loading...
Loading...
Loading...
Loading...
Loading...
Loading...
Loading...
Loading...
Loading...
Loading...
Loading...
Loading...
Loading...
Loading...
Loading...
Loading...
Loading...
Loading...
Loading...
Loading...
Loading...
Loading...
Loading...
Loading...
Loading...
Loading...
Loading...
Loading...
Loading...
Loading...
Loading...
Loading...
Loading...
All the available Writer Task components for a Job are explained in this section.
Writers are a group of components that can write data to different DB and cloud storages.
There are Eight(8) Writers tasks in Jobs. All the Writers tasks is having the following tabs:
Meta Information: Configure the meta information same as doing in pipeline components.
Preview Data: Only ten random data can be previewed in this tab only when the task is running in Development mode.
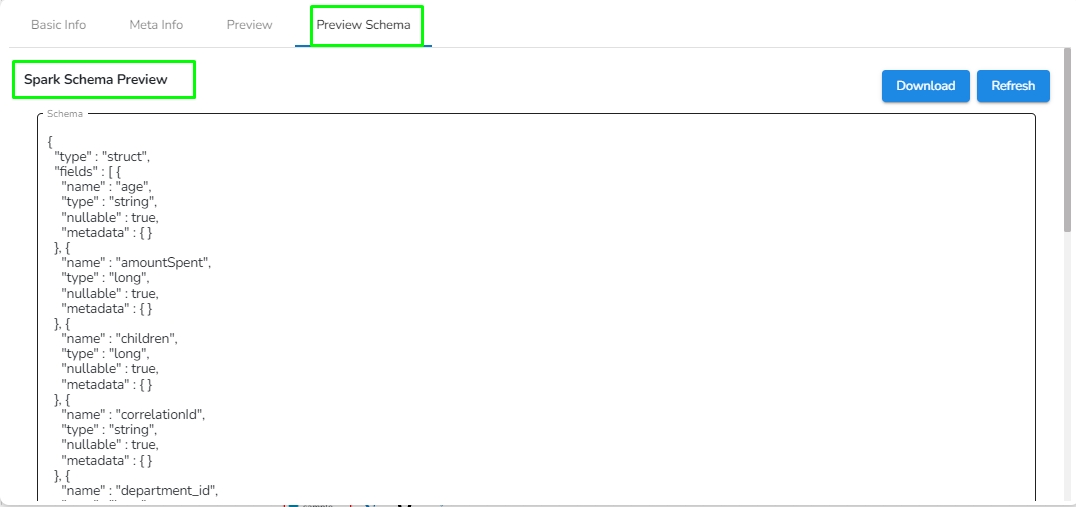
Preview schema: Spark schema of the data will be shown in this tab.
Logs: Logs of the tasks will display here.
This section provides details about the various categories of the task components which can be used in the Spark Job.
There are three categories of task components available:
All the available Reader Task components are included in this section.
Readers are a group of tasks that can read data from different DB and cloud storages. In Jobs, all the tasks run in real-time.
There are eight(8) Readers tasks in Jobs. All the readers tasks contains the following tabs:
Meta Information: Configure the meta information same as doing in pipeline components.
Preview Data: Only ten(10) random data can be previewed in this tab only when the task is running in Development mode.
Preview schema: Spark schema of the reading data will be shown in this tab.
Logs: Logs of the tasks will display here.
Readers are a group of components that can read data from different DB and cloud storages in both invocation types i.e., Real-Time and Batch.
Mongo DB reader component contains both the deployment-types: Spark & Docker
Real-time processing deals with streams of data that are captured in real-time and processed with minimal latency. These processes run continuously and stay live even if the data info has stopped.
Batch job orchestration runs the process based on a trigger. In the BDB Data Pipeline, this trigger is the input event. Anytime data is pushed to the input trigger, the job will kick start. After completing the job, the process is gracefully terminated. This process can be near real-time. Also, it allows you to effectively utilise the compute resources.
Each component is fully decoupled micro service that interact with events.
Every component in pipeline has a build-in consumer and producer functionality. This allows the component to consume data from an event process and send the output back to another Event/Topic.
Each component has an in-event and out-event. Component consumes data from in event/topic, this data is then processed and pushed to another event/topic.
Assembling a data pipeline is very simple. Just click and drag the component you want to use into editor canvas. Connect the component output to an event/topic.
A wide variety of out-of-the-box components are available to read, write, transform, ingest data into the BDB Data Pipeline from a wide variety of data sources.
Components can be easily configured just by specifying the required metadata.
For extensibility, we have provided Python-based scripting support that allows the pipeline developer to build complex business requirements which cannot be met by out-of-the-box components.
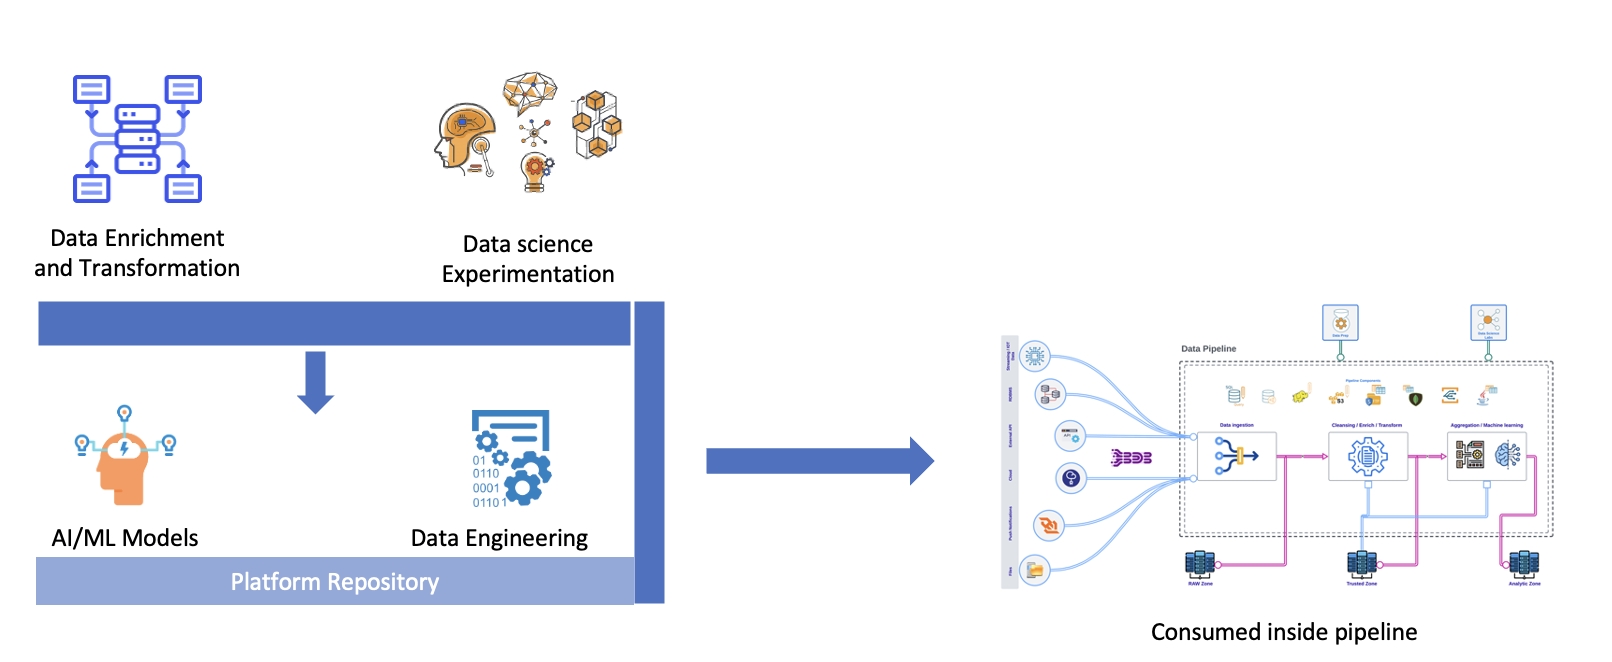
Data Pipeline provides extensibility to create your transformation logic via the DS Lab module that acts as the innovation lab for data engineers and data scientists using which they can conduct modeling experiments, before productionizing the component using the Data Pipeline.
Distributed computing is the process of connecting multiple computers via a local network or wide area network so that they can act together as a single ultra-powerful computer capable of performing computations that no single computer within the network would be able to perform on its own.Distributed computers offer two key advantages:
Easy scalability: Just add more computers to expand the system.
Redundancy: Since many different machines are providing the same service, that service can keep running even if one (or more) of the computers goes down.
The user can run multiple instances of the same process to increase the process throughput. This can be done using the auto scaling feature.
This page provides an overview and summary of the pipeline module, including details such as running status, types, number of pipelines and jobs, and resources used.
An event-driven architecture uses events to trigger and communicate between decoupled services and is common in modern applications built with microservices.
The connecting components help to assemble various pipeline components and create a Pipeline Workflow. Just click and drag the component you want to use into the editor canvas. Connect the component output to a Kafka Event.
Once a Pipeline is created the User Interface of the Data Pipeline provides a canvas for the user to build the data flow (Pipeline Workflow).The Pipeline assembling process can be divided into two parts as mentioned below:
Adding Components to the Canvas
Adding Connecting Components (Events) to create the Data flow/ Pipeline workflow
HDFS stands for Hadoop Distributed File System. It is a distributed file system designed to store and manage large data sets in a reliable, fault-tolerant, and scalable way. HDFS is a core component of the Apache Hadoop ecosystem and is used by many big data applications.
This task writes the data in HDFS(Hadoop Distributed File System).
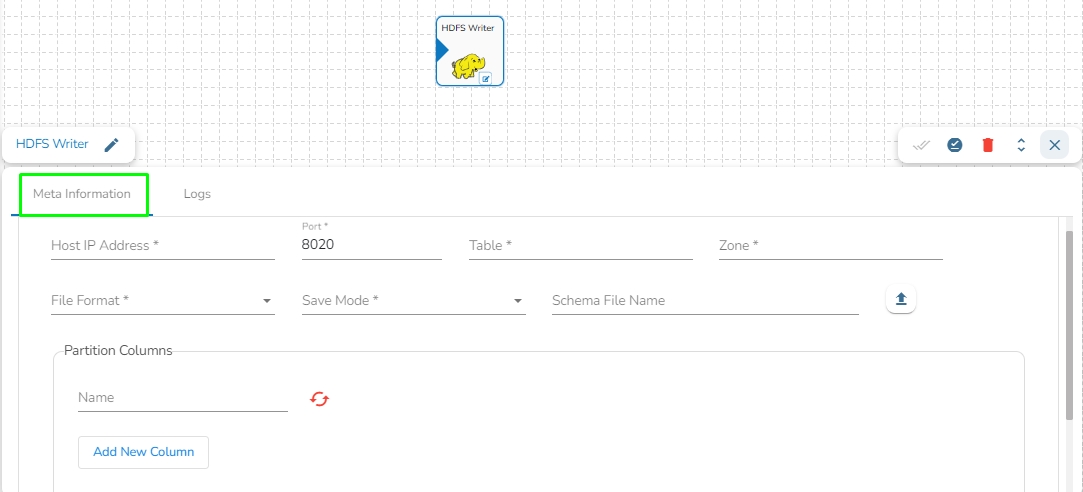
Drag the HDFS writer task to the Workspace and click on it to open the related configuration tabs for the same. The Meta Information tab opens by default.
Elasticsearch is an open-source search and analytics engine built on top of the Apache Lucene library. It is designed to help users store, search, and analyze large volumes of data in real-time. Elasticsearch is a distributed, scalable system that can be used to index and search structured, semi-structured, and unstructured data.
This task is used to read the data located in Elastic Search engine.
Drag the ES reader task to the Workspace and click on it to open the related configuration tabs for the same. The Meta Information tab opens by default.
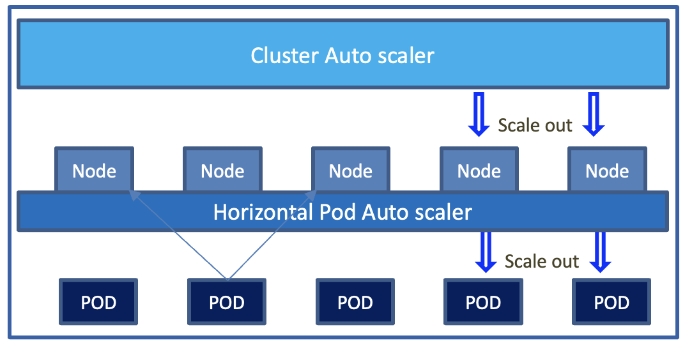
Kubernetes Cluster auto scaler will scale in and scale out the Nodes based on CPU and Memory Load.
Nodes are Virtual/Physical machines.
This task is used to write data in the following databases: MYSQL, MSSQL, Oracle, ClickHouse, Snowflake, PostgreSQL, Redshift.
Drag the DB writer task to the Workspace and click on it to open the related configuration tabs for the same. The Meta Information tab opens by default.
Check-out the given walk-through on how the Scheduler option works in the Data Pipeline.
The Scheduler List page opens displaying all the registered schedulers in a pipeline.
Elasticsearch is an open-source search and analytics engine built on top of the Apache Lucene library. It is designed to help users store, search, and analyze large volumes of data in real-time. Elasticsearch is a distributed, scalable system that can be used to index and search structured, semi-structured, and unstructured data.
This task is used to write the data in Elastic Search engine.
Drag the ES writer task to the Workspace and click on it to open the related configuration tabs for the same. The Meta Information tab opens by default.
Activating pipeline to deploy the pipelines.
The pipelines can be activated from two places by clicking onicon one from the page or the Workflow Editor tool-tip.
Once the pipeline gets activated all the pods are listed in the advanced logs.
Once the pipeline is activated the components get deployed and the list of deployed components can be seen in the advance logs panel.
The Zoom In/Zoom Out feature enables users to adjust the pipeline workflow editor according to their comfort, providing the flexibility to zoom in or zoom out as needed.
The Connection Validation option helps the users to validate the connection details of the db/cloud storages.
This option is available for all the components to validate the connection before deploying the components to avoid connection-related errors. This will also work with environment variables.
Check out a sample illustration of connection validation.
The right-side panel on the Pipeline Editor page gets displayed for some of the Pipeline Toolbar options.
The options for which a panel gets appeared on the right-side of the Pipeline Workflow Editor page are as listed below:
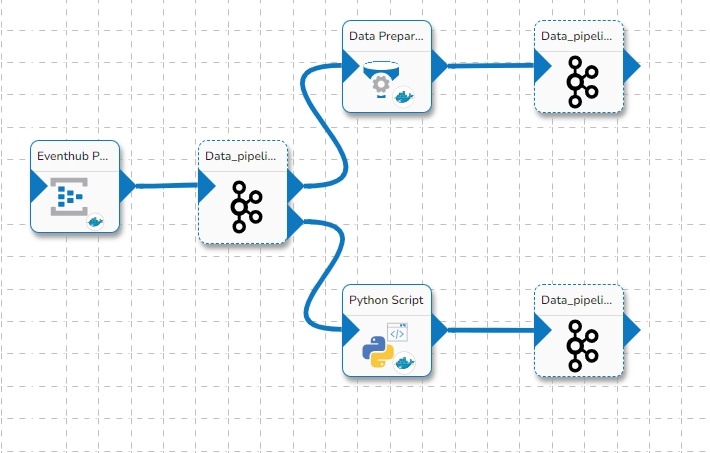
Each components inside a pipeline are fully decoupled. Each component acts as a producer and consumer of data. The design is based on event-driven process orchestration. For passing the output of one component to another component we need an Intermediatory event. An event-driven architecture contains three items:
Event Producer [Components]
Event Stream [Event (Kafka topic/ DB Sync)
Event Consumer [Components]
Host IP Address: Enter the host IP address for HDFS.
Port: Enter the Port.
Table: Enter the table name where the data has to be written.
Zone: Enter the Zone for HDFS in which the data has to be written. Zone is a special directory whose contents will be transparently encrypted upon write and transparently decrypted upon read.
File Format: Select the file format in which the data has to be written:
CSV
JSON
PARQUET
AVRO
Save Mode: Select the save mode.
Schema file name: Upload spark schema file in JSON format.
Partition Columns: Provide a unique Key column name to partition data in Spark.
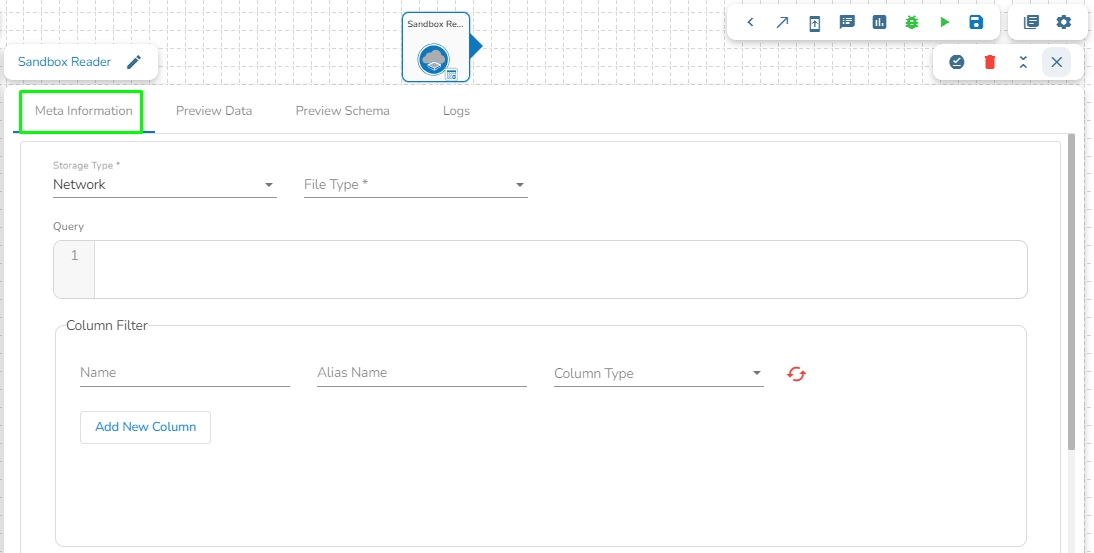
Sandbox File: Select the file name from the drop-down.
File Type: Select the file type from the drop down.
There are four(5) types of file extensions are available under it:
CSV: The Header and Infer Schema fields get displayed with CSV as the selected File Type. Enable Header option to get the Header of the reading file and enable Infer Schema option to get true schema of the column in the CSV file.
JSON: The Multiline and Charset fields get displayed with JSON as the selected File Type. Check-in the Multiline option if there is any multiline string in the file.
PARQUET: No extra field gets displayed with PARQUET as the selected File Type.
AVRO: This File Type provides two drop-down menus.
Compression: Select an option out of the Deflate and Snappy options.
Compression Level: This field appears for the Deflate compression option. It provides 0 to 9 levels via a drop-down menu.
XML: Select this option to read XML file. If this option is selected, the following fields will get displayed:
Query: Provide Spark SQL query in this field.
Host IP Address: Enter the host IP Address for Elastic Search.
Port: Enter the port to connect with Elastic Search.
Index ID: Enter the Index ID to read a document in elastic search. In Elasticsearch, an index is a collection of documents that share similar characteristics, and each document within an index has a unique identifier known as the index ID. The index ID is a unique string that is automatically generated by Elasticsearch and is used to identify and retrieve a specific document from the index.
Resource Type: Provide the resource type. In Elasticsearch, a resource type is a way to group related documents together within an index. Resource types are defined at the time of index creation, and they provide a way to logically separate different types of documents that may be stored within the same index.
Is Date Rich True: Enable this option if any fields in the reading file contain date or time information. The "date rich" feature in Elasticsearch allows for advanced querying and filtering of documents based on date or time ranges, as well as date arithmetic operations.
Username: Enter the username for elastic search.
Password: Enter the password for elastic search.
Query: Provide a spark SQL query.
PODs are enabled with autoscaling based on CPU and Memory Parameters.
All Pods are configured to have two instances, each deployed in different Nodes, using the node affinity parameter.
PODs are configured with self-healing, which mean when there is a failure a new POD is spun up.
Port: Enter the port for the given IP Address.
Database name: Enter the Database name.
Table name: Provide a single or multiple table names. If multiple table name has be given, then enter the table names separated by comma(,).
User name: Enter the user name for the provided database.
Password: Enter the password for the provided database.
Driver: Select the driver from the drop down. There are 6 drivers supported here: MYSQL, MSSQL, Oracle, ClickHouse, Snowflake, PostgreSQL, Redshift.
Schema File Name: Upload spark schema file in JSON format.
Save Mode: Select the Save mode from the drop down.
Append
Overwrite
Query: Write the create table(DDL) query.
Region (*): Provide S3 region.
Access Key (*): Access key shared by AWS to login
Secret Key (*): Secret key shared by AWS to login
Table (*): Mention the Table or object name which is to be read
File Type (*): Select a file type from the drop-down menu (CSV, JSON, PARQUET, AVRO are the supported file types).
Save Mode: Select the Save mode from the drop down.
Append
Schema File Name: Upload spark schema file in JSON format.
Traditional data transformation operation are sequential process where developer design and develop the logic and test and deploy it. BDB Data Pipeline allows the user to adopt the agile non-linear approach which reduces the time to market by 50 to 60 %
On the Scheduler List page, users will find the following details:
Scheduler Name: The name of the scheduler component as given in the pipeline.
Scheduler Time: The time set in the scheduler component.
Next Run Time: The next scheduled run time of the scheduler.
Pipeline Name: The name of the pipeline where the scheduler is configured and used. Clicking on this option will directly redirect the user to the selected pipeline.
Host IP Address: Enter the host IP Address for Elastic Search.
Port: Enter the port to connect with Elastic Search.
Index ID: Enter the Index ID to read a document in elastic search. In Elasticsearch, an index is a collection of documents that share similar characteristics, and each document within an index has a unique identifier known as the index ID. The index ID is a unique string that is automatically generated by Elasticsearch and is used to identify and retrieve a specific document from the index.
Mapping ID: Provide the Mapping ID. In Elasticsearch, a mapping ID is a unique identifier for a mapping definition that defines the schema of the documents in an index. It is used to differentiate between different types of data within an index and to control how Elasticsearch indexes and searches data.
Resource Type: Provide the resource type. In Elasticsearch, a resource type is a way to group related documents together within an index. Resource types are defined at the time of index creation, and they provide a way to logically separate different types of documents that may be stored within the same index.
Username: Enter the username for elastic search.
Password: Enter the password for elastic search.
Schema File Name: Upload spark schema file in JSON format.
Save Mode: Select the Save mode from the drop down.
Append
Selected columns: The user can select the specific column, provide some alias name and select the desired data type of that column.
Sandbox File: Enter the file name.
File Type: Select the file type in which the data has to be written. There are 4 files types supported here:
CSV
JSON
Save Mode: Select the Save mode from the drop down.
Append
Overwrite
Schema File Name: Upload spark schema file in JSON format.
This section focuses on the Configuration tab provided for any Pipeline component.
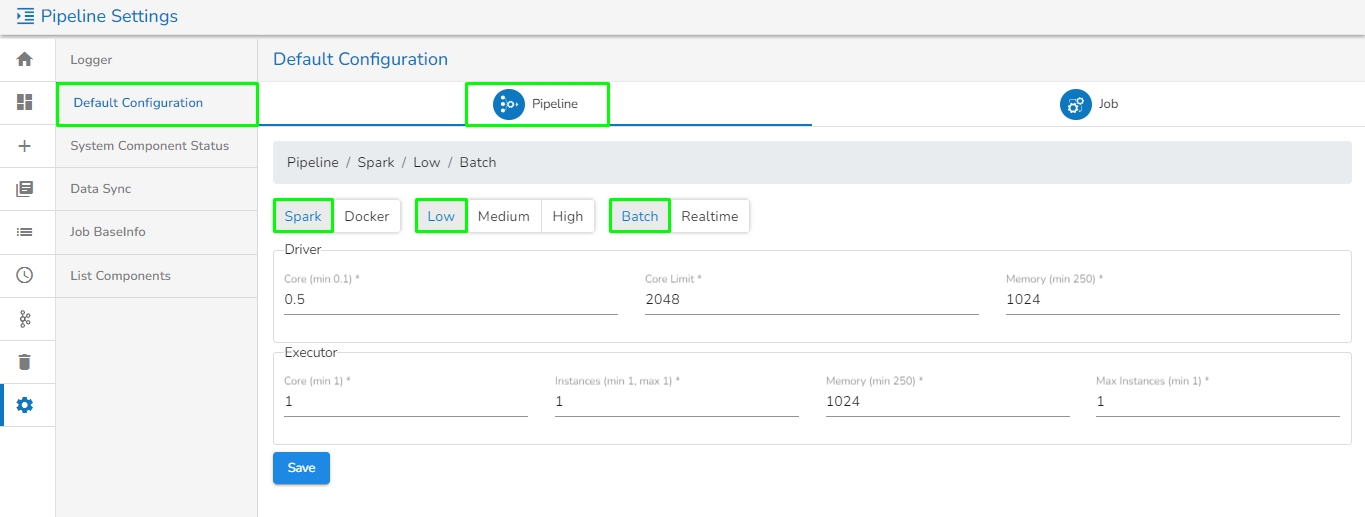
For each component that gets deployed, we have an option to configure the resources i.e., Memory and CPU.
We have two deployment types:
Docker
Spark
Go through the given illustration to understand how to configure a component using the Docker deployment type.
After we save the component and pipeline, the component gets saved with the default configuration of the pipeline i.e., Low, Medium, and High. After we save the pipeline, we can see the configuration tab in the component. There are multiple things.
For the Docker components, we have the Request and Limit configurations.
We can see the CPU and Memory options to be configured.
CPU: This is the CPU configuration where we can specify the number of cores that we need to assign to the component.
Memory: This option is to specify how much memory you want to dedicate to that specific component.
Instances: The number of instances is used for parallel processing. If we give N no. of instances those many pods will get deployed.
Go through the below given walk-through to understand the steps to configure a component with Spark configuration type.
The Spark Components configuration is slightly different from the Docker components. When the spark components are deployed, there are two pods that come up:
Driver
Executor
Provide the Driver and executor configurations separately.
Instances: The number of instances is used for parallel processing. If we give N no. of instances in executors configuration those many executors pods will get deployed.
This task is used to read data from MongoDB collection.
Drag the MongoDB reader task to the Workspace and click on it to open the related configuration tabs for the same. The Meta Information tab opens by default.
Connection Type: Select the connection type from the drop-down:
Standard
SRV
Connection String
Port (*): Provide the Port number (It appears only with the Standard connection type).
Host IP Address (*): The IP address of the host.
Username (*): Provide a username.
Password (*): Provide a valid password to access the MongoDB.
Database Name (*): Provide the name of the database where you wish to write data.
Additional Parameters: Provide details of the additional parameters.
Cluster Shared: Enable this option to horizontally partition data across multiple servers.
Schema File Name: Upload Spark Schema file in JSON format.
Query: Please provide Mongo Aggregation query in this field.
This section provides the steps involved in creating a new Pipeline flow.
Check out the below-given illustration on how to create a new pipeline.
Navigate to the Create Pipeline or Job interface.
Click the Create option provided for Pipeline.
The New Pipeline window opens asking for the basic information.
Enter a name for the new Pipeline.
Describe the Pipeline (Optional).
Select a resource allocation option using the radio button- the given choices are:
Click the Save option to create the pipeline. By clicking the Save option, the user gets redirected to the pipeline workflow editor.
A success message appears to confirm the creation of a new pipeline.
The Pipeline Editor page opens for the newly created pipeline.
Resource allocation can be changed anytime by clicking on top left edit icon near pipeline name.
In Apache Kafka, a "producer" is a client application or program that is responsible for publishing (or writing) messages to a Kafka topic.
A Kafka producer sends messages to Kafka brokers, which are then distributed to the appropriate consumers based on the topic, partitioning, and other configurable parameters.
Drag the Kafka Producer task to the Workspace and click on it to open the related configuration tabs for the same. The Meta Information tab opens by default.
Topic Name: Specify topic name where user want to produce data.
Security Type: Select the security type from drop down:
Plain Text
SSL
Is External: User can produce the data to external Kafka topic by enabling 'Is External' option. ‘Bootstrap Server’ and ‘Config’ fields will display after enable 'Is External' option.
Bootstrap Server: Enter external bootstrap details.
Config: Enter configuration details.
Host Aliases: In Apache Kafka, a host alias (also known as a hostname alias) is an alternative name that can be used to refer to a Kafka broker in a cluster. Host aliases are useful when you need to refer to a broker using a name other than its actual hostname.
IP: Enter the IP.
Host Names: Enter the host names.
Create a new Pipeline or Job based on the selected create option.
The Pipeline Homepage offers the Create option to initiate with Pipeline or Job creation based on the need of user.
Navigate to the Pipeline List page.
Click the Create icon.
The Create Pipeline or Job user interface opens prompting to create a new Pipeline and Job.
The Pipeline Workflow Editor contains Toolbar, Component Panel, and the Right-side Panel together with the Design Canvas for the user to create a pipeline flow.
The Pipeline Workflow consists of three main elements:
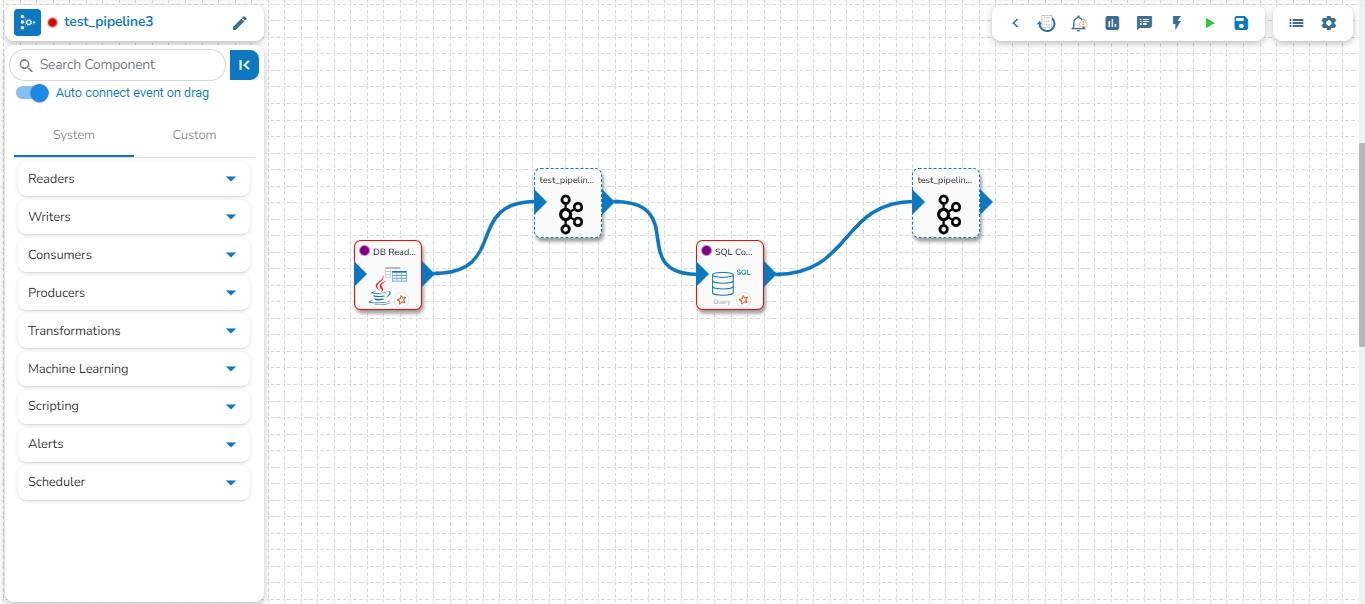
The above-given workflow shows the basic workflow to ingest data into a database using the Data Pipeline. It can be seen in the above workflow that data is read from a source using a reader component (DB Reader) and is then written to a destination location using a writer component (DB Writer).
In the successive slides, the user can find the detailed working of pipeline workflow design and the several pipeline components.
The user can activate/deactivate the pipeline by clicking on the/icon as shown in the image below:
Activation will deploy all the components based on their respective invocation types. When the pipeline is deactivated all the components go down and will halt the process.
This feature will display the failure history of all the components used in the pipeline.
Click the Pipeline Failure Alert History icon from the header panel of the Pipeline Editor.
A panel window will open from the right side, displaying the failure history of the components used in the pipeline.
Please go through the below given demonstration for the Job Overview page.
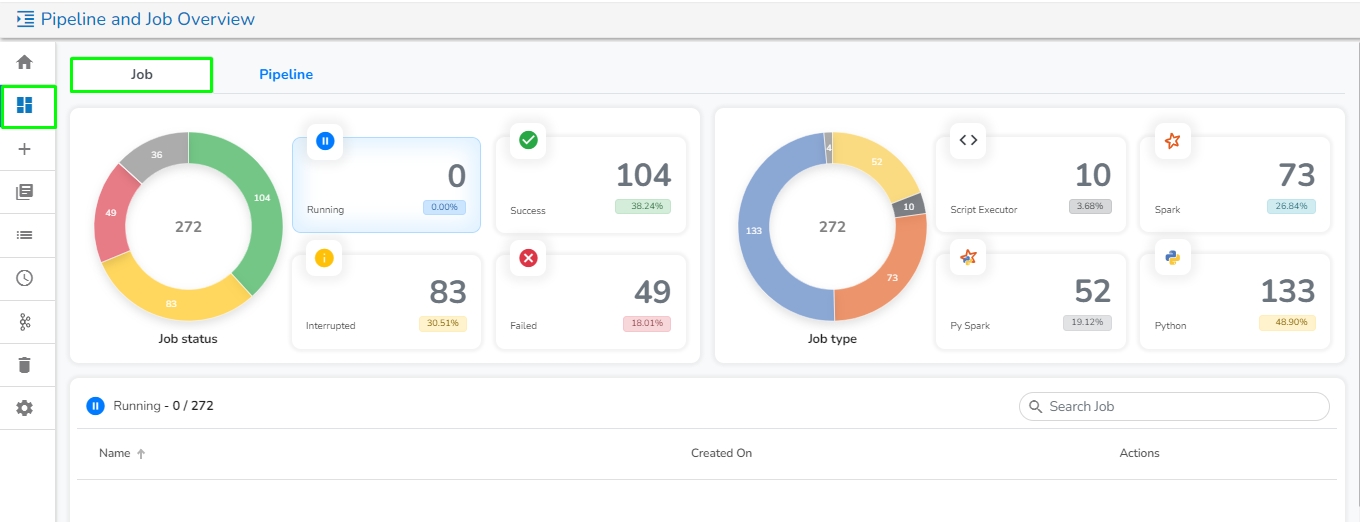
This tab will open by default once the user navigates to the Pipeline and Job Overview page. It contains the following information of the Jobs in graphical format:
Job Status:
This section displays the total number of Jobs created along with their count and percentage in a tile manner the following different running status :
Running: This section displays the number and total percentage of running jobs.
Success: This section displays the number and total percentage of successfully ran jobs.
Interrupted: This section displays the number and total percentage of interrupted jobs.
Failed: This section displays the number and total percentage of failed jobs.
Once the user clicks on any of the status, it will list down all the jobs related to that particular category along with the following option:
View: Redirects the user to the selected job workspace.
Monitor: Redirects the user to the for the selected job.
Job Type:
It displays the total number and percentage of jobs created for the following categories in the graphical format:
This page shows a summary of Pipelines in a graphical manner.
Please go through the below given demonstration for the Pipeline Overview page.
This page contains the following information of the Pipelines in the graphical format:
This section displays the total number of pipelines created along with their count and percentage in a tile manner for the following different running statuses:
Running: Displays the number and total percentage of running pipelines.
Success: Displays the number and total percentage of successfully executed pipelines.
Ignored:
It displays the total number and percentage of pipeline created for the following resource type in the graphical format:
Low
Medium
High
Components are broadly classified into:
Component Panel
Expand component group and select
Search using the search bar in the component panel
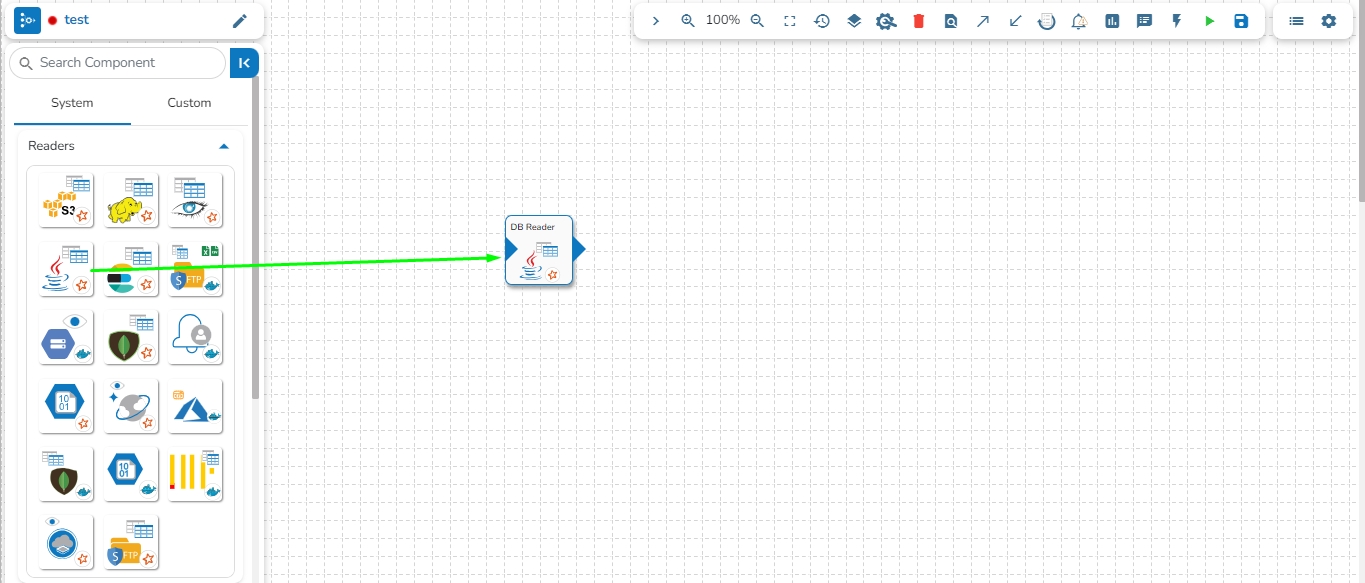
Drag and Drop the components to the workflow editor.
Any Pipeline System component can be easily dragged to the workflow it includes the following steps to use a System component in the Pipeline Workflow editor:
Drag and Drop the components to the workflow editor.
Search using the search bar in the component panel
Expand component group and select
Check out the illustration on how to use a system pipeline component.
Clicking on the Update icon allows users to save the pipeline. It is recommended to update the pipeline every time you make changes in the workflow editor.
On a successful update of the pipeline, you get a notification as given below:
Users can update the version of the used pipeline components through this icon.
This option allows us to update the Pipeline components to their latest versions.
Navigate to the Pipeline Editor page.
Click the Update Component Version icon. The icon will display a red dot indicating that an updated component version is available for the selected pipeline workflow.
A confirmation dialog box appears.
Click the YES option.
A notification message appears to confirm that the component version is updated.
The Update Component Version gets disabled to indicate that all the pipeline components are up to date.
This feature allows users to update the older version of the component with the latest version in the pipeline.
Follow the below given steps to update the component version in the pipeline:
Navigate to the pipeline toolbar panel.
Click on the Update Component Version option.
After clicking on the option, all components with older versions in the pipeline will be updated to the latest version. A success message will appear stating, "Components Version Updated Successfully".
A message will appear stating, "All components are up to date, no updates available" if all components already have the latest version.
The user can delete their pipeline using this feature, accessible from either the List Pipelines page or the Pipeline Workflow Editor page.
Navigate to the Pipeline Workflow Editor page.
Click the Delete icon.
A dialog box opens to assure the deletion.
Select the YES option.
A notification message appears.
The user gets redirected to the Pipeline List page and the selected Pipeline gets removed from the Pipeline List.
This page provides an overview of all the components used in the pipeline in a single place.
The Pipeline Overview feature enables users to view and download comprehensive information about all the components used in the selected pipeline on a single page. Users can access meta information, resource configuration, and other details directly from the pipeline overview page, streamlining the process of understanding and managing the components associated with the pipeline.
Check out the given demonstration to understand the Pipeline Overview page.
The user can access the Pipeline Overview page by clicking the Pipeline Overview icon as shown in the below given image:
Component List: All the components used in the pipeline will be listed here.
Creation Date: Date and time when the pipeline created.
Download: The Download option enables users to download all the information related to the pipeline. This comprehensive download includes details such as all components used in the pipeline, meta information, resource configuration, component deployment type, and more.
Edit:
Data pipelines are used to ingest and transfer data from different sources, transform unify and cleanse so that it’s suitable for analytics and business reporting.
“It is a collection of procedures that are carried either sequentially or even concurrently when transporting data from one or more sources to destination. Filtering, enriching, cleansing, aggregating, and even making inferences using AI/ML models may be part of these pipelines”.
Data pipelines are the backbone of the modern enterprise, Pipelines move, transform and store data so that enterprise can generate/take decision without delays. Some of these decisions are automated via AI/ML models in real-time.
This task is used to read the data from the following databases: MYSQL, MSSQL, Oracle, ClickHouse, Snowflake, PostgreSQL, Redshift.
Drag the DB reader task to the Workspace and click on it to open the related configuration tabs for the same. The Meta Information tab opens by default.
This feature helps the user to search a specific component across all the existing pipelines. The user can drag the required components to the pipeline editor to create a new pipeline workflow.
Click the Search Component in pipelines icon from the header panel of the Pipeline Editor.
The Object Browser window opens displaying all the existing pipeline workflows.
HDFS stands for Hadoop Distributed File System. It is a distributed file system designed to store and manage large data sets in a reliable, fault-tolerant, and scalable way. HDFS is a core component of the Apache Hadoop ecosystem and is used by many big data applications.
This task reads the file located in HDFS (Hadoop Distributed File System).
Drag the HDFS reader task to the Workspace and click on it to open the related configuration tabs for the same. The Meta Information tab opens by default.
The Full Screen icon presents the Pipeline Editor page in the full screen.
Navigate to the Pipeline Workflow Editor page.
Click the Full Screenicon from the toolbar.
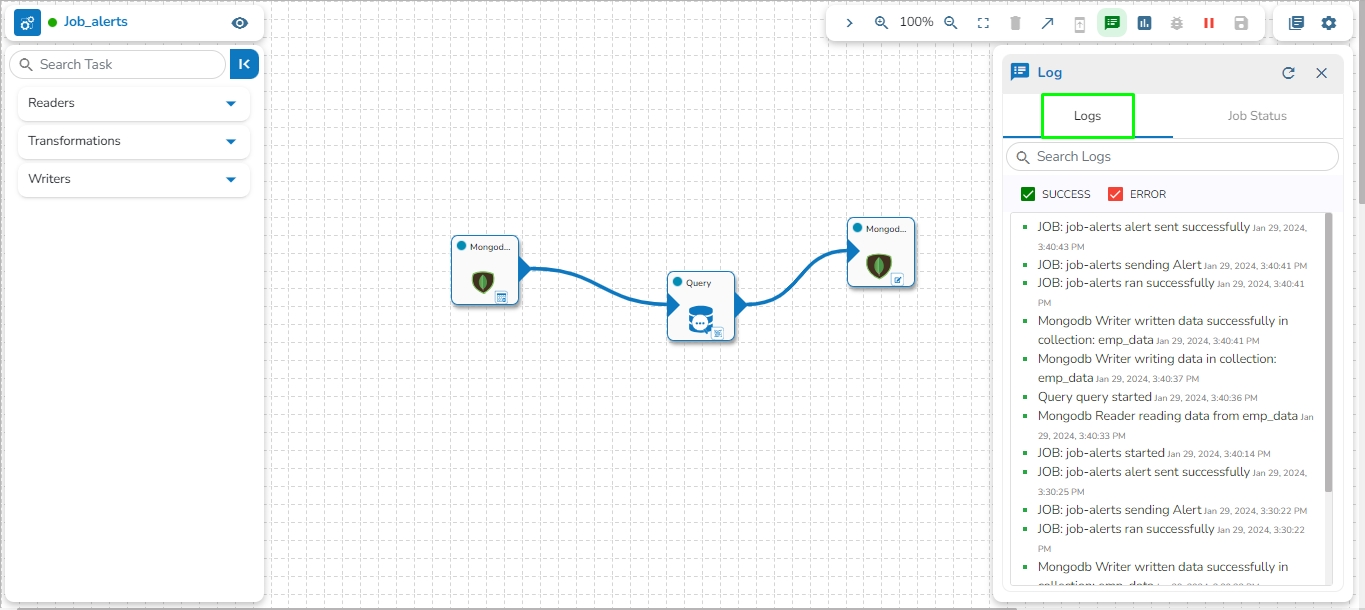
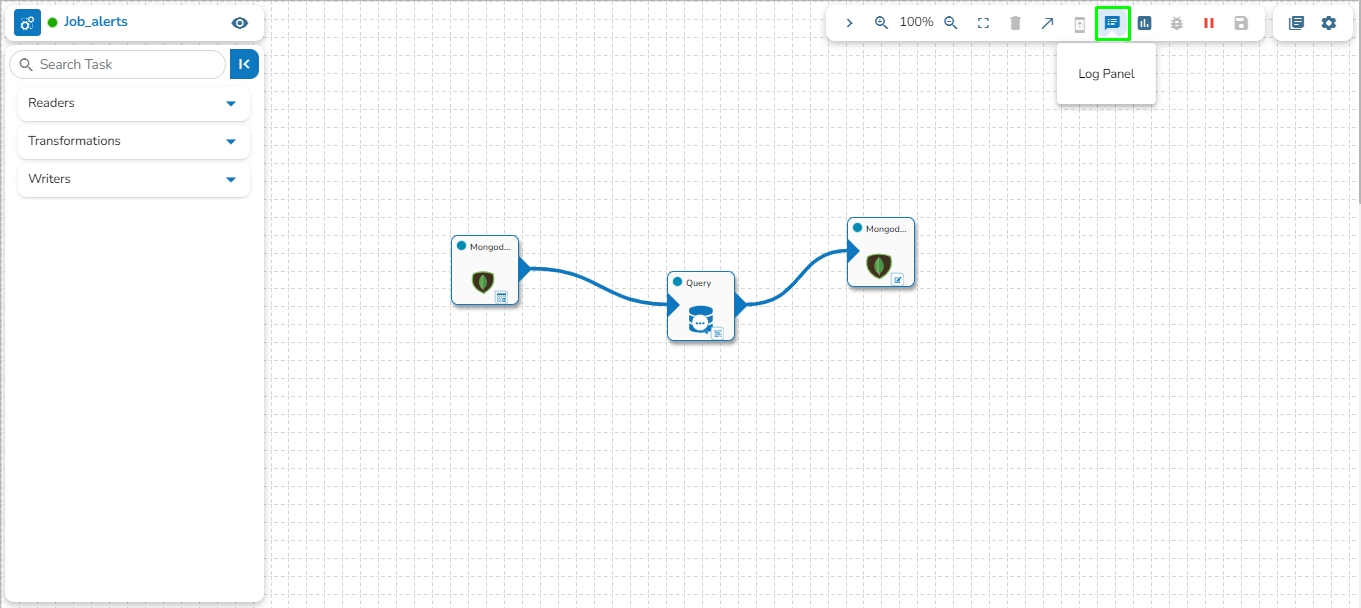
The Toggle Log Panel displays the Logs and Component Status tabs for the Pipeline/Job Workflows.
Navigate to the Pipeline Editor page.
Make sure the Pipeline is in the active state (Activate the Pipeline).
Arrange the components used in the Pipeline/Job Workflow.
This feature enables users to arrange the components/tasks used in the Pipeline/Job in a formatted manner.
Please see the given video to understand the Format Flowchart option.
Follow these steps to format flowchart in the pipeline:
Go to the pipeline toolbar and click on Show Options to expand the toolbar.
A way to scale up the processing speed of components.
A feature to scale your component to the max number of instances to reduce the data processing lag automatically. This feature detects the need to scale up the components in case of higher data traffic.
All components have option of Intelligent scaling which is ability of the system to dynamically adjust the scale or capacity of the reader component based on the current demand and available resources. It involves automatically optimizing the resources allocated to the component to ensure efficient and effective processing of tasks.


Low
Medium
High
Once the user clicks on any of the job type, it will list down all the jobs related to that particular job type along with the following option:
View: Redirects the user to the selected job workspace.
Monitor: Redirects the user to the monitoring page for the selected job.
Failed: Displays the number and total percentage of pipelines where failure has occurred.
Once the user clicks on any of the status, it will list down all the pipelines related to that particular category along with the following option:
View: Redirects the user to the selected pipeline workspace.
Monitor: Redirects the user to the monitoring page for the selected pipeline.
Once the user clicks on any of the resource type, it will list down all the pipelines related to that particular resource type along with the following option:
View: Redirects the user to the selected job workspace.
Monitor: Redirects the user to the for the selected job.
In the pipeline overview page, components are listed based on their hierarchical level, denoted by Levels 0 and 1. A component at level 1 indicates a dependency on the data from the preceding component, where the previous component serves as the Parent Component. For components without dependencies, designated as Level 0, their Parent Component is set to None, signifying no connection to any previous component in the pipeline.
It can handle both Streaming and batch data seamlessly. The Data pipeline offers an extensive list of data processing components that help you automate the entire data workflow, Ingestion, transformations, and running AI/ML models.
Readers: Your repository of data can be a reader for you. It could be a database, a file, or a SaaS application. Read Readers.
Connecting Components: The component that pulls or receives data from your source can be events/ connecting components for you. These Kafka-based messaging channels help to create a data flow. Read Connecting Components.
Writers: The databases or data warehouses to which the Pipelines load the data. Read Writers.
Transforms: The series of transformation components that help to cleanse, enrich, and prepare data for smooth analytics. Read .
Producers: Producers are the components that can be used to produce/generate streaming data to external sources. Read .
Machine Learning: The Model Runner components allow the users to use the models created on the Python workspace of the Data Science Workbench or saved models from the Data Science Lab to be consumed in a pipeline. Read .
Consumers: These are the real-time / Streaming component that ingests data or monitor for changes in data objects from different sources to the pipeline. Read .
Alerts: These components facilitate user notification on various channels like Teams, Slack, and email based on their preferences. Notifications can be delivered for success, failure, or other relevant events, depending on the user's requirement. Read .
Scripting: The Scripting components allow users to write custom scripts and integrate them into the pipeline as needed. Read .
Scheduler: The Scheduler component enables users to schedule their pipeline at a specific time according to their requirements.
Standard
SRV
Connection String
Port (*): Provide the Port number (It appears only with the Standard connection type).
Host IP Address (*): The IP address of the host.
Username (*): Provide a username.
Password (*): Provide a valid password to access the MongoDB.
Database Name (*): Provide the name of the database where you wish to write data.
Additional Parameters: Provide details of the additional parameters.
Schema File Name: Upload Spark Schema file in JSON format.
Save Mode: Select the Save mode from the drop down.
Append: This operation adds the data to the collection.
Ignore: "Ignore" is an operation that skips the insertion of a record if a duplicate record already exists in the database. This means that the new record will not be added, and the database will remain unchanged. "Ignore" is useful when you want to prevent duplicate entries in a database.
Upsert: It is a combination of "update" and "insert". It is an operation that updates a record if it already exists in the database or inserts a new record if it does not exist. This means that "upsert" updates an existing record with new data or creates a new record if the record does not exist in the database.
Port: Enter the port for the given IP Address.
Database name: Enter the Database name.
Table name: Provide a single or multiple table names. If multiple table name has be given, then enter the table names separated by comma(,).
User name: Enter the user name for the provided database.
Password: Enter the password for the provided database.
Driver: Select the driver from the drop down. There are 7 drivers supported here: MYSQL, MSSQL, Oracle, ClickHouse, Snowflake, PostgreSQL, Redshift.
Fetch Size: Provide the maximum number of records to be processed in one execution cycle.
Create Partition: This is used for performance enhancement. It's going to create the sequence of indexing. Once this option is selected, the operation will not execute on server.
Partition By: This option will appear once create partition option is enabled. There are two options under it:
Auto Increment: The number of partitions will be incremented automatically.
Index: The number of partitions will be incremented based on the specified Partition column.
Query: Enter the spark SQL query in this field for the given table or table(s). Please refer the below image for making query on multiple tables.
The user can search a component using the Search Component space.
The user gets prompt suggestions while searching for a component.
Once the component name is entered, the pipeline workflows containing the searched component get listed below.
The user can click the expand/ collapse icon to expand the component panel for the selected pipeline.
The user can drag a searched component from the Object Browser and drop to the Pipeline Editor canvass.
Host IP Address: Enter the host IP address for HDFS.
Port: Enter the Port.
Zone: Enter the Zone for HDFS. Zone is a special directory whose contents will be transparently encrypted upon write and transparently decrypted upon read.
File Type: Select the File Type from the drop down. The supported file types are:
CSV: The Header and Infer Schema fields get displayed with CSV as the selected File Type. Enable Header option to get the Header of the reading file and enable Infer Schema option to get true schema of the column in the CSV file.
JSON: The Multiline and Charset fields get displayed with JSON as the selected File Type. Check-in the Multiline option if there is any multiline string in the file.
PARQUET: No extra field gets displayed with PARQUET as the selected File Type.
AVRO: This File Type provides two drop-down menus.
Compression: Select an option out of the Deflate and Snappy options.
Compression Level: This field appears for the Deflate compression option. It provides 0 to 9 levels via a drop-down menu.
XML: Select this option to read XML file. If this option is selected, the following fields will get displayed:
Infer schema: Enable this option to get true schema of the column.
Path: Provide the path of the file.
Path: Provide the path of the file.
Partition Columns: Provide a unique Key column name to partition data in Spark.
The Pipeline Workflow Editor opens in full screen and the icon changes toicon.
A Log panel toggles displaying the collective component logs of the pipeline/Job under the Logs tab.
Select the Component Status tab from the Log panel to display the status of the component containers. By selecting the Open All option, it will list all the components.
Select the Job Status tab from the Log panel to display the status of the pod of the selected Job.
This feature provides the capability to kill all Orphan Pods associated with any component in the pipeline/Jobs if they persist after deactivation. Orphan Processes are the processes that remain active in the backend even after deactivating the pipeline.
The user can access the Kill Orphan Processes option under the Component Status tab of the Log Panel.
The Component Panel displays categorized list of all the pipeline components. The Components are majorly divided into two groups:
System
Custom
System Components- The pre-designed pipeline components are listed under the System tab.
Custom Components- The Custom tab lists all the customized pipeline components created by the user.
The Component gets grouped based on the Component type. E.g., All the reader components are provided under the Reader menu tab of the Component Pallet.
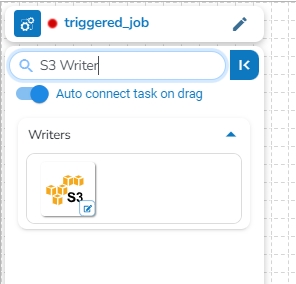
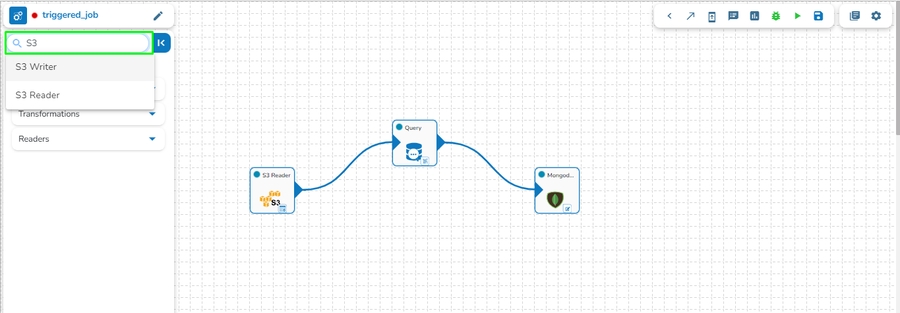
A search bar is provided to search across the 50+ components. It helps to find a specific component by inserting the name in the Search Bar.
Navigate to the Search bar provided in the Component Pallet.
Type in the given search bar.
The user gets prompt suggestions for the searched components. E.g., While searching hd, it lists HDFS Reader and HDFS Writer components.
Select an option from the prompted choices.
The searched component appears under the System tab. (E.g., HDFS Writer component as displayed in the below image).
Click on the Format Flowchart option to arrange the pipeline in the formatted way.
Please Note:
If you have selected intelligent scaling option make sure to give enough resources to component so that it can auto-scale based on the load.
Components will scale up if there is a lag of more than 60% and if the lag goes less than 10% component pods will automatically scale down. This lag percentage is configurable.
Adding components to a pipeline workflow.
Check out the below given walk-through to add components to Pipeline Workflow editor canvas.
The Component Pallet is situated on the left side of the User Interface on the Pipeline Workflow. It has the System and Custom components tabs listing the various components.
The System components are displayed in the below given image:
Once the Pipeline gets saved in the pipeline list, the user can add components to the canvas. The user can drag the required components to the canvas and configure it to create a Pipeline workflow or Data flow.
Navigate to the existing data pipeline from the List Pipelines page.
Click the View icon for the pipeline.
The Pipeline Editor opens for the selected pipeline.
Drag and drop the new required components or make changes in the existing component’s meta information or change the component configuration (E.g., the DB Reader is dragged to the workspace in the below-given image).
Once dragged and dropped to the pipeline workspace, components can be directly connected to the nearest Kafka Event. To enable the auto-connect feature, the user needs to ensure that the Auto connect event on drag option is enabled, which is the default setting.
Click on the dragged component and configure the Basic Information tab, which opens by default.
Open the Meta Information tab, which is next to the Basic Information tab, and configure it.
Make sure to click the Save Component in Storage icon to update the component details and pipeline to reflect the recent changes in the pipeline. (The user can drag and configure other required components to create the Pipeline Workflow.
Click the Update Pipeline icon to save the changes.
A success message appears to assure that the pipeline has been successfully updated.
This task reads the file from Amazon S3 bucket.
Please follow the below mentioned steps to configure meta information of S3 reader task:
Drag the S3 reader task to the Workspace and click on it to open the related configuration tabs for the same. The Meta Information tab opens by default.
Bucket Name (*): Enter S3 bucket name.
Region (*): Provide the S3 region.
Access Key (*): Access key shared by AWS to login..
Secret Key (*): Secret key shared by AWS to login
Table (*): Mention the Table or object name which is to be read
File Type (*): Select a file type from the drop-down menu (CSV, JSON, PARQUET, AVRO, XML are the supported file types)
Limit: Set a limit for the number of records.
Query: Insert an SQL query (it supports query containing a join statement as well).
Access Key (*): Access key shared by AWS to login
Secret Key (*): Secret key shared by AWS to login
Table (*): Mention the Table or object name which has to be read
File Type (*):
Provide a unique Key column name to partition data in Spark.
The Data Channel & Cluster Events page presents a comprehensive list of all Broker Info, Consumer Info, Topic Info, Kafka Version, and all the events used in the pipeline. It allows users to flush/delete the events.
Go through the below-given demonstration for the Data Chanel & Cluster Event page.
Navigate to the Pipeline Homepage.
Click the Data Channel & Cluster Events icon.
The Data Channel & Cluster Events page opens.
The list opens displaying the Data Channel & Cluster Events information.
The Data Channel includes the following information:
Broker Info: It will list all Kafka brokers and display the number of partitions used for each broker.
Consumer Info: It will display the number of active and rebalancing consumers.
Topic Info: It will display the number of topics.
Version information: It will display the Kafka version.
The Clustered Events page includes the following information:
On this page, all the pipelines will be listed along with the following details:
Pipeline Name: The name of the pipeline.
Number of Events: The number of Kafka events created in the selected pipeline.
Status: The running status of the pipeline, indicated by Green if active and Red otherwise.
Expand for Events: Click here to expand the selected row for a particular pipeline. This will list all Kafka events associated with the chosen pipeline along with the following information:
The user gets two options to apply to the listed Kafka events for the pipeline:
Flush All: This will flush all topic data in the selected pipeline.
Delete All: This will delete all topics in the selected pipeline.
Once the user clicks on the Event Name after expanding the row for the selected pipeline, the following information will be displayed on the new page for the selected Kafka Event:
This tab contains the following information for the selected Kafka Event:
Partitions: The number of partitions in the Kafka Event.
Replication Factor: Displays the replication factor of the Kafka topic. This refers to the number of copies of a Kafka topic's data maintained across different broker nodes within the Kafka cluster, ensuring high availability and fault tolerance data.
Sync Replicas: Displays the number of in-sync replicas of the Kafka topic. In-sync replicas (ISRs) are a subset of replicas fully synchronized with the leader replica for a partition. These replicas have the latest data as the leader and are capable of taking over as the leader if the current leader fails.
Additionally, this tab lists all the partition details along with their start and end offset, the number of messages in each partition, the number of replicas for each partition, and the size of the messages held by each partition.
This tab contains the following information for the selected Kafka Event:
Offset: Shows the offset number of the partition. An offset is a unique identifier assigned to each message within a partition.
Partitions: Displays the partition number where the offset belongs.
Time: It mentions the date and time of the message when it was stored at the offset.
Preview: This option helps the user to view and copy the message stored at the selected offset.
This tab shows details of consumers connected to Kafka Topic.
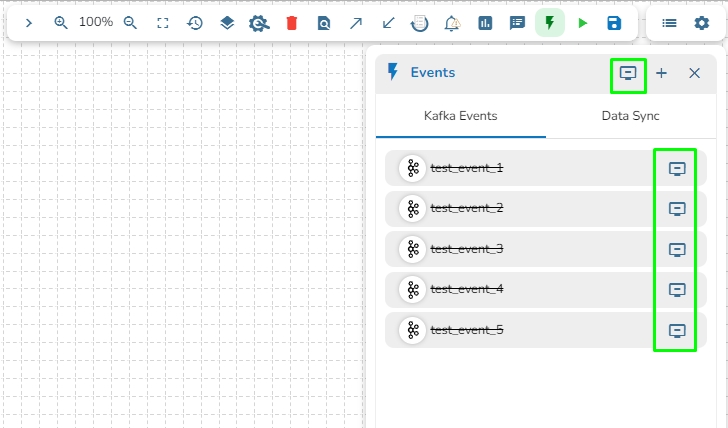
The user can access the Event Panel to create a new Event. We have two options in the Toggle Event Panel:
Private (Event/ Kafka Topic)
Data Sync
The user can create an Event (Kafka Topic) that can be used to connect two pipeline components.
Navigate to the Pipeline Editor page.
Click the Event Panel icon.
The Event panel opens.
Click the Add New Event icon.
The New Event dialog box opens.
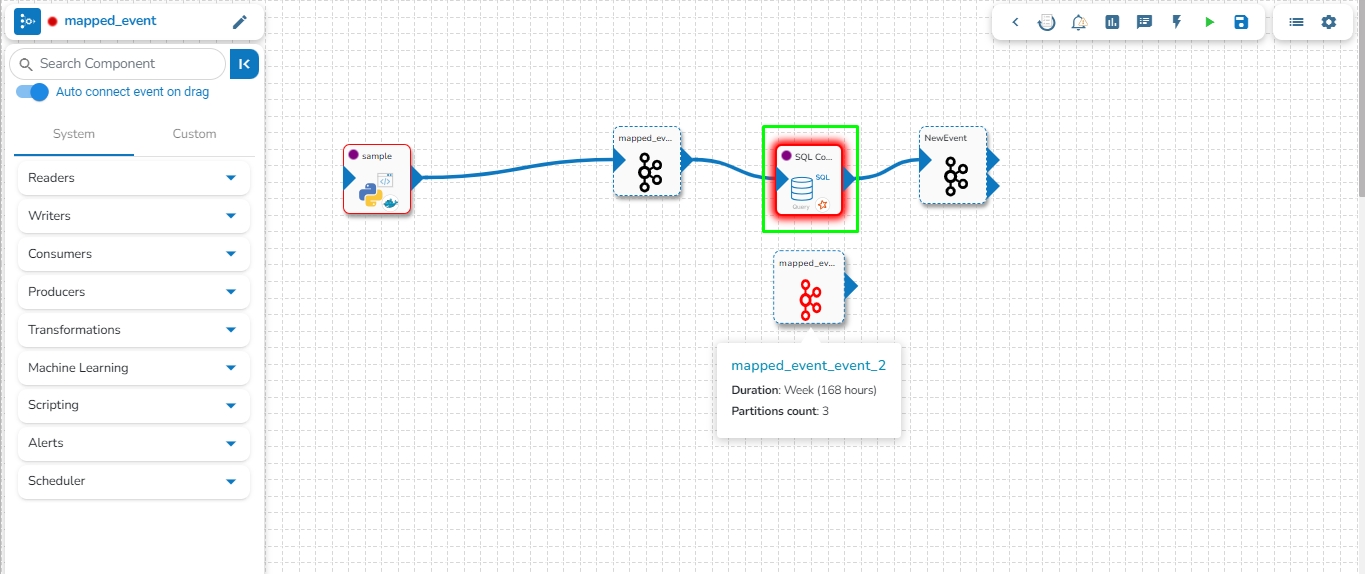
Enable the Event Mapping option to map the Event.
Provide the required information.
A confirmation message appears.
The new Event gets created and added to the Event Panel.
Drag and drop the Event from the Event Panel to the workflow editor.
You can drag a pipeline component from the
Connect the dragged component to the dragged Event to create a pipeline flow of data.
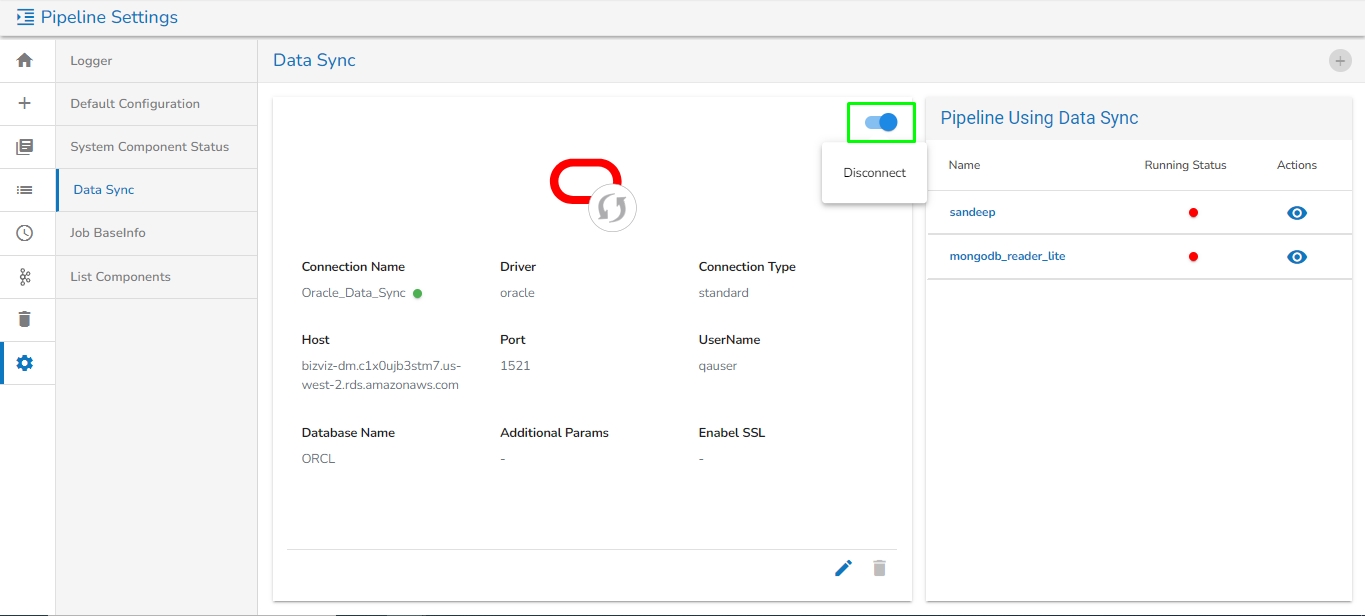
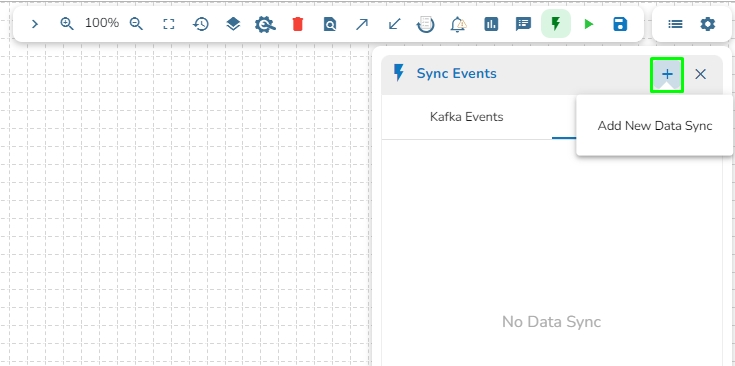
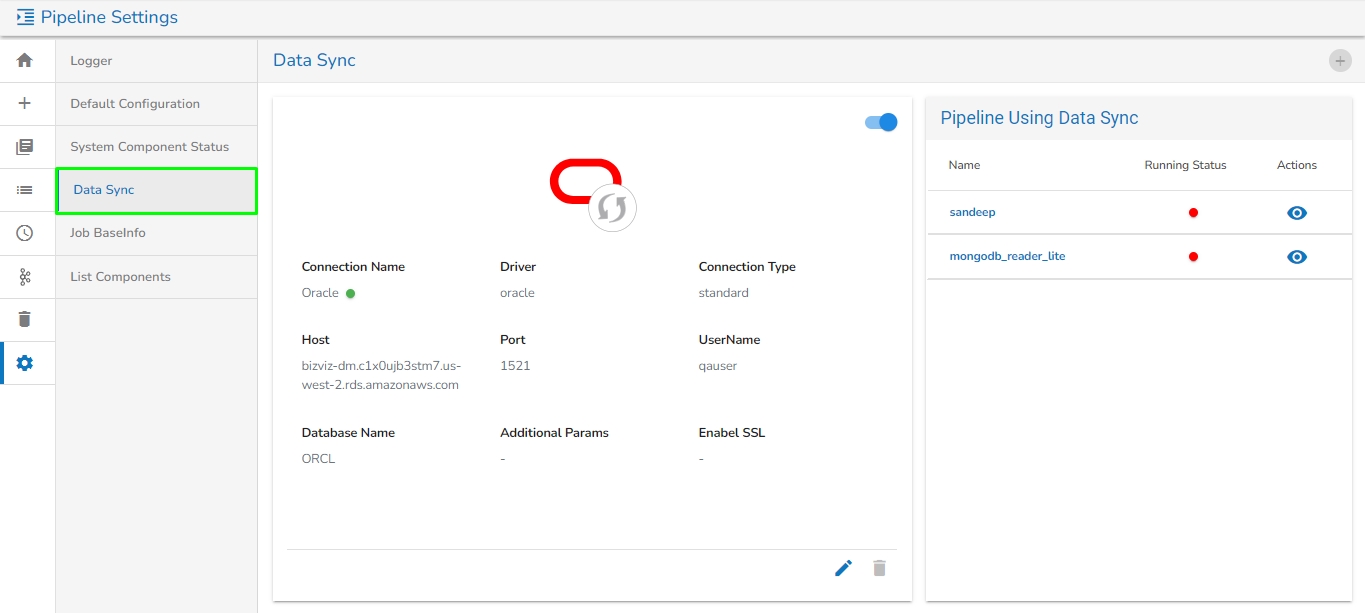
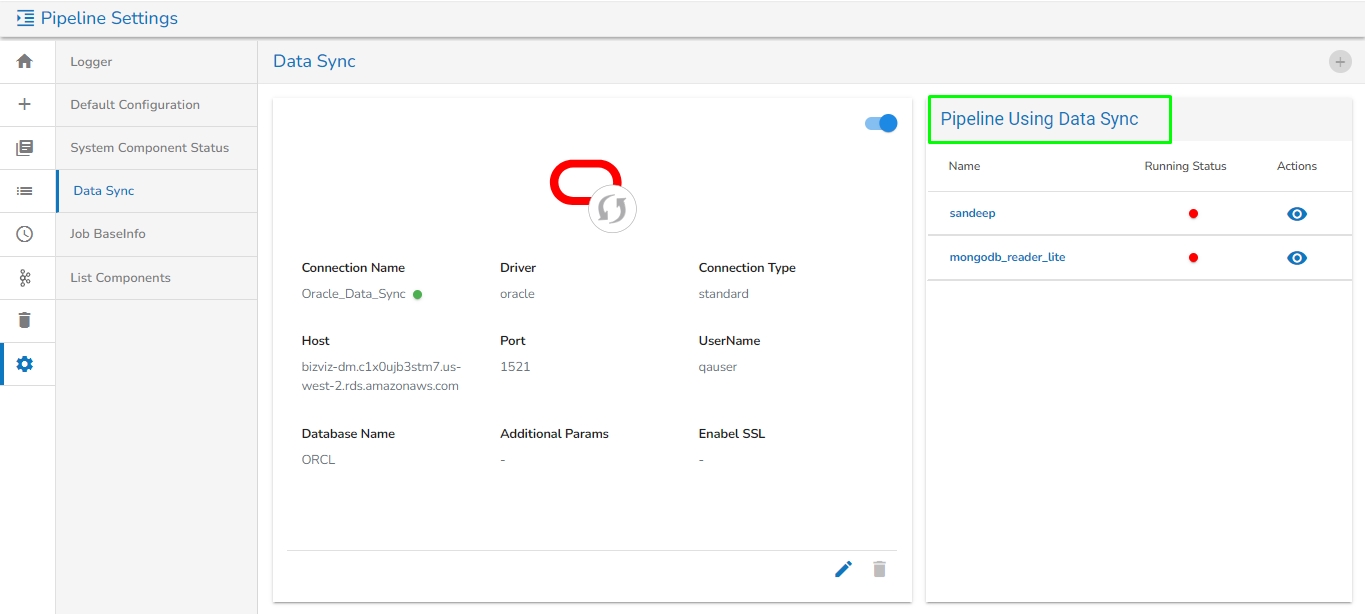
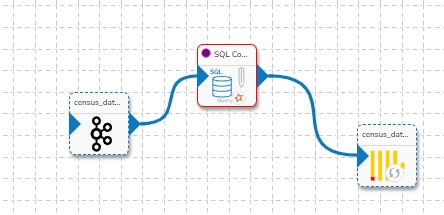
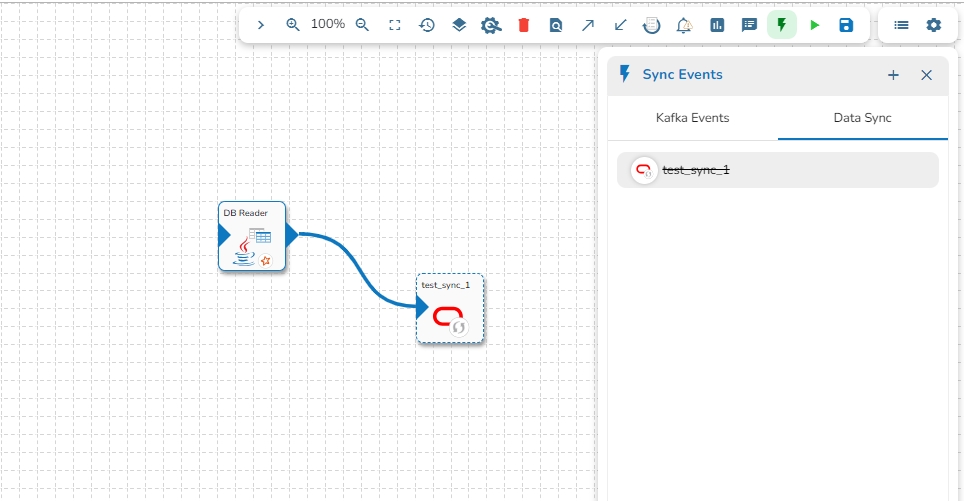
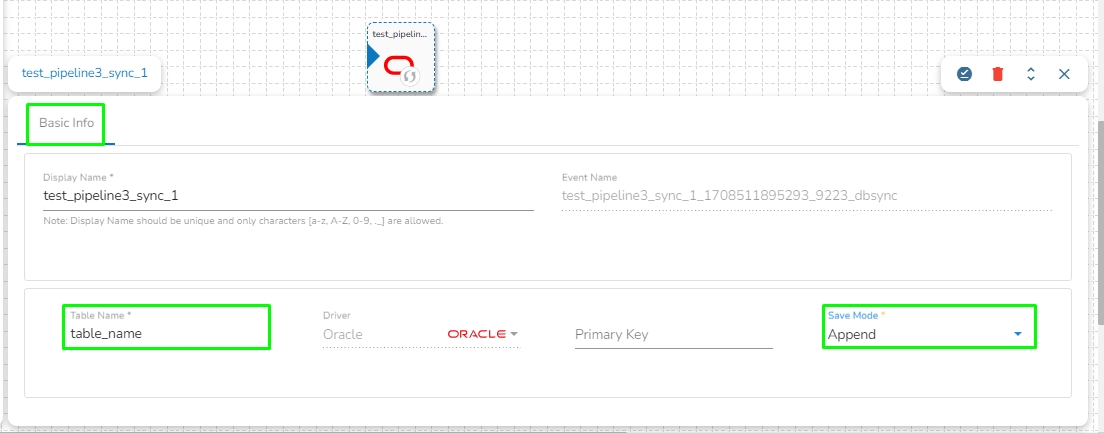
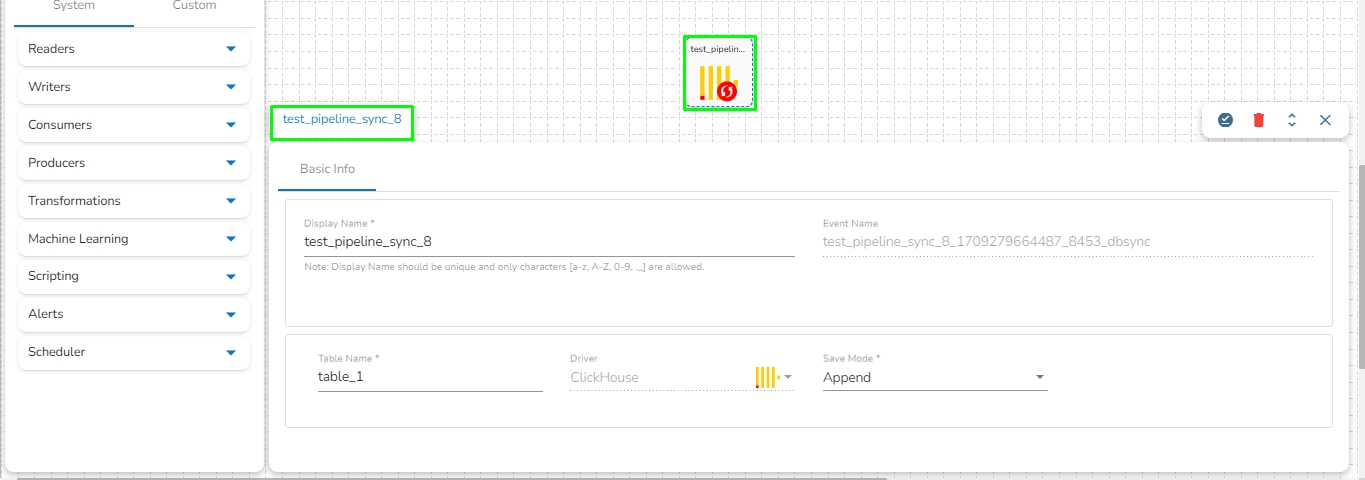
The user can directly read the data with the reader and write to a Data Sync.
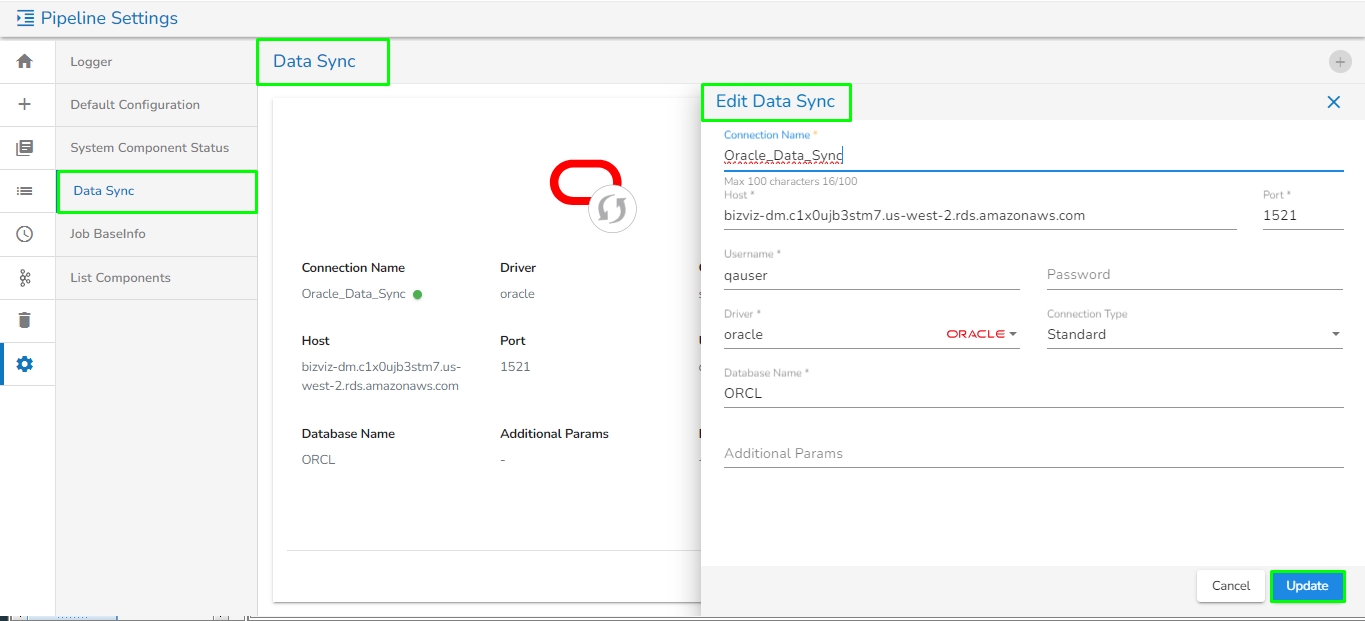
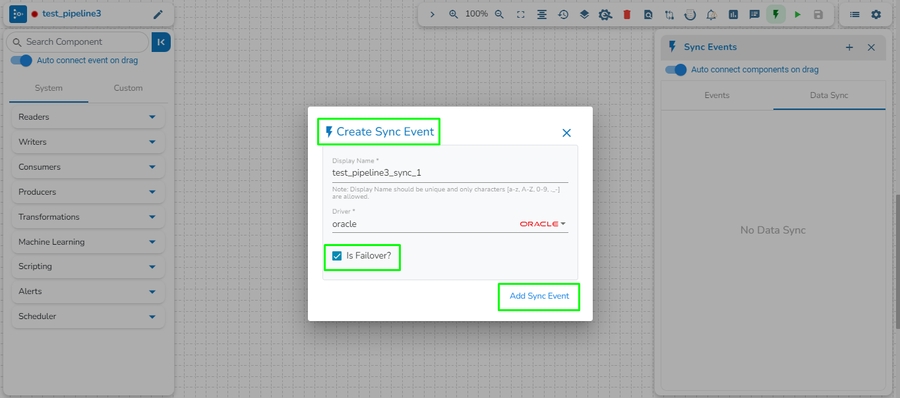
The user can add a new Data Sync from the toggle event panel to the workflow editor by clicking on ‘+’ icon.
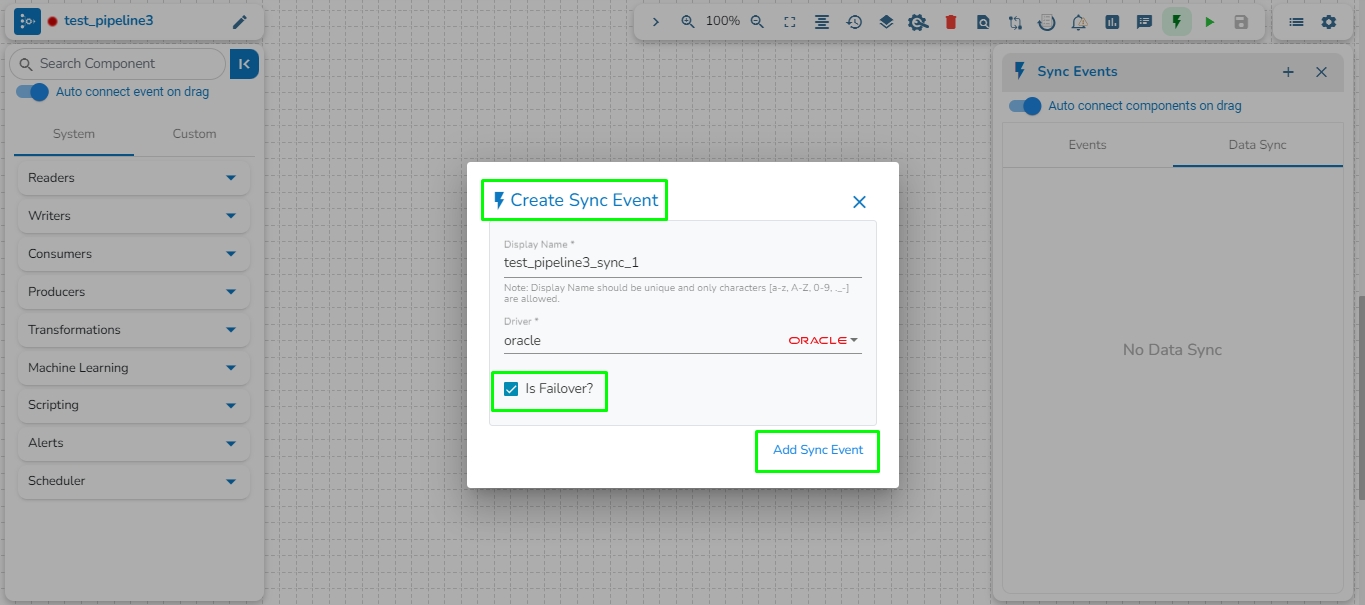
Specify the display name and connection id and click on save.
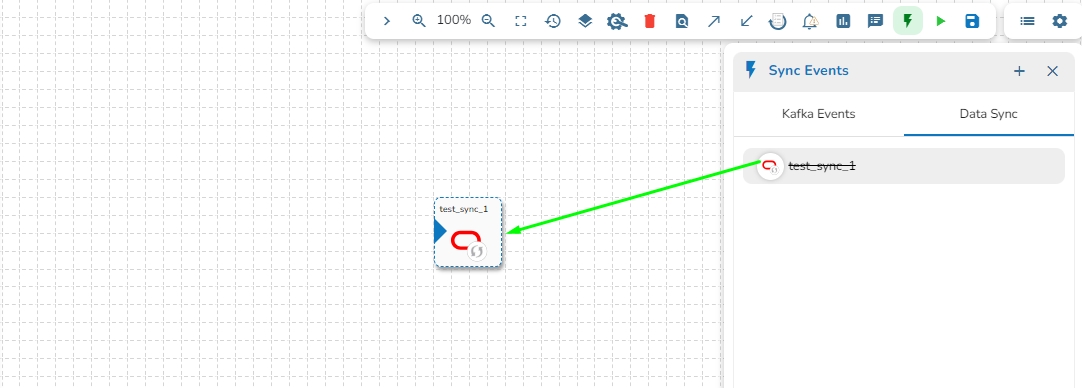
Drag and drop the Data Sync from event panel to workflow editor.
The feature that allows users to configure all the components of a pipeline on a single page is available on the list pipeline page. With this feature, users no longer have to click on each individual component to configure it. By having all the relevant configuration options on a single page, this feature reduces the time and number of clicks required to configure the pipeline components.
Click the Pipeline Component Configuration icon from the header panel of the Pipeline Editor. The user can either access this option form the pipeline tool or from the list pipeline page.
All the components used in the selected pipeline will be listed on the configuration page.
There will the following information displayed at the top of Pipeline Component Configuration page.
Pipeline: Name of the pipeline.
Status: It indicates the running status of the pipeline. 'True' indicates the Pipeline is active, while 'False' indicates inactivity.
The user will find two tabs on the Configuration Page:
Basic Info
Configuration
In the Basic Info tab, the user can configure basic information for the components such as invocation type, batch size, description, or intelligent scaling.
On the Configuration tab, the user can provide resources such as Memory and CPU to the components, as well as set the number of minimum and maximum instances for the components.
SFTP Reader is designed to read and access files stored on an SFTP server. SFTP readers typically authenticate with the SFTP server using a username and password or SSH key pair, which grants access to the files stored on the server
All component configurations are classified broadly into the following sections:
Meta Information
Please follow the demonstration to configure the SFTP Reader and its meta information.
Please go through the below given steps to configure SFTP Reader component:
Host: Enter the host.
Username: Enter username for SFTP reader.
Port: Provide the Port number.
Dynamic Header: It can automatically detect the header row in a file and adjust the column names and number of columns as necessary.
This page pays attention to describe the Basic Info tab provided for the pipeline components. This tab has to be configured for all the components.
The Invocation-Type config decides the type of deployment of the component. There are following two types of invocations:
Real-Time
Batch
When the Component has the real-time invocation, the component never goes down when the pipeline is active. This is for situations where you want to keep the component ready all the time to consume data.
When "Realtime" is selected as the invocation type, we have an additional option to scale up the component called "Intelligent Scaling."
Please refer to the following page to learn more about .
When the component has the batch invocation type then the component needs a trigger to initiate the process from the previous event. Once the process of the component is finished and there are no new events to process the component goes down.
These are really helpful in Batch or scheduled operations where the data is not streaming or real-time.
The pipeline components process the data in micro-batches. This batch size is given to define the maximum number of records that you want to process in a single cycle of operation; This is really helpful if you want to control the number of records being processed by the component if the unit record size is huge. You can configure it in the base config of the components.
The below given illustration displays how to update the Batch Size configuration.
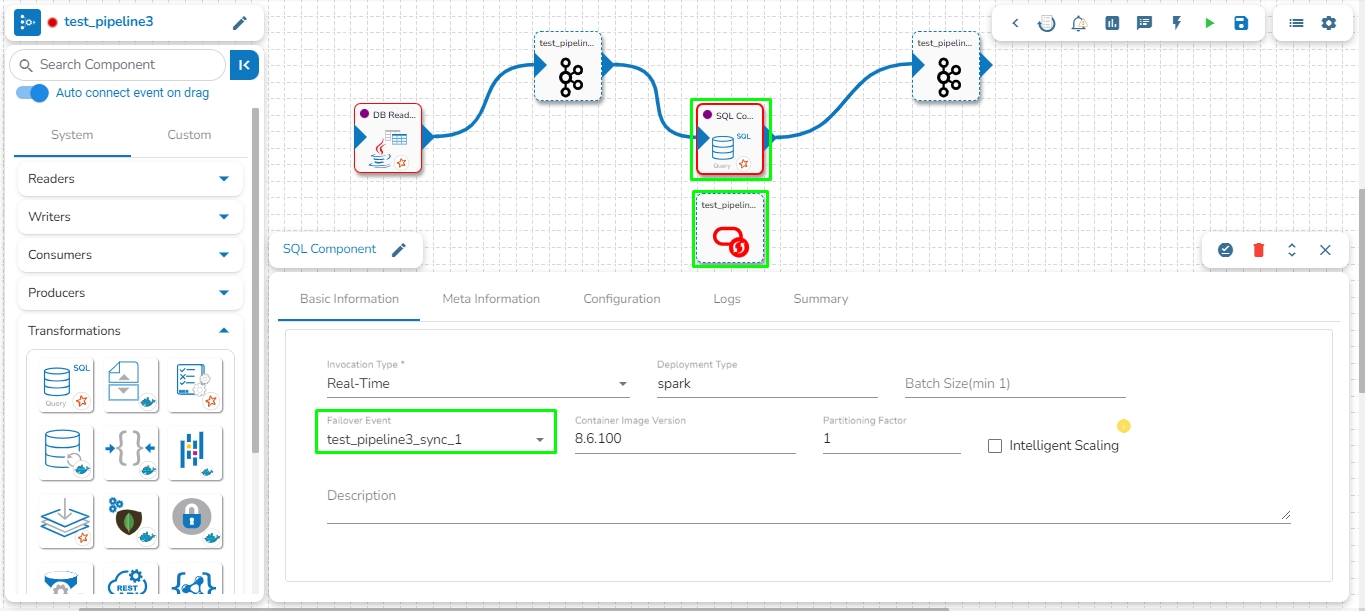
We can create a failover event and map it in the component base configuration, so that if the component fails it audits all the failure messages with the data (if available) and timestamp of the error.
Go through the illustration given below to understand the Failover Events.
An Elasticsearch reader component is designed to read and access data stored in an Elasticsearch index. Elasticsearch readers typically authenticate with Elasticsearch using username and password credentials, which grant access to the Elasticsearch cluster and its indexes.
All component configurations are classified broadly into the following sections:
Meta Information
Please follow the given demonstration to configure the component.
Host IP Address: Enter the host IP Address for Elastic Search.
Port: Enter the port to connect with Elastic Search.
Index ID: Enter the Index ID to read a document in Elasticsearch. In Elasticsearch, an index is a collection of documents that share similar characteristics, and each document within an index has a unique identifier known as the index ID. The index ID is a unique string that is automatically generated by Elasticsearch and is used to identify and retrieve a specific document from the index.
The Register Feature enables users to directly create jobs from DsLab notebook. Using this feature, users can create the following types of jobs:
Amazon Athena is an interactive query service that easily analyzes data directly in Amazon Simple Storage Service (Amazon S3) using standard SQL. With a few actions in the AWS Management Console, you can point Athena at your data stored in Amazon S3 and begin using standard SQL to run ad-hoc queries and get results in seconds.
Athena Query Executer task enables users to read data directly from the external table created in AWS Athena.
Please Note: Please go through the below given demonstration to configure Athena Query Executer in Jobs.
The Alert feature in the job allows users to send an alert message to the specified channel (Teams or Slack) in the event of either the success or failure of the configured job. Users can also choose both success and failure options to send an alert for the configured job.
Webhook URL: Provide the Webhook URL of the selected channel group where the Alert message needs to be sent.
Write Python scripts and run them flawlessly in the Jobs.
This feature allows users to write their own Python script and run their script in the Jobs section of Data Pipeline module.
Before creating the Python Job, the user has to create a project in the Data Science Lab module under Python Environment. Please refer the below image for reference:
After creating the Data Science project, the users need to activate it and create a Notebook where they can write their own Python script. Once the script is written, the user must save it and export it to be able to use it in the Python Jobs.
This section provides detailed information on the Jobs to make your data process faster.
Jobs are used for ingesting and transferring data from separate sources. The user can transform, unify, and cleanse data to make it suitable for analytics and business reporting without using the Kafka topic which makes the entire flow much faster.
Check out the given demonstration to understand how to create and activate a job.
Navigate to the Data Pipeline homepage.
There is a resource configuration tab while configuring the components.
The Data Pipeline contains an option to configure the resources i.e., Memory & CPU for each component that gets deployed.
There are two types of components-based deployment types:
Docker
Spark
The Failure Analysis page allows users to analyze the reasons for the failure of the component used in the pipeline.
Check out the below given walk-through for failure analysis in the Pipeline Workflow editor canvas.
Navigate to the Pipeline Editor page.



Row Tags: Provide the row tags from the XML files.
Join Row Tags: Enable this option to join multiple row tags.
A dialog window opens to confirm the action of pipeline activation.
Click the YES option to activate the pipeline.
A success message appears confirming the activation of the pipeline.
Another success message appears to confirm that the pipeline has been updated.
The Status for the pipeline gets changed on the Pipeline List page.
Limit: Set limit for the number of records
Query: Insert an SQL query (it supports query containing a join statement as well)
CSV: The Header and Infer Schema fields get displayed with CSV as the selected File Type. Enable Header option to get the Header of the reading file and enable Infer Schema option to get true schema of the column in the CSV file.
JSON: The Multiline and Charset fields get displayed with JSON as the selected File Type. Check-in the Multiline option if there is any multiline string in the file.
PARQUET: No extra field gets displayed with PARQUET as the selected File Type.
AVRO: This File Type provides two drop-down menus.
Compression: Select an option out of the Deflate and Snappy options.
Compression Level: This field appears for the Deflate compression option. It provides 0 to 9 levels via a drop-down menu.
XML: Select this option to read XML file. If this option is selected, the following fields will get displayed:
Infer schema: Enable this option to get true schema of the column.
Path: Provide the path of the file.
Root Tag: Provide the root tag from the XML files.
Name: Display the name of the Kafka event in the pipeline.
Event Name: Name of the Kafka event.
Partitions: Number of partitions in the Kafka event.
Messages Count: Displays the number of messages in the Kafka topic.
Retention Period: Displays the retention period of the Kafka topic in hours. The retention period of a Kafka topic determines how long Kafka retains the messages in a topic before deleting them.
Provide a display name for the event (A default name based on the pipeline name appears for the Event).
Select the Event Duration from the drop-down menu (It can be set from 4 to 168 hours as per the given options).
Number of partitions (You can choose out of 1 to 50).
Number of outputs (You can choose out of 1-3) (The maximum number of outputs must not exceed the no. of Partition).
Enable the Is Failover? option if you wish to create a failover Event.
Click the Add Event option to save the new Event.
Total Allocated Min CPU: Minimum allocated CPU in cores.
Total Allocated Max Memory: Maximum allocated Memory in MB.
Total Allocated Min Memory: Minimum allocated Memory in MB.
Authentication: Select an authentication option using the drop-down list.
Password: Provide a password to authenticate the SFTP component
PEM/PPK File: Choose a file to authenticate the SFTP component. The user must upload a file if this authentication option is selected.
Reader Path: Enter the path from where the file has to be read.
Channel: Select a channel option from the drop-down menu (the supported channel is SFTP).
Column filter: Select the columns that you want to read and if you change the name of the column, then put that name in the alias name section otherwise keep the alias name the same as the column name and then select a Column Type from the drop-down menu.
Use the Download Data and Upload File options to select the desired columns.
Upload File: The user can upload the existing system files (CSV, JSON) using the Upload File icon.
Download Data (Schema): Users can download the schema structure in JSON format by using the Download Data icon.
Resource Type: Provide the resource type. In Elasticsearch, a resource type is a way to group related documents together within an index. Resource types are defined at the time of index creation, and they provide a way to logically separate different types of documents that may be stored within the same index.
Is Date Rich True: Enable this option if any fields in the reading file contain date or time information. The date rich feature in Elasticsearch allows for advanced querying and filtering of documents based on date or time ranges, as well as date arithmetic operations.
Username: Enter the username for elastic search.
Password: Enter the password for elastic search.
Query: Provide a spark SQL query.
Follow the below-given steps to create a Python Job using the register feature:
Create a project in the DSLab module under the Python environment. Refer to the below given image for guidance.
Once the project is created, create a Notebook and write the scripts. It supports scripts running through multiple code cells.
After writing the script, select the Register option from the Notebook options. Refer to the following image for reference.
The Register as Job panel will open on the right side of the window with two options:
Register as New: This will create a new Job.
Re-Register: If the Job is already created and the user wants to make changes to the scripts, it will update the existing Job with the latest changes.
Please go through the walkthrough below to register as a new Job.
After clicking on the Register option and selecting the Register as New option, the user needs to choose the desired notebook cell that should be executed with the Job. The user can select multiple cells from the notebook according to requirement and then click on the Next option.
Now, the user needs to validate the script of the selected cell by clicking on the Validate option. Additionally, the user can select the External Libraries used in the project by clicking on the External Libraries option next to the Validate option. The Next option won't be enabled until the user validates the script. After validating the script, click on the Next option.
Enter scheduler name: Name of the job. (It will create a scheduled job if the user is creating a Python Job).
Scheduler description: Description of the job.
Start function: Select the start function from the validated script to start the job from the given start function.
Job BaseInfo: Python (This field will be pre-selected if the DSLab project is created under the Python environment.)
Docker config: Select the desired configuration for the job and provide the resources (CPU & Memory) for executing the job.
Provide the resources required to run the Python Job in the Limit and Request section.
Limit: Enter the max CPU and Memory required for the Python Job.
Request: Enter the CPU and Memory required for the job at the start.
Instances: Enter the number of instances for the Python Job.
On demand: Check this option if a Python Job (On demand) needs to be created. In this scenario, the Job will not be scheduled.
Payload: This option will only appear if the On demand option is checked. Enter the payload in the form of a JSON Array containing JSON objects. For more details about the Python Job (On demand), refer to this link:
Concurrency Policy: Select the desired concurrency policy. For more details about the Concurrency Policy, check this link:
Alert: This feature in the Job allows the users to send an alert message to the specified channel (Teams or Slack) in the event of either the success or failure of the configured Job. Users can also choose both success and failure options to send an alert for the configured Job. Check the following link to configure the Alert:
Click on the Save option to create a job.
This feature allows the user to update an existing job with the latest changes. Select the Re-register option if the Job is already created and the user wants to make changes to the scripts.
After selecting the Re-Register option, the system will display all previous versions of registered Jobs from the chosen notebook.
The user must choose the Job to be Re-Registered with the latest changes and proceed by clicking Next.
Validate the script of the selected cell by clicking on the Validate option. Additionally, the user can choose External Libraries by clicking on the option next to Validate. The Next option remains disabled until the script is validated.
After script validation, proceed by clicking Next.
Now, the user needs to provide all the required information for Re-registering the job, following the same steps outlined in the Register as New feature.
Finally, click on the Save option to complete the Re-Registration of the job.
Region: Enter the region name where the bucket is located.
Access Key: Enter the AWS Access Key of the account that must be used.
Secret Key: Enter the AWS Secret Key of the account that must be used.
Table Name: Enter the name of the external table created in Athena.
Database Name: Name of the database in Athena in which the table has been created.
Limit: Enter the number of records to be read from the table.
Data Source: Enter the Data Source name configured in Athena. Data Source in Athena refers to your data's location, typically an S3 bucket.
Workgroup: Enter the Workgroup name configured in Athena. The Workgroup in Athena is a resource type to separate query execution and query history between Users, Teams, or Applications running under the same AWS account.
Query location: Enter the path where the results of the queries done in the Athena query editor are saved in the CSV format. Users can find this path under the Settings tab in the Athena query editor as Query Result Location.
Query: Enter the Spark SQL query.
Sample Spark SQL query that can be used in Athena Reader:
Type: Message Card. (This field will be Pre-filled)
Theme Color: Enter the Hexadecimal color code for ribbon color in the selected channel. Please refer the image given at the bottom of this page for the reference.
Sections: In this tab, the following fields are there:
Activity Title: This is the title of the alert which has to be to sent on the Teams channel. Enter the Activity Title as per the requirement.
Activity Subtitle: Enter the Activity Subtitle. Please refer the image given at the bottom of this page for the reference.
Text: Enter the text message which should be sent along with Alert.
Webhook URL: Provide the Webhook URL of the selected channel group where the Alert message needs to be sent.
Attachments: In this tab, the following fields are there:
Title: This is the title of the alert which has to be to sent on the selected channel. Enter the Activity Title as per the requirement.
Color: Enter the Hexadecimal color code for ribbon color in the Slack channel. Please refer the image given at the bottom of this page for the reference.
Text: Enter the text message which should be sent along with Alert.
Footer: The "Footer" typically refers to additional information or content appended at the end of a message in a Slack channel. This can include details like a signature, contact information, or any other supplementary information that you want to include with your message. Footers are often used to provide context or additional context to the message content.
Footer Icon: In Slack, the footer icon refers to an icon or image that is displayed at the bottom of a message or attachment. The footer icon can be a company logo, an application icon, or any other image that represents the entity responsible for the message. Enter image URL as the value of Footer icon.
Follow these steps to set the Footer icon in Slack:
Go to the desired image that has to be used as the footer icon.
Sample image URL for Footer icon:
Sample Hexadecimal Color code which can be used in Job Alert.
Navigate to the Data Pipeline module homepage.
Open the pipeline homepage and click on the Create option.
The new panel opens from right hand side. Click on Create button in Job option.
Enter a name for the new Job.
Describe the Job (Optional).
Job Baseinfo: Select Python Job from the drop-down.
Trigger By: There are 2 options for triggering a job on success or failure of a job:
Success Job: On successful execution of the selected job the current job will be triggered.
Failure Job: On failure of the selected job the current job will be triggered.
Is Scheduled?
A job can be scheduled for a particular timestamp. Every time at the same timestamp the job will be triggered.
Job must be scheduled according to UTC.
On demand: Check the "On demand" option to create an on-demand job. For more information on Python Job (On demand), check .
Docker Configuration: Select a resource allocation option using the radio button. The given choices are:
Low
Medium
High
Provide the resources required to run the python Job in the limit and Request section.
Limit: Enter max CPU and Memory required for the Python Job.
Request: Enter the CPU and Memory required for the job at the start.
Alert: Please refer to the page to configure alerts in job.
Click the Save option to save the Python Job.
The Python Job gets saved, and it will redirect the users to the Job Editor workspace.
Check out the below given demonstration configure a Python Job.
Once the Python Job is created, follow the below given steps to configure the Meta Information tab of the Python Job.
Project Name: Select the same Project using the drop-down menu where the Notebook has been created.
Script Name: This field will list the exported Notebook names which are exported from the Data Science Lab module to Data Pipeline.
External Library: If any external libraries are used in the script the user can mention it here. The user can mention multiple libraries by giving comma (,) in between the names.
Start Function: Here, all the function names used in the script will be listed. Select the start function name to execute the python script.
Script: The Exported script appears under this space.
Input Data: If any parameter has been given in the function, then the name of the parameter is provided as Key, and value of the parameters has to be provided as value in this field.
Click on the Create icon.
Navigate to the Create Pipeline or Job interface.
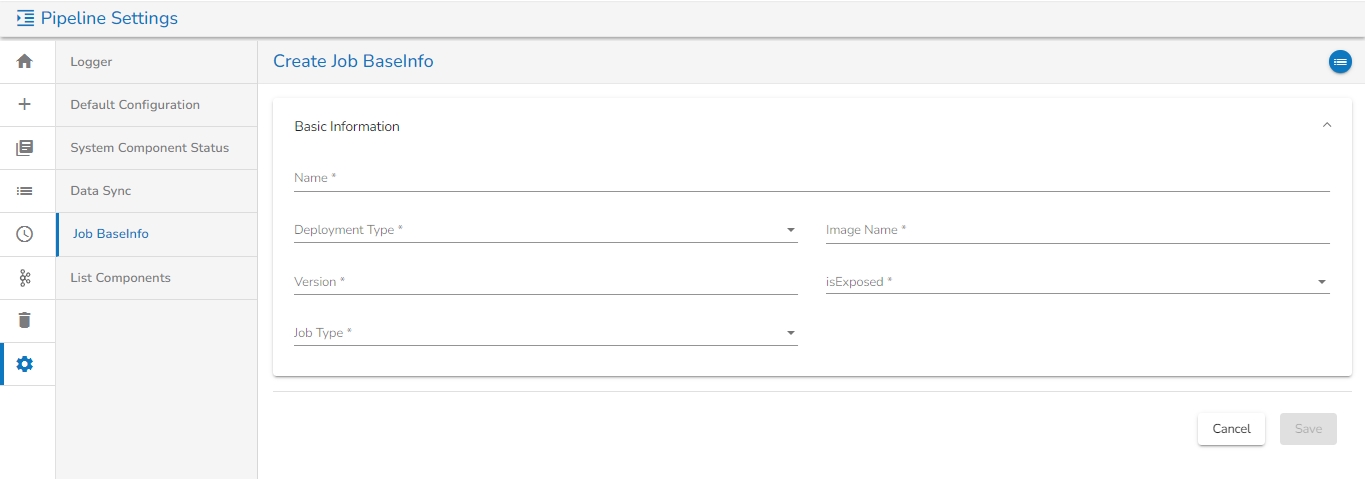
The New Job dialog box appears, redirecting the user to create a new Job.
Enter a name for the new Job.
Describe the Job(Optional).
Job Baseinfo: In this field, there are the following options:
Trigger By: There are 2 options for triggering a job on success or failure of a job:
Success Job: On successful execution of the selected job the current job will be triggered.
Failure Job: On failure of the selected job the current job will be triggered.
Is Scheduled?
A job can be scheduled for a particular timestamp. Every time at the same timestamp the job will be triggered.
Job must be scheduled according to UTC.
Concurrency Policy: Concurrency policy schedulers are responsible for managing the execution and scheduling of concurrent tasks or threads in a system. They determine how resources are allocated and utilized among the competing tasks. Different scheduling policies exist to control the order, priority, and allocation of resources for concurrent tasks.
There are 3 Concurrency Policy available:
Allow: If a job is scheduled for a specific time and the first process is not completed before the next scheduled time, the next task will run in parallel with the previous tasks.
Forbid: If a job is scheduled for a specific time and the first process is not completed before the next scheduled time, the next task will wait until all the previous tasks are completed.
Replace: If a job is scheduled for a specific time and the first process is not completed before the next scheduled time, the previous task will be terminated and the new task will start processing.
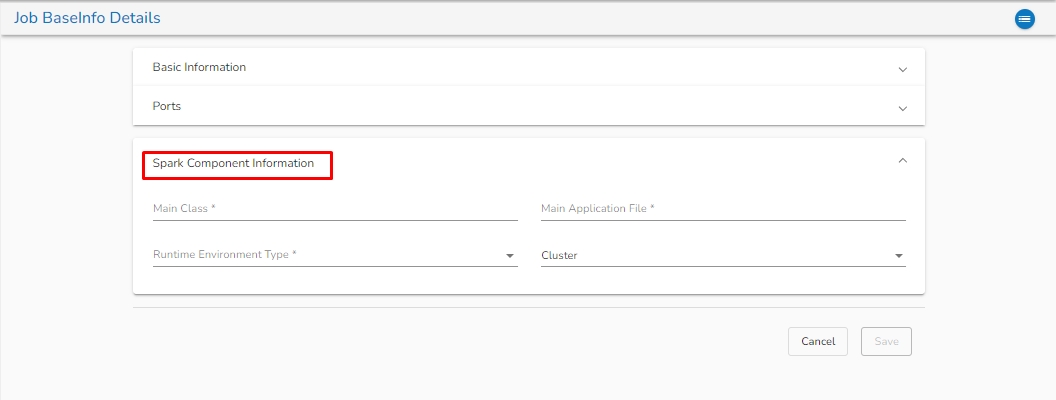
Spark Configuration
Select a resource allocation option using the radio button. The given choices are:
Low
Alert: There are 2 options for sending an alert:
Success: On successful execution of the configured job, the alert will be sent to selected channel.
Failure: On failure of the configured job, the alert will be sent to selected channel.
Please go through the given link to configure the Alerts in Job:
Click the Save option to create the job.
A success message appears to confirm the creation of a new job.
The Job Editor page opens for the newly created job.
After we save the component and pipeline, The component gets saved with the default configuration of the pipeline i.e. Low, Medium, and High. After the users save the pipeline, we can see the configuration tab in the component. There are multiple things:
There are Request and Limit configurations needed for the Docker components.
The users can see the CPU and Memory options to be configured.
CPU: This is the CPU config where we can specify the number of cores that we need to assign to the component.
Memory: This option is to specify how much memory you want to dedicate to that specific component.
Instances: The number of instances is used for parallel processing. If the users. give N no of instances those many pods will be deployed.
Spark Component has the option to give the partition factor in the Basic Information tab. This is critical for parallel spark jobs.
Please follow the given example to achieve it:
E.g., If the users need to run 10 parallel spark processes to write the data where the number of inputs Kafka topic partition is 5 then, they will have to set the partition count to 2[i.e., 5*2=10 jobs]. Also, to make it work the number of cores * number of instances should be equal to 10.2 cores * 5
instances =10 jobs.
The configuration of the Spark Components is slightly different from the Docker components. When the spark components are deployed, there are two pods that come up:
Driver
Executor
Provide the Driver and Executor configurations separately.
Instances: The number of instances used for parallel processing. If we give N as the number of instances in the Executor configuration N executor pods will get deployed.
Click the Failure Analysis icon.
The Failure Analysis page opens.
Search Component: A Search bar is provided to search all components associated with that pipeline. It helps to find a specific component by inserting the name in the Search Bar.
Component Panel: It displays all the components associated with that pipeline.
Filter: By default, the selected component instance Id will be displayed in the filter field. Records will be displayed based on the instance id of the selected component. It filters the failure data based on the applied filter.
Please Note the Filter Format of some of the field types.
Field Value Type
Filter Format
String
data.data_desc:” "ignition"
Integer
data.data_id:35
Float
data.lng:95.83467601
Boolean
data.isActive:true
Project: By default, the pipeline_Id and _id are selected from the records. If the user does not want to select and select any field then that field will be set with 0/1 (0 to exclude and 1 to include), displaying the selected column.
Sort: By default, records are displayed in descending order based on the “_id” field. Users can change ascending order by choosing Ascending option.
Limit: By default, 10 records are displayed. Users can modify the records limit according to the requirement. The maximum limit is 1000.
Find: It filters/sorts/limits the records and projects the fields by clicking on the find button.
Reset: If the user clicks on the Reset button, then all the fields must be reset with a default value.
Cause: The cause of the failure gets displayed by a click on any failed data.
The component failure is indicated by a red color flag in the Pipeline Workflow. The user gets redirected to the Failure Analysis page by clicking on the red flag.
Navigate to any Pipeline Editor page.
Create or access a Pipeline workflow and run it.
If any component fails while running the Pipeline workflow, a red color flag pops-up on the top right side of the component.
Click the red flag to open the Failure Analysis page.
By clicking the ellipsis icon for the failed component from the Failure Analysis page, the user gets options to open Monitoring or Data Metrics page for the component.
The cause of the failure also gets highlighted in the log.
Meta Information
Please follow the demonstration to configure the component and its Meta Information.
Host: Enter the host.
Username: Enter username for SFTP stream reader.
Port: Provide the Port number.
Add File Name: Enable this option to get the file name along with the data.
Authentication: Select an authentication option using the drop-down list.
Password: Provide a password to authenticate the SFTP Stream reader component
PEM/PPK File: Choose a file to authenticate the SFTP Stream reader component. The user needs to upload a file if this authentication option has been selected.
Reader Path: Enter the path from where the file has to be read.
Channel: Select a channel option from the drop-down menu (the supported channel is SFTP).
File type: Select the file type from the drop-down:
CSV: The Header and Infer Schema fields get displayed with CSV as the selected File Type. Enable Header option to get the Header of the reading file and enable Infer Schema option to get true schema of the column in the CSV file. Schema: If CSV is selected as file type, then paste spark schema of CSV file in this field.
File Metadata Topic: Enter Kafka Event Name where the reading file metadata has to be sent.
Column filter: Select the columns which you want to read and if you want to change the name of the column, then put that name in the alias name section otherwise keep the alias name the same as of column name and then select a Column Type from the drop-down menu.
Use Download Data and Upload File options to select the desired columns.
Upload File: The user can upload the existing system files (CSV, JSON) using the Upload File icon.
Download Data (Schema): Users can download the schema structure in JSON format by using the Download Data icon.

Write PySpark scripts and run them flawlessly in the Jobs.
This feature allows users to write their own PySpark script and run their script in the Jobs section of Data Pipeline module.
Before creating the PySpark Job, the user has to create a project in the Data Science Lab module under PySpark Environment. Please refer the below image for reference:
Open the pipeline homepage and click on the Create option.
The new panel opens from right hand side. Click on Create button in Job option.
Provide the following information:
Enter name: Enter the name for the job.
The PySpark Job gets saved and it will redirect the user to the Job workspace.
Once the PySpark Job is created, follow the below given steps to configure the Meta Information tab of the PySpark Job.
Project Name: Select the same Project using the drop-down menu where the concerned Notebook has been created.
Script Name: This field will list the exported Notebook names which are exported from the Data Science Lab module to Data Pipeline.
External Library: If any external libraries are used in the script the user can mention it here. The user can mention multiple libraries by giving comma(,) in between the names.
Start Function: Here, all the function names used in the script will be listed. Select the start function name to execute the python script.
Script: The Exported script appears under this space.
This page describes how to delete a pipeline/Job or restore a deleted pipeline/Job using the Trash option.
Check out the given illustration on how to use the Trash option provided on the Pipeline homepage left menu panel.
Navigate to the Pipeline Homepage to access the left side menu panel.
Click the Trash icon.
The Trash List page opens listing all the deleted pipelines/jobs by a user from a user specific account.
The user gets two options to be applied on the pipelines/jobs:
Delete
Restore
Navigate to the Trash page.
Select a Pipeline.
Click the Delete icon for the selected Pipeline.
The Delete Pipeline/Job dialog box opens.
Click the Yes option.
The Delete Pipeline Confirmation dialog box opens.
Click the Delete Anyway option.
A notification message appears and the Pipeline/Job Permanently gets deleted for the user.
Navigate to the Trash page.
Select a Pipeline.
Click the Restore icon for the selected Pipeline/Job.
The Recover Pipeline/Job dialog box opens.
Click the Yes option.
A notification message appears that the Pipeline/Job has been restored.
The Pipeline gets recovered and lists in the Pipeline/Job list page.
The Version Control feature has been provided for the user to maintain a version of the pipeline while the same pipeline undergoes further development and different enhancements.
The Push & Pull Pipeline from GIT feature are present on the List Pipeline and Pipeline Editor pages.
Navigate to the Pipeline Editor page for a Pipeline.
Click the Push & Pipeline icon for the selected data pipeline.
The Push/Pull dialog box appears.
Provide a Commit Message (required) for the data pipeline version.
Select a Push Type out of the below-given choices to push the pipeline:
1.Version Control: For versioning of the pipeline in the same environment.
A notification message appears to confirm the completion of the action.
This feature is for pulling the previously moved versions of a pipeline that are committed by the user. This can help a user significantly to recover the lost pipelines or avoid unwanted modifications made to the pipeline.
Navigate to the Pipeline Editor page.
Select a data pipeline from the displayed list.
Click the Push & Pipeline icon for the selected data pipeline.
Select Pull From VCS
A confirmation message appears to assure the users that the concerned pipeline workflow has been imported.
Another confirmation message appears to assure the user that the concerned pipeline workflow has been pulled.
The DB reader is a spark-based reader which gives you capability to read data from multiple database sources. All the database sources are listed below:
All component configurations are classified broadly into the following sections:
Meta Information
Please follow the steps given in the demonstration to configure the DB Reader component.
Table name: Provide a single or multiple table names. If multiple table name has be given, then enter the table names separated by comma(,).
Fetch Size: Provide the maximum number of records to be processed in one execution cycle.
Create Partition: This is used for performance enhancement. It's going to create the sequence of indexing. Once this option is selected, the operation will not execute on server.
Sample Spark SQL query for DB Reader:
Certificate file (.pem format)]
Key file (.key format)
HDFS stands for Hadoop Distributed File System. It is a distributed file system designed to store and manage large data sets in a reliable, fault-tolerant, and scalable way. HDFS is a core component of the Apache Hadoop ecosystem and is used by many big data applications.
This component reads the file located in HDFS(Hadoop Distributed File System).
All component configurations are classified broadly into 3 section
Meta Information
Host IP Address: Enter the host IP address for HDFS.
Port: Enter the Port.
Zone: Enter the Zone for HDFS. Zone is a special directory whose contents will be transparently encrypted upon write and transparently decrypted upon read.
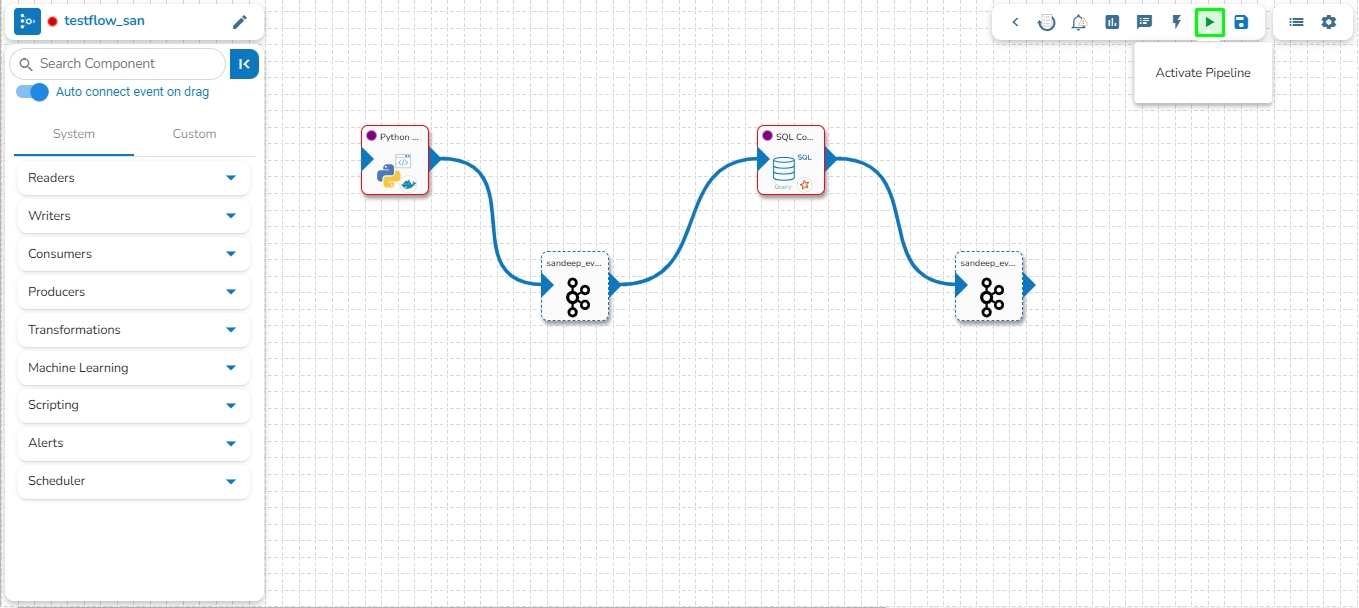

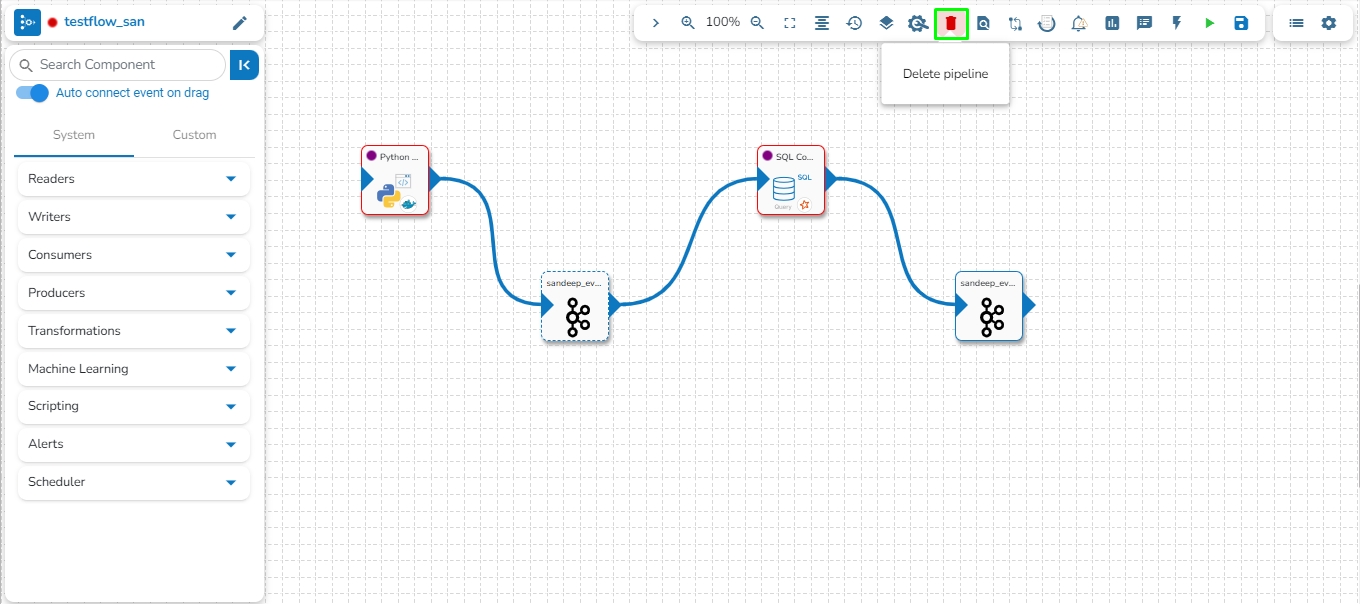
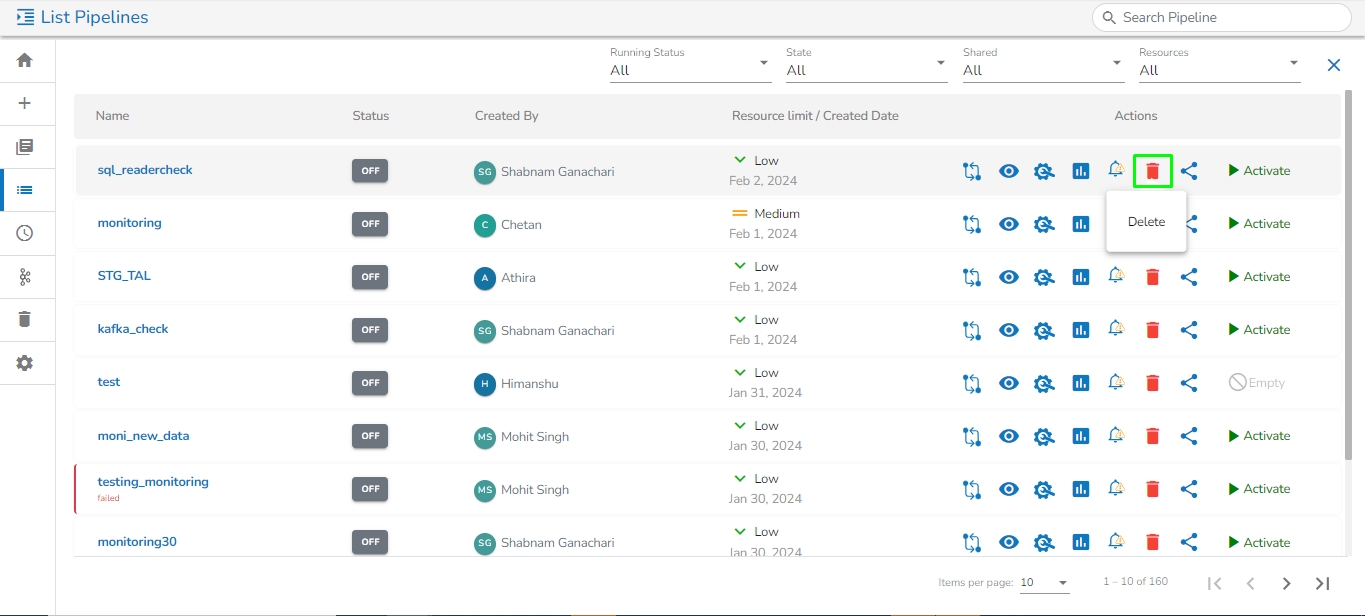
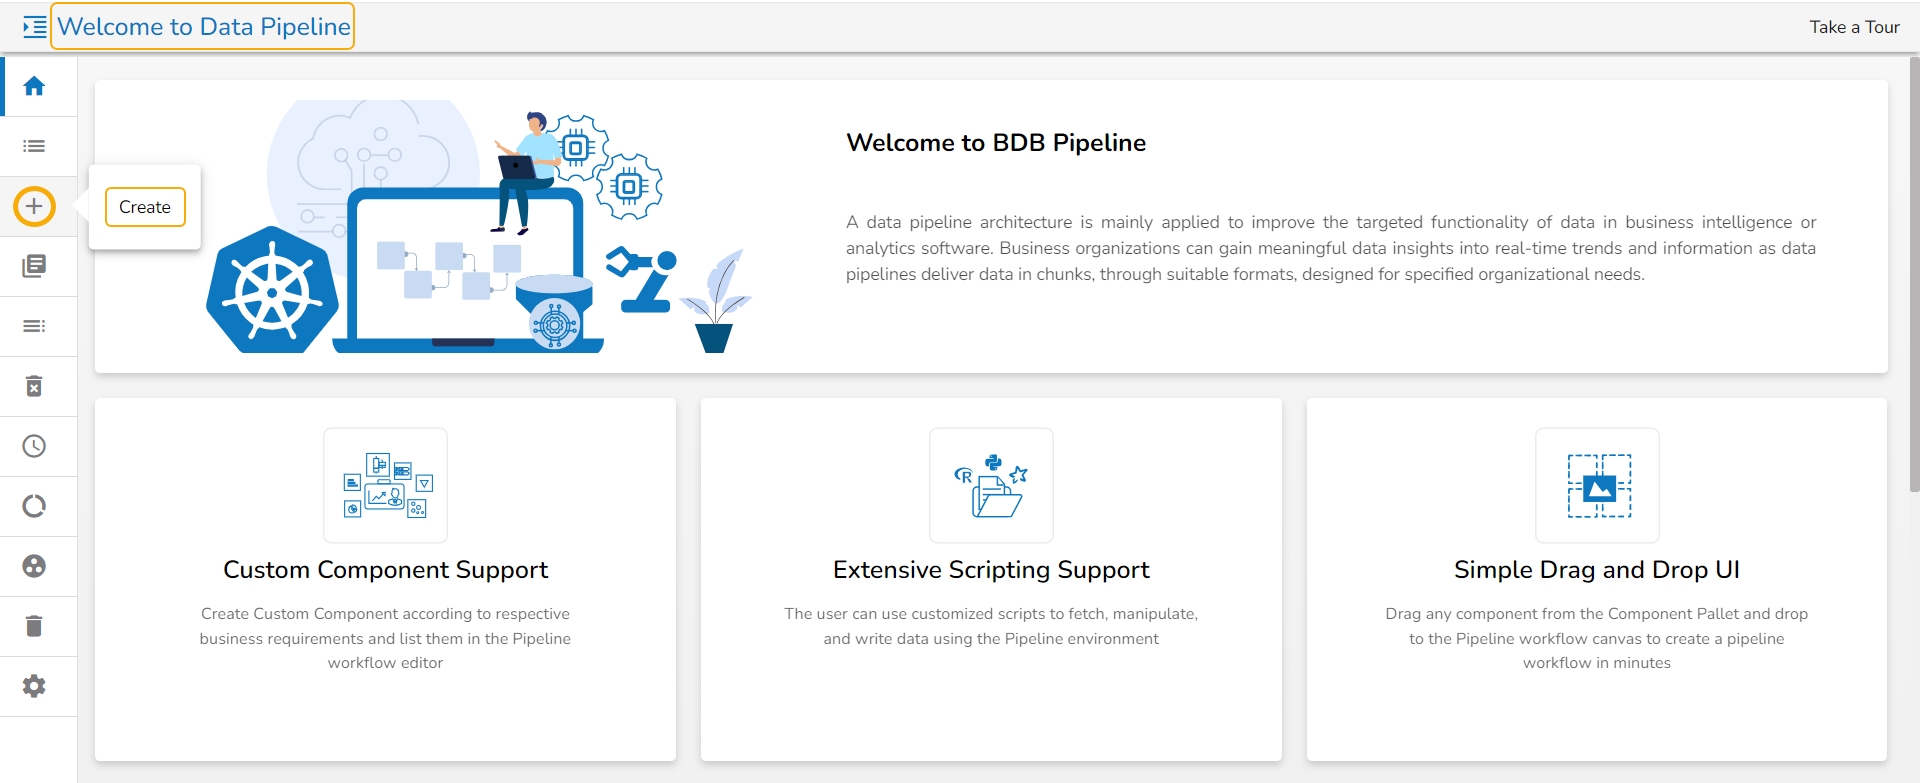
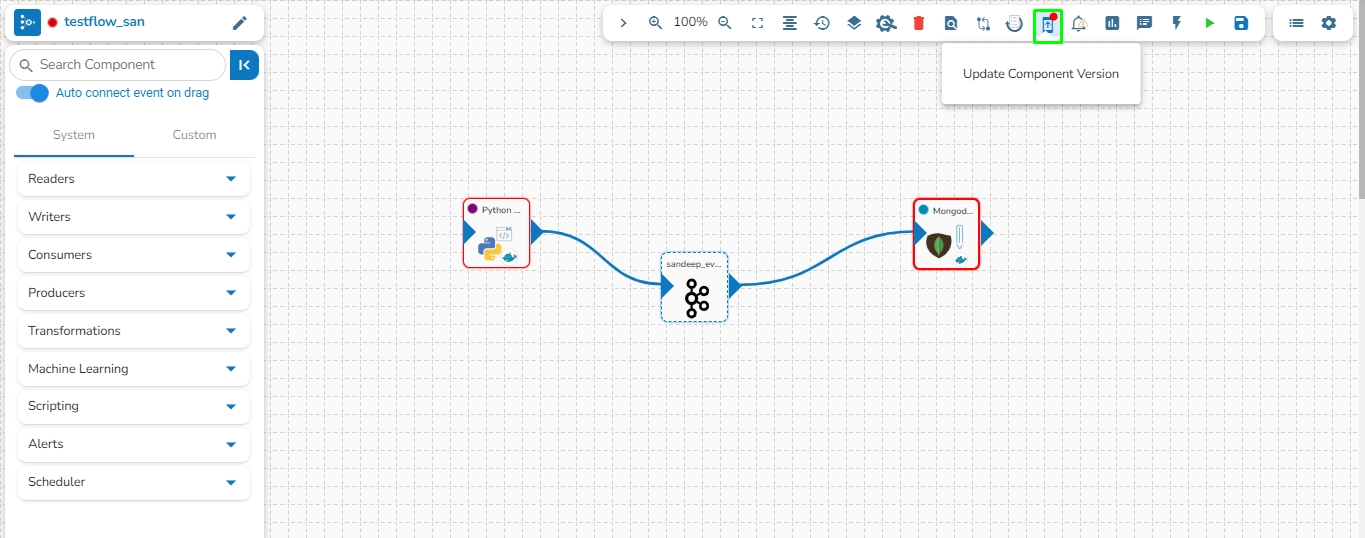

The Script Executor job is designed to execute code snippets or scripts written in various programming languages such as Go, Julia, and Python. This job allows users to fetch code from their Git repository and execute it seamlessly.
Navigate to the Data Pipeline module homepage.
Azure is a cloud computing platform and service. It provides a range of cloud services, including infrastructure as a service (IaaS), platform as a service (PaaS), and software as a service (SaaS) offerings, as well as tools for building, deploying, and managing applications in the cloud.
Azure Writer task is used to write the data in the Azure Blob Container.
Drag the Azure writer task to the Workspace and click on it to open the related configuration tabs for the same. The Meta Information tab opens by default.
This page explains how we can monitor a Job.
The user can use the Job Monitoring feature to track a Job and its associated tasks. On this page, the user can view details such as Job Status, Last Activated (Date and Time), Last Deactivated (Date and Time), Total Allocated and Consumed CPU, and Total Allocated and Consumed Memory, all presented together on Job monitoring page.
Please go through the below given walk-through on the Job monitoring function.
// Selecting data from employee table:
select * from employee limit 10;
// insert data into table_2 by selecting data from table_1 in Athena database:
insert into table_2
select * from table_1;
//Creating a table in Athena database by selecting data from another table in a different database:
CREATE TABLE database_2.table_2
WITH (
format = 'PARQUET', --file format(Parquet, AVRO, CSV, JSON etc..)
external_location = 's3_path' -- Where data will be stored
) AS
SELECT *
FROM database_1.table_1;
//Using CTE queries to get the results:
WITH age_data AS (
SELECT department,
CAST(ROUND(AVG(age), 2) AS INT) AS avg_age,
MIN(age) AS min_age,
MAX(age) AS max_age
FROM pipeline.employee_avro1
GROUP BY department
ORDER BY department
),
salary_data AS (
SELECT e.department,
CAST(ROUND(AVG(e.salary), 2) AS INT) AS average_salary,
a.avg_age
FROM pipeline.employee_avro1 e
JOIN age_data a ON e.department = a.department
GROUP BY e.department, a.avg_age
),
result_data AS (
SELECT s.department,
s.average_salary,
s.avg_age,
COUNT(emp_id) AS Total_employees
FROM pipeline.employee_avro1 e
JOIN salary_data s ON e.department = s.department
GROUP BY s.department, s.average_salary, s.avg_age
)
SELECT *
FROM result_data;Blue: #0000FF
Red: #FF0000
Yellow: #FFFF00
Green: #008000
Black: #000000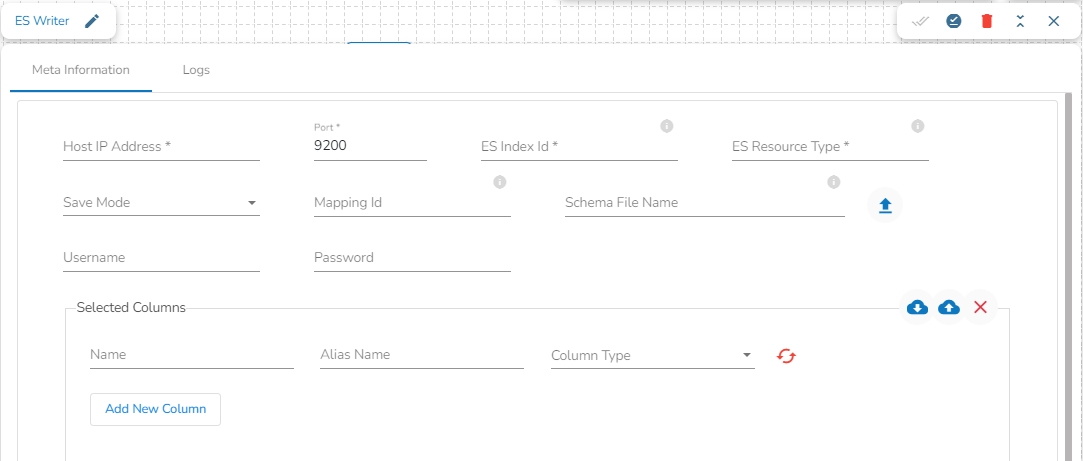


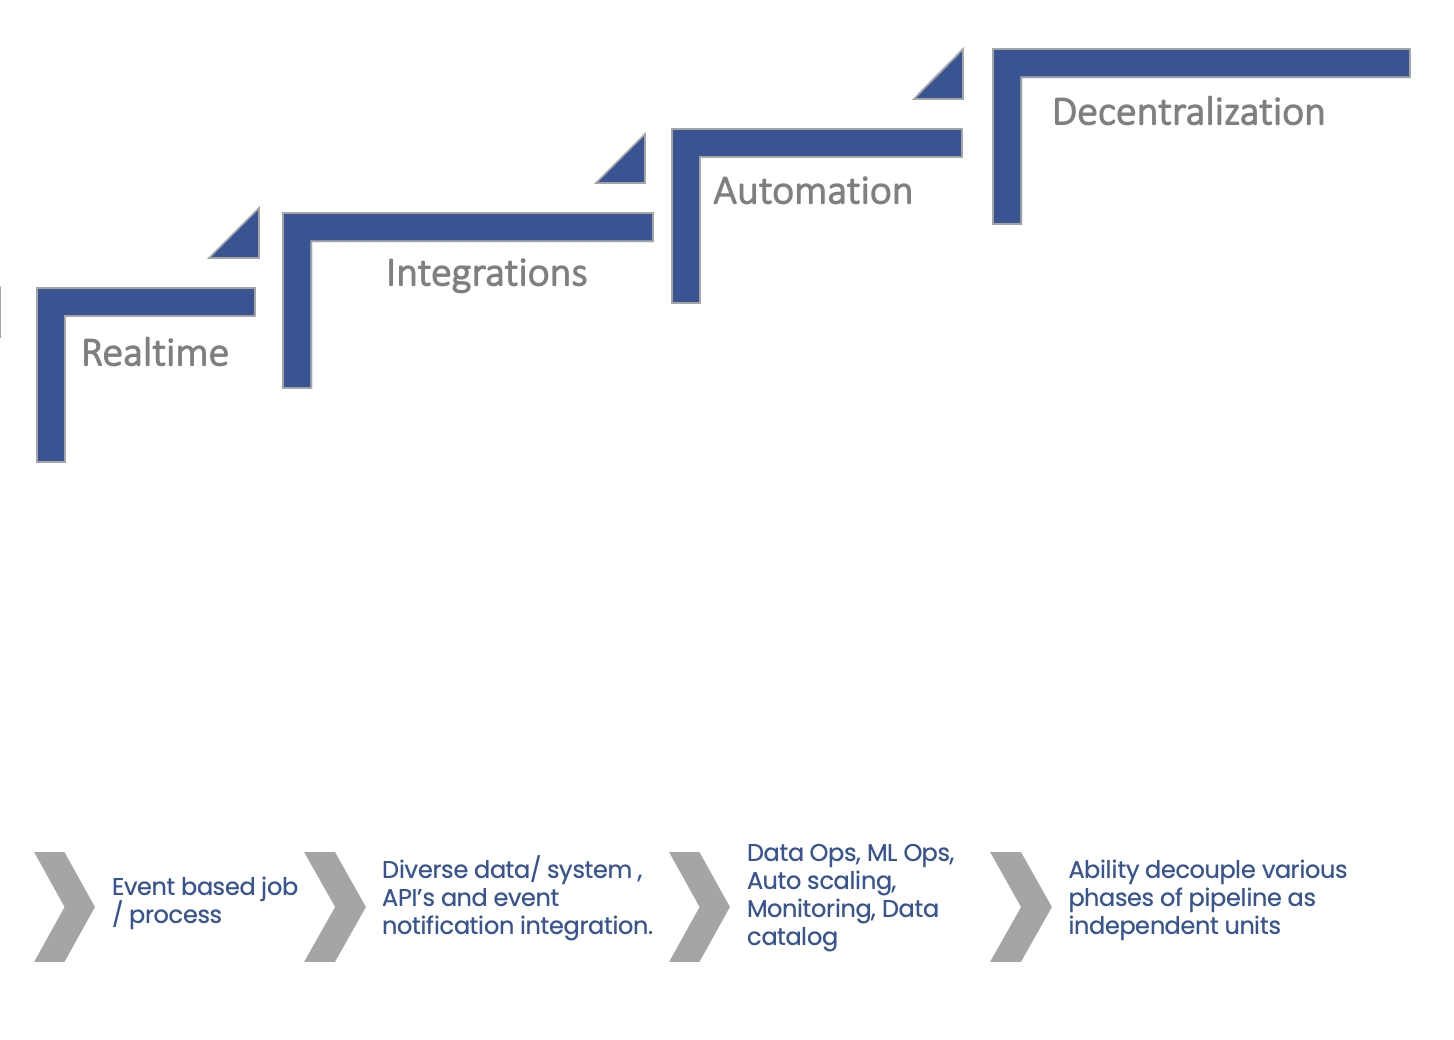
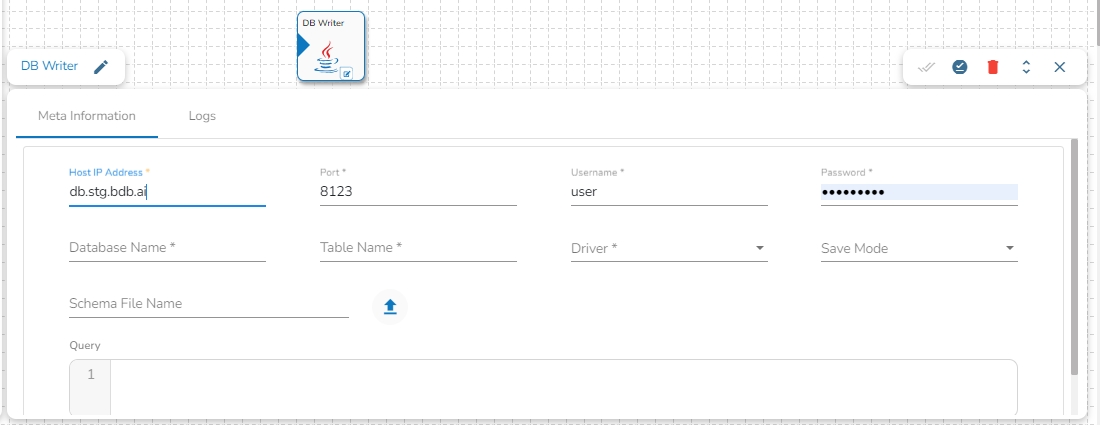
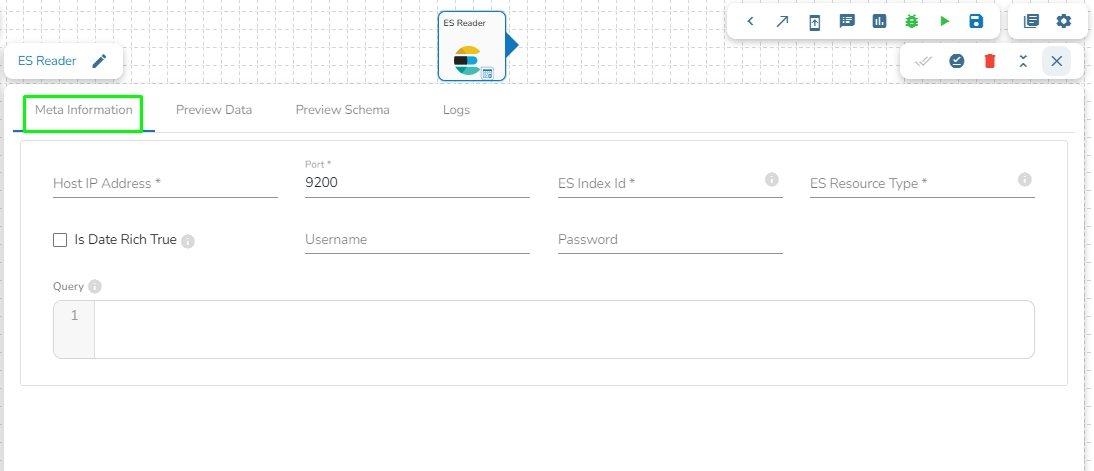
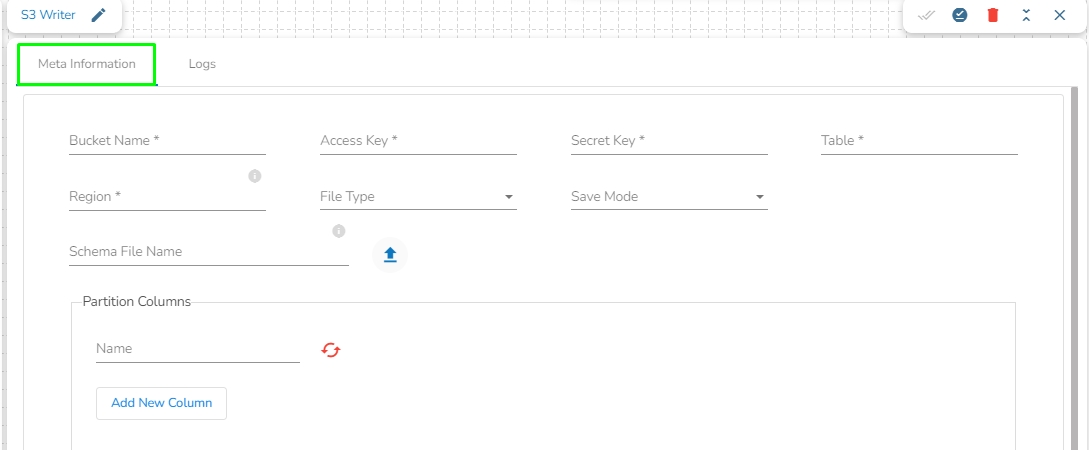
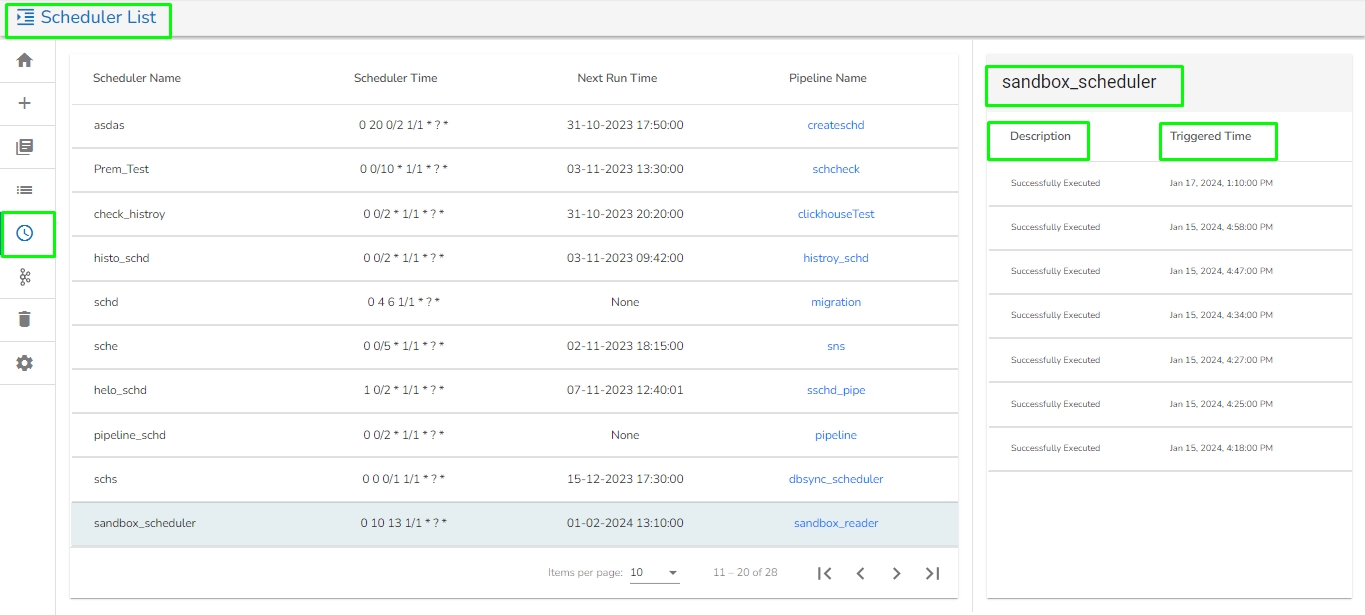

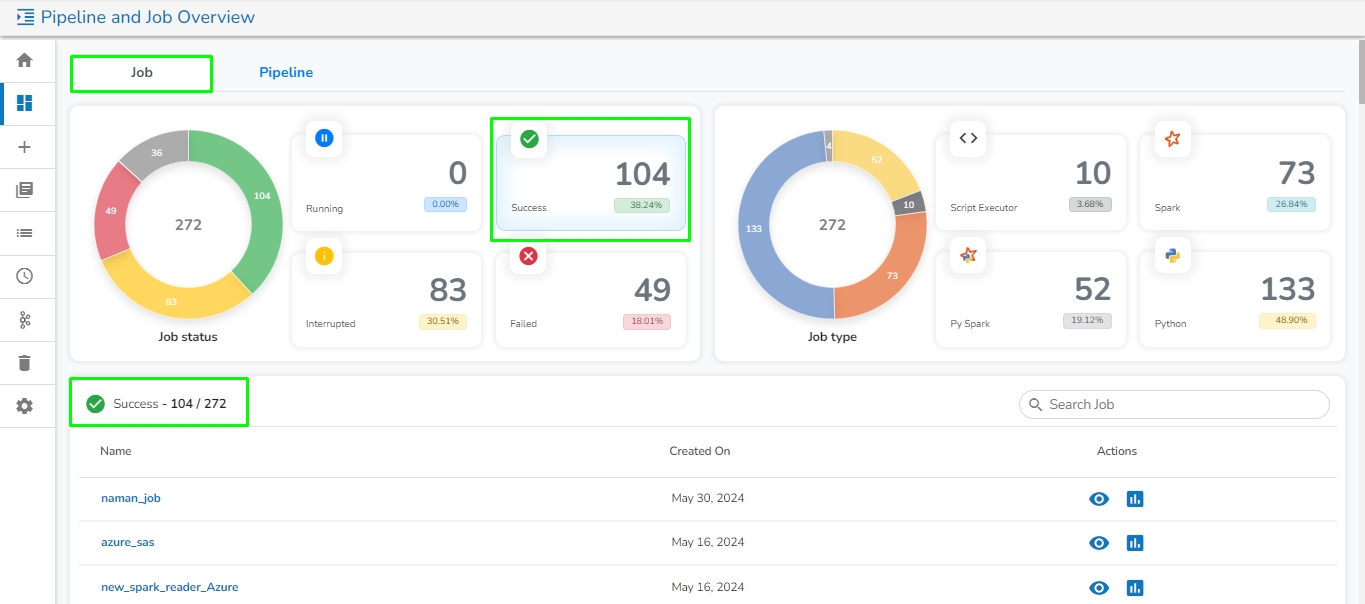
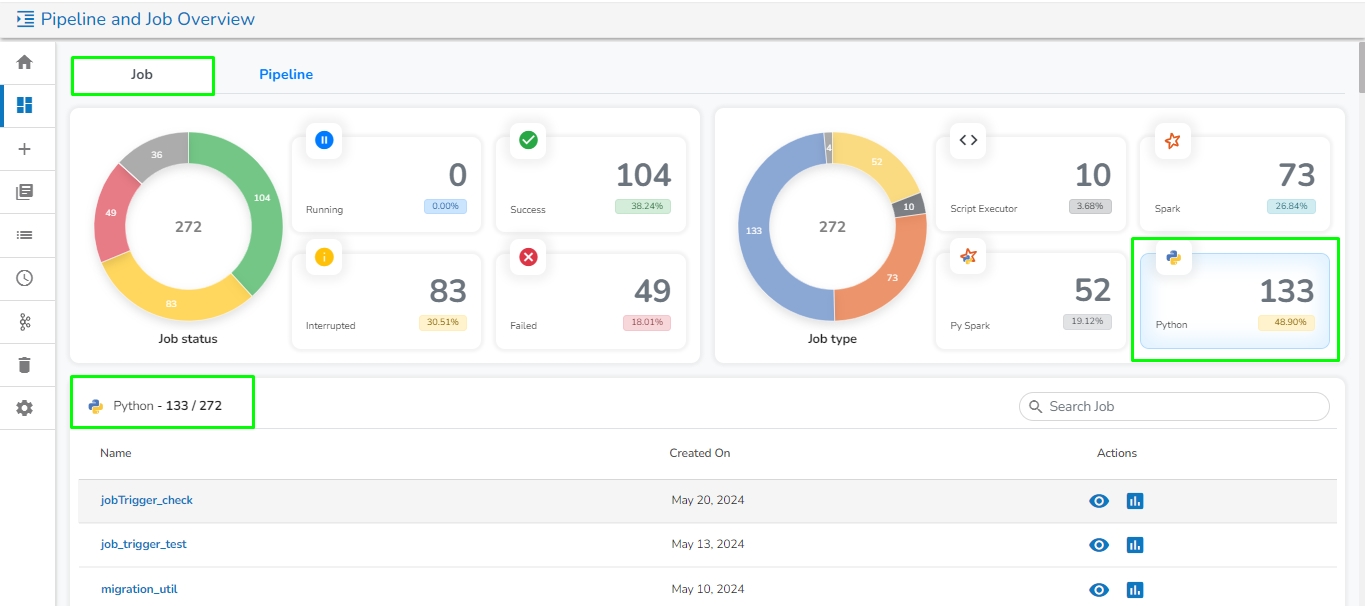
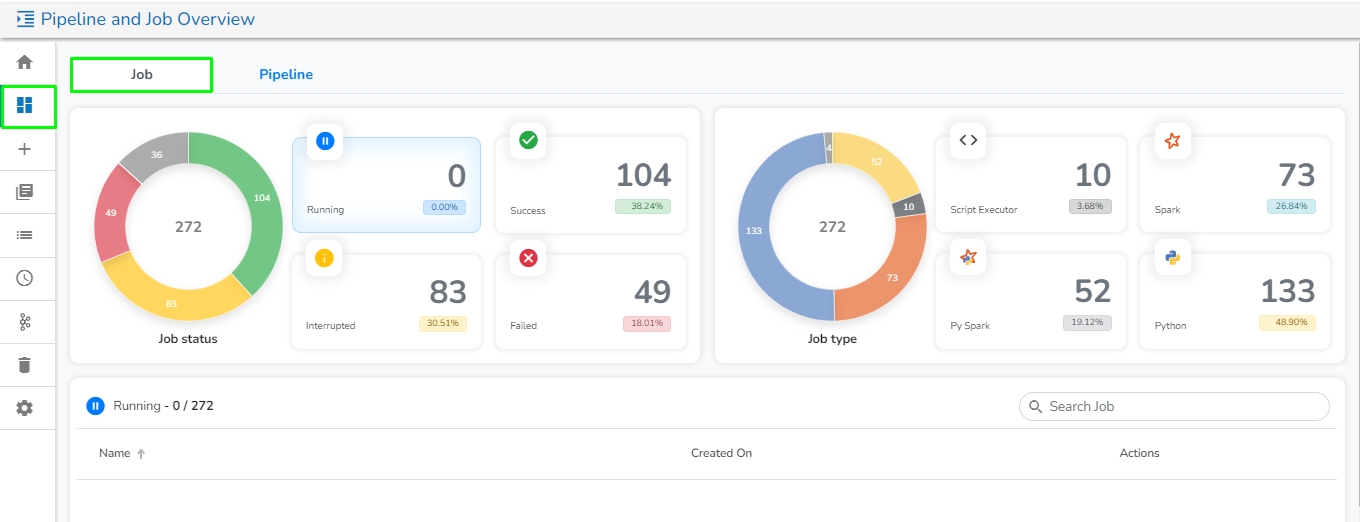
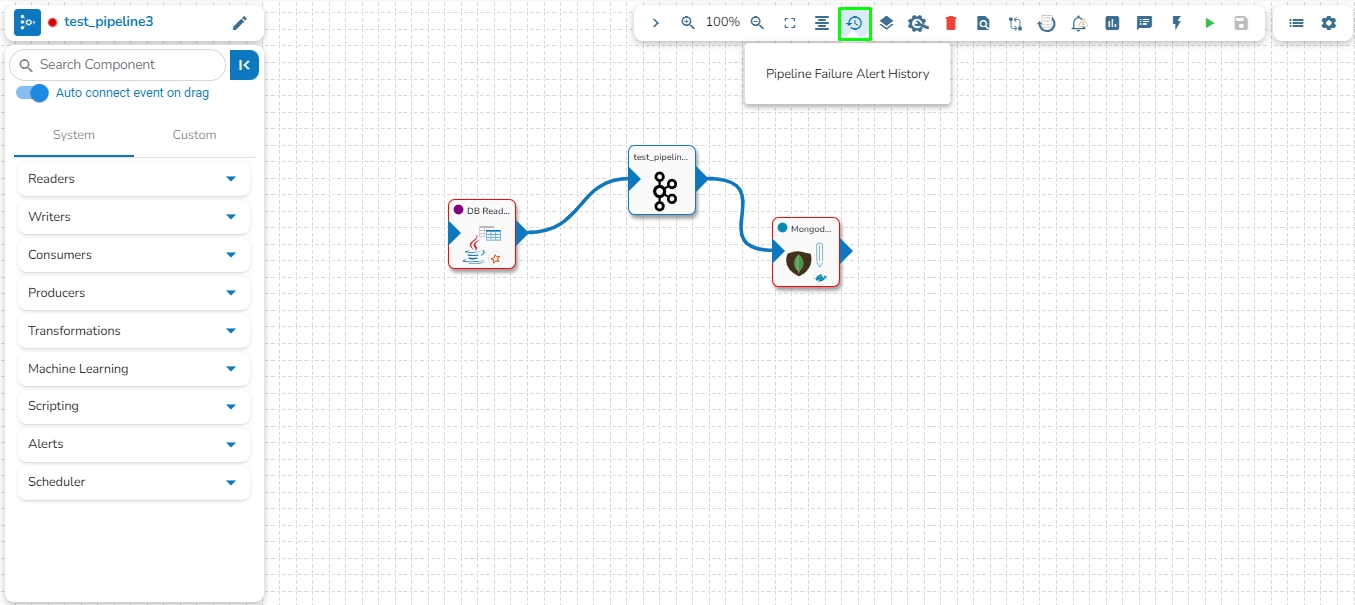
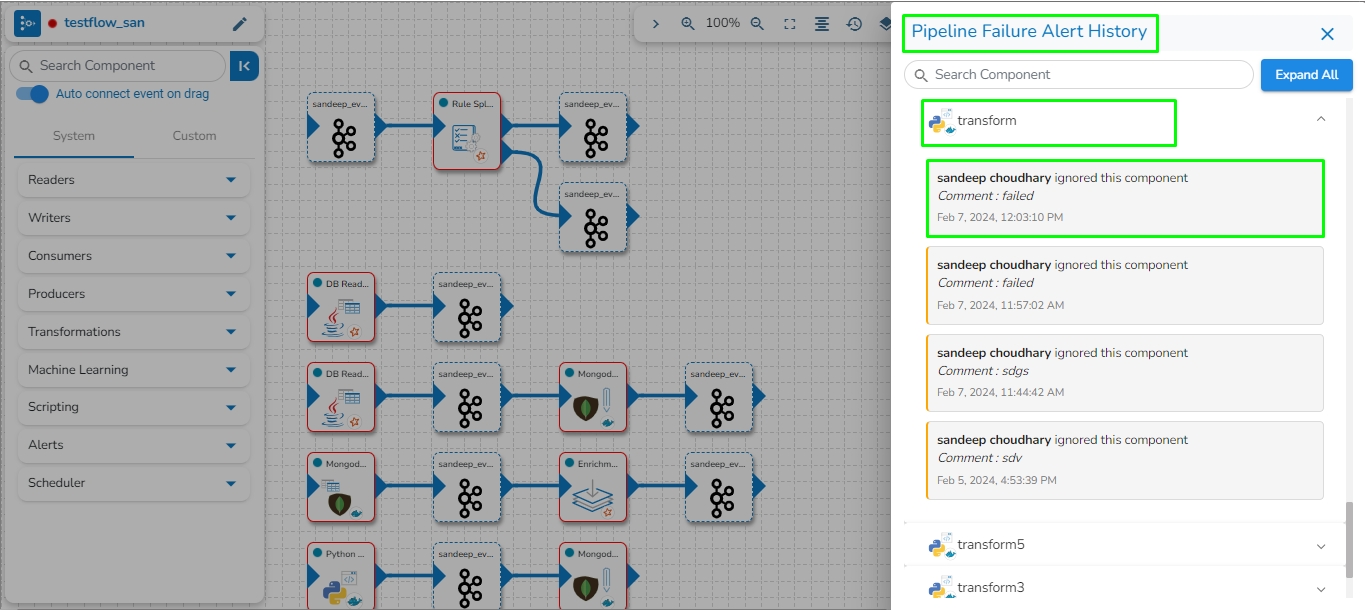
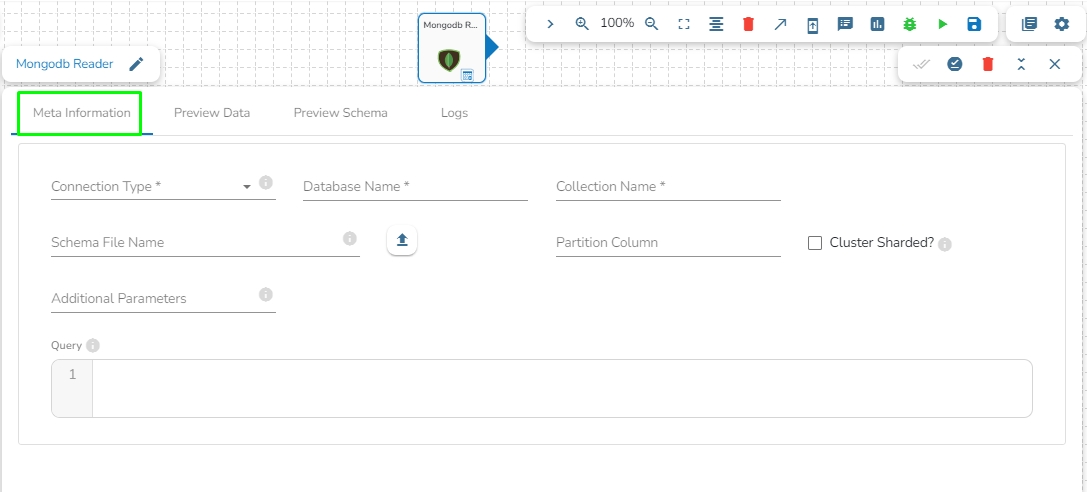
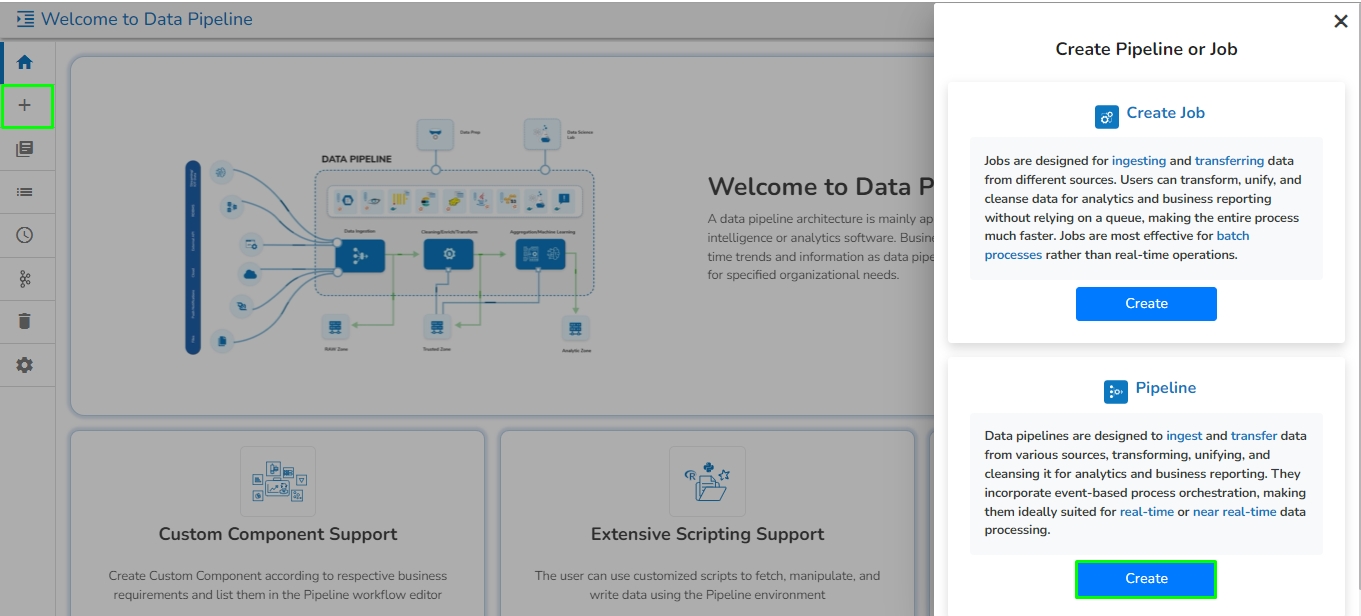
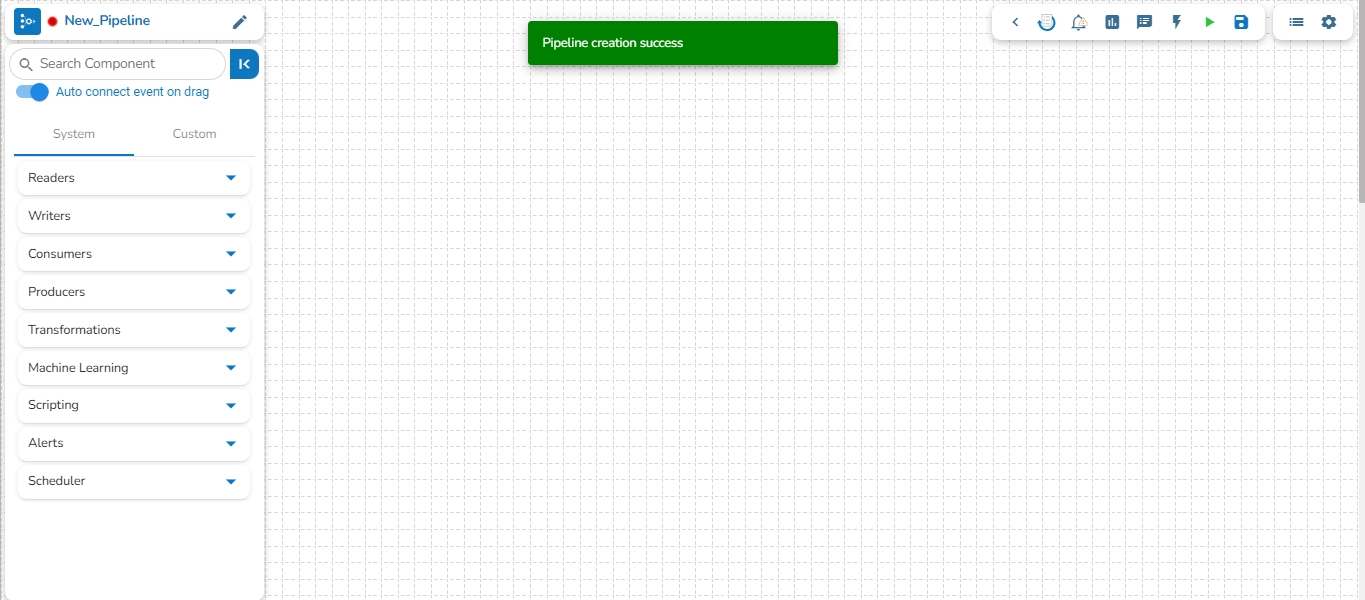
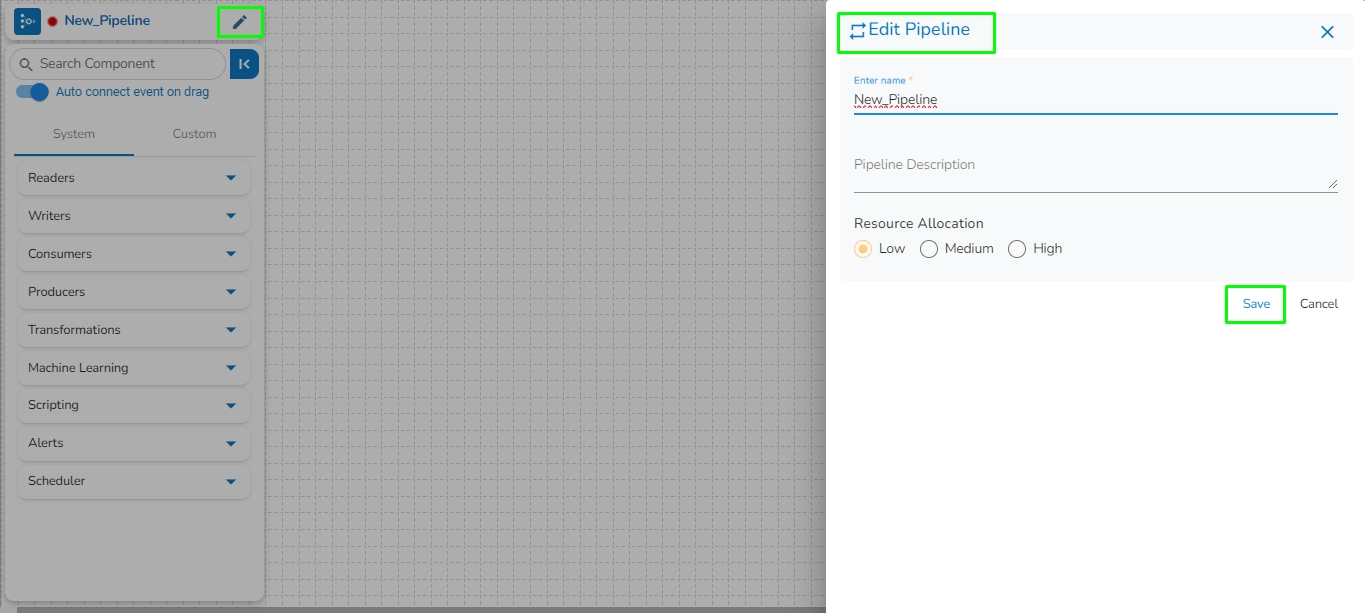
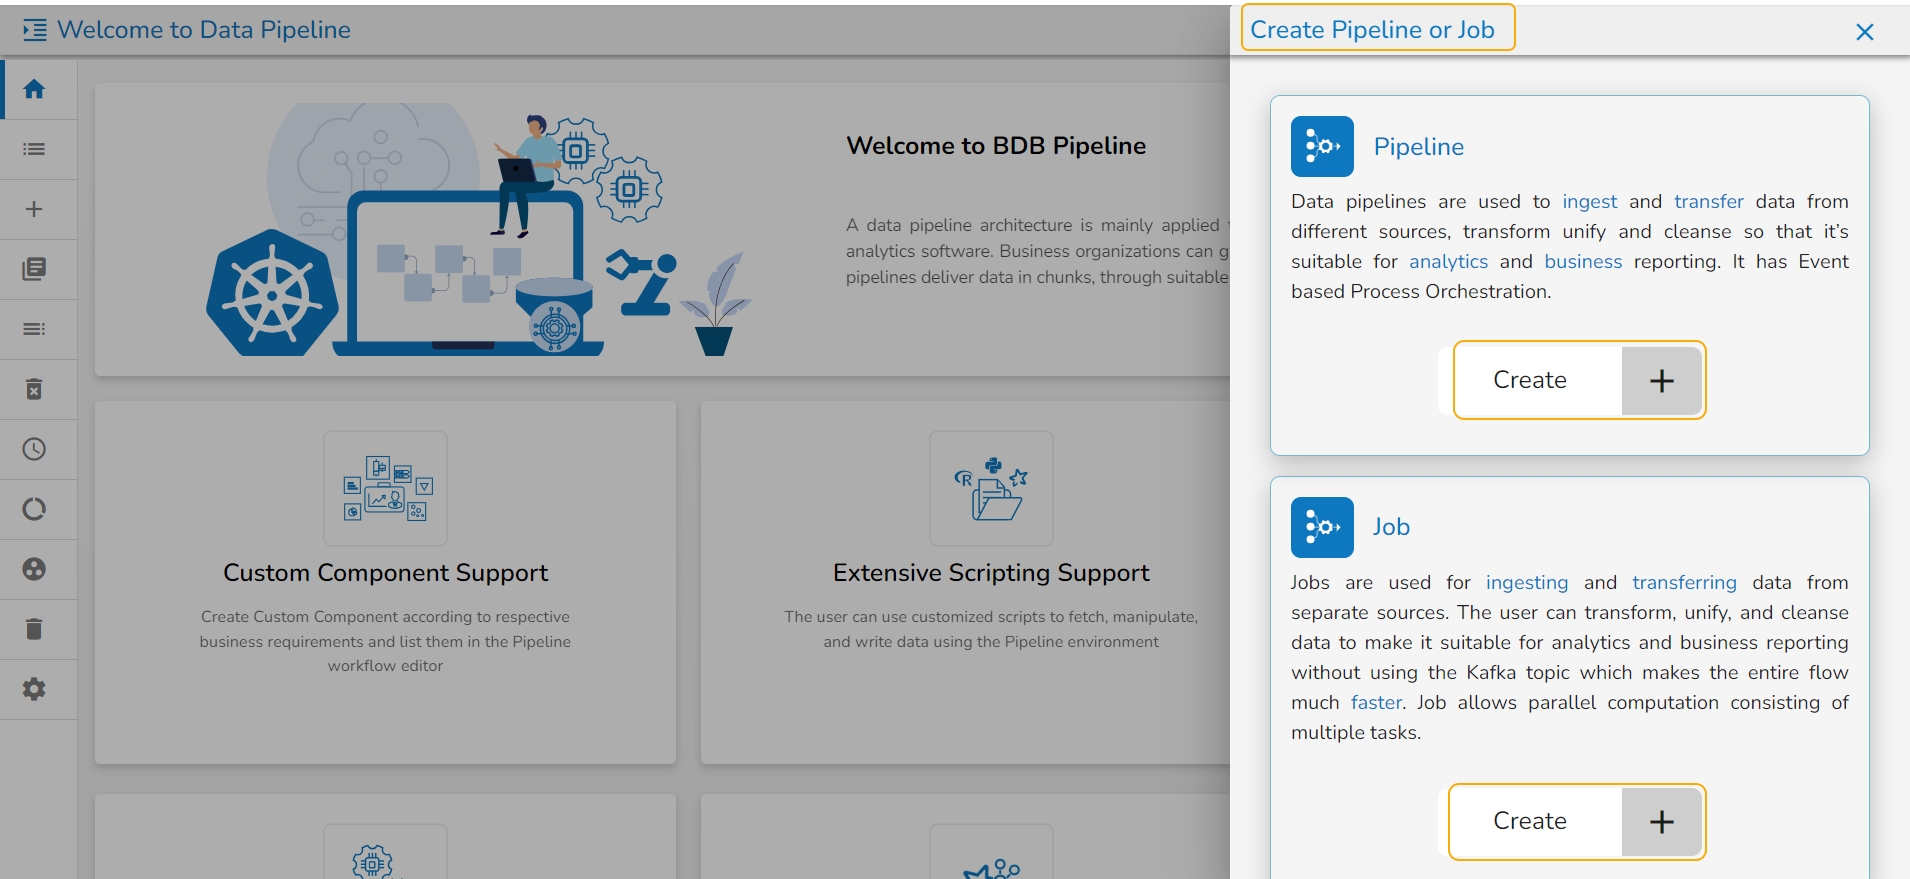
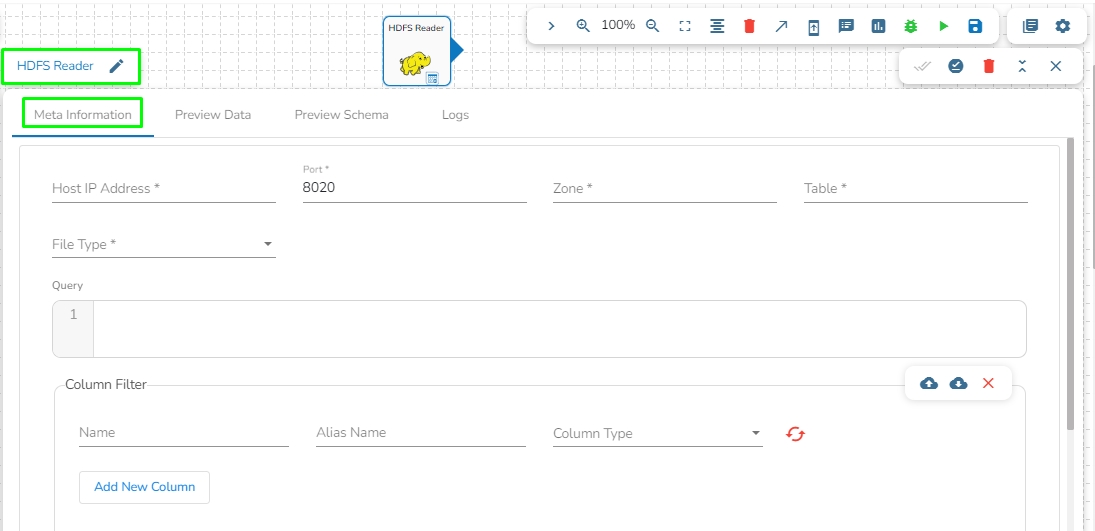
Row Tags: Provide the row tags from the XML files.
Join Row Tags: Enable this option to join multiple row tags.
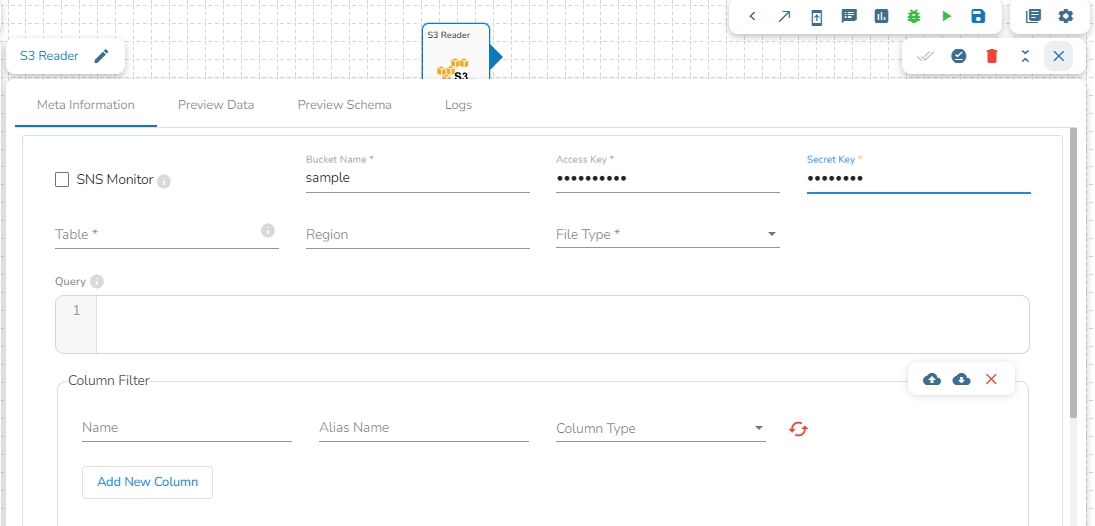
Right-click on the image.
Select the 'Copy image address' to get the image URL.
Now, the obtained image URL can be used as the value for the footer icon in Slack.
High
This feature is used to deploy the Job with high, medium, or low-end configurations according to the velocity and volume of data that the Job must handle.
Also, provide the resources to Driver and Executer according to the requirement.
XML: Select this option to read XML file. If this option is selected, the following fields will get displayed:
Infer schema: Enable this option to get true schema of the column.
Path: Provide the path of the file.
Root Tag: Provide the root tag from the XML files.
Row Tags: Provide the row tags from the XML files.
Join Row Tags: Enable this option to join multiple row tags.
Job Baseinfo: Select PySpark Job option from the drop in Job Base Information.
Trigger By: The PySpark Job can be triggered by another Job or PySpark Job. The PySpark Job can be triggered in two scenarios from another jobs:
On Success: Select a job from drop-down. Once the selected job is run successfully, it will trigger the PySpark Job.
On Failure: Select a job from drop-down. Once the selected job gets failed, it will trigger the PySpark Job.
Is Schedule: Put a checkmark in the given box to schedule the new Job.
Spark config: Select resource for the job.
Click on Save option to save the Job.
Oracle
MongoDB
PostgreSQL
ClickHouse
2.GIT Export (Migration): This is for pipeline migration. The pushed pipeline can be migrated to the destination environment from the migration window in Admin Module.
Click the Save option.
The Push/Pull dialog box appears.
Select the data pipeline version by marking the given checkbox.
Click the Save option.
Partition By: This option will appear once create partition option is enabled. There are two options under it:
Auto Increment: The number of partitions will be incremented automatically.
Index: The number of partitions will be incremented based on the specified Partition column.
Query: Enter the spark SQL query in this field for the given table or table(s). It supports query containing a join statement as well. Please refer the below image for making query on multiple tables.
Enable SSL: Check this box to enable SSL for this components. Enable SSL feature in DB reader component will appear only for two(2) drivers: PostgreSQL and ClickHouse.
Certificate Folder: This option will appear when the Enable SSL field is checked-in. The user has to select the certificate folder from drop down which contains the files which has been uploaded to the admin settings. Please refer the below given images for the reference.
CSV: The Header and Infer Schema fields get displayed with CSV as the selected File Type. Enable Header option to get the Header of the reading file and enable Infer Schema option to get true schema of the column in the CSV file.
JSON: The Multiline and Charset fields get displayed with JSON as the selected File Type. Check-in the Multiline option if there is any multiline string in the file.
PARQUET: No extra field gets displayed with PARQUET as the selected File Type.
AVRO: This File Type provides two drop-down menus.
Compression: Select an option out of the Deflate and Snappy options.
Compression Level: This field appears for the Deflate compression option. It provides 0 to 9 levels via a drop-down menu.
XML: Select this option to read XML file. If this option is selected, the following fields will get displayed:
Infer schema: Enable this option to get true schema of the column.
Path: Provide the path of the file.
ORC: Select this option to read ORC file. If this option is selected, the following fields will get displayed:
Push Down: In ORC (Optimized Row Columnar) file format, "push down" typically refers to the ability to push down predicate filters to the storage layer for processing. There will be two options in it:
True: When push down is set to True, it indicates that predicate filters can be pushed down to the ORC storage layer for filtering rows at the storage level. This can improve query performance by reducing the amount of data that needs to be read into memory for processing.
Path: Provide the path of the file.
Partition Columns: Provide a unique Key column name to partition data in Spark.
Click on the Apps menu to open it.
Click on the Data Pipeline module.
You get redirected to the Homepage of the Data Pipeline module.
The Homepage of the Data Pipeline module offers a left-side menu panel with various options to begin with the Data Pipeline module.
Various options provided on the left-side menu panel given on the Data Pipeline Homepage are as described below:
Home
Redirects the Pipeline Homepage.
Displays options to create a new Pipeline or Job.
Redirects to the page listing all the accessible Jobs by the user.
The Recently Visited section provides users with instant access to their most recent pipelines or jobs, displaying the last ten interactions. By eliminating the need to search through extensive menus or folders, this feature significantly improves workflow efficiency. Users can quickly resume work where they left off, ensuring a more seamless and intuitive experience on the pipeline homepage. It’s especially valuable for users managing multiple pipelines, as it reduces repetitive tasks, shortens navigation time, and increases overall productivity.
Navigate to the Data Pipeline Homepage.
Locate the Recently Visited section on the Homepage.
You may review the list of recent items to find the one you wish to access.
Select a Pipeline or Job from the list.
Click on the View icon of the desired pipeline or job.
You will be redirected to the Workflow Editor page of the selected Pipeline or Job.
Provide the following details:
Shared Access Signature: This is a URI that grants restricted access rights to Azure Storage resources.
Account Name: Provide the Azure account name.
Container: Provide the container name from where the file is located and which has to be read.
File type: There are four(5) types of file extensions are available under it:
CSV: The Header and Infer Schema fields get displayed with CSV as the selected File Type. Enable Header option to get the Header of the reading file and enable Infer Schema option to get true schema of the column in the CSV file.
JSON: The Multiline and Charset fields get displayed with JSON as the selected File Type. Check-in the Multiline option if there is any multiline string in the file.
Path: This option will appear once the file type is selected. Enter the path where the selected file type is located.
Read Directory: Check in this box to read the specified directory.
Query: Provide Spark SQL query in this field.
Provide the following details:
Account Key: Enter the Azure account key. In Azure, an account key is a security credential that is used to authenticate access to storage resources, such as blobs, files, queues, or tables, in an Azure storage account.
Account Name: Provide the Azure account name.
Container: Provide the container name from where the blob is located. A container is a logical unit of storage in Azure Blob Storage that can hold blobs. It is similar to a directory or folder in a file system, and it can be used to organize and manage blobs.
File type: There are four(5) types of file extensions are available under it:
CSV: The Header and Infer Schema fields get displayed with CSV as the selected File Type. Enable Header option to get the Header of the reading file and enable Infer Schema option to get true schema of the column in the CSV file.
JSON: The Multiline and Charset fields get displayed with
Path: This option will appear once the file type is selected. Enter the path where the selected file type is located.
Read Directory: Check in this box to read the specified directory.
Query: Provide Spark SQL query in this field.
Provide the following details:
Client ID: Provide Azure Client ID. The client ID is the unique Application (client) ID assigned to your app by Azure AD when the app was registered.
Tenant ID: Provide the Azure Tenant ID. Tenant ID (also known as Directory ID) is a unique identifier that is assigned to an Azure AD tenant, which represents an organization or a developer account. It is used to identify the organization or developer account that the application is associated with.
Client Secret: Enter the Azure Client Secret. Client Secret (also known as Application Secret or App Secret) is a secure password or key that is used to authenticate an application to Azure AD.
Account Name: Provide the Azure account name.
Container: Provide the container name from where the blob is located. A container is a logical unit of storage in Azure Blob Storage that can hold blobs. It is similar to a directory or folder in a file system, and it can be used to organize and manage blobs.
Query: Provide Spark SQL query in this field.
File type: There are four(5) types of file extensions are available under it:
CSV: The Header and Infer Schema fields get displayed with CSV as the selected File Type. Enable Header option to get the Header of the reading file and enable Infer Schema option to get true schema of the column in the CSV file.
Open the pipeline homepage and click on the Create option.
The new panel opens from right hand side. Click on Create button in Job option.
Enter a name for the new Job.
Describe the Job (Optional).
Job Baseinfo: Select Script Executer from the drop-down.
Trigger By: There are 2 options for triggering a job on success or failure of a job:
Success Job: On successful execution of the selected job the current job will be triggered.
Failure Job: On failure of the selected job the current job will be triggered.
Is Scheduled?
A job can be scheduled for a particular timestamp. Every time at the same timestamp the job will be triggered.
Job must be scheduled according to UTC.
Docker Configuration: Select a resource allocation option using the radio button. The given choices are:
Low
Medium
High
Provide the resources required to run the python Job in the limit and Request section.
Limit: Enter max CPU and Memory required for the Python Job.
Request: Enter the CPU and Memory required for the job at the start.
Instances: Enter the number of instances for the Python Job.
Alert: Please refer to the page to configure alerts in job.
Click the Save option to save the Python Job.
The Script Executer Job gets saved, and it will redirect the users to the Job Editor workspace.
Please go through the demonstration given-below to configure the Script Executor.
Git Config: Select an option from the drop-down.
Personal: If this option is selected, provide the following information:
Git URL: Enter the Git URL.
URL for Github:
URL for Gitlab:
User Name: Enter the GIT username.
Token: Enter the Access token or API token for authentication and authorization when accessing the Git repository, commonly used for secure automated processes like code fetching and execution.
Branch: Specify the Git branch for code fetching.
Script Type: Select the script's language for execution from the drop down:
GO
Julia
Python
Start Script: Enter the script name (with extension) which has to be executed.
For example, if Python is selected as the Script type, then the script name will be in the following format: script_name.py.
If Golang is selected as the Script type, then the script name will be in the following format: script_name.go.
Start Function: Specify the initial function or method within the Start Script for execution, particularly relevant for languages like Python with reusable functions.
Repository: Provide the Git repository name.
Input Arguments: Allows users to provide input parameters or arguments needed for code execution, such as dynamic values, configuration settings, or user inputs affecting script behavior.
Admin: If this option is selected, then Git URL, User Name, Token & Branch fields have to be configured in the platform in order to use Script Executor.
In this option, the user has to provide the following fields:
Script Type
Write using: There are three(3) options available under this tab:
Shared Access Signature:
Secret Key
Principal Secret
Provide the following details:
Shared Access Signature: This is a URI that grants restricted access rights to Azure Storage resources.
Account Name: Provide the Azure account name.
Container: Provide the container name from where the blob is located. A container is a logical unit of storage in Azure Blob Storage that can hold blobs. It is similar to a directory or folder in a file system, and it can be used to organize and manage blobs.
Blob Name: Enter the Blob name. A blob is a type of object storage that is used to store unstructured data, such as text or binary data, like images or videos.
File Format: There are four(4) types of file extensions are available under it, select the file format in which the data has to be written:
CSV
JSON
PARQUET
Save Mode: Select the Save mode from the drop down.
Append
Overwrite
Schema File Name: Upload spark schema file in JSON format.
Account Key: Enter the azure account key. In Azure, an account key is a security credential that is used to authenticate access to storage resources, such as blobs, files, queues, or tables, in an Azure storage account.
Account Name: Provide the Azure account name.
Container: Provide the container name from where the blob is located. A container is a logical unit of storage in Azure Blob Storage that can hold blobs. It is similar to a directory or folder in a file system, and it can be used to organize and manage blobs.
Blob Name: Enter the Blob name. A blob is a type of object storage that is used to store unstructured data, such as text or binary data, like images or videos.
File type: There are four(4) types of file extensions are available under it:
CSV
JSON
PARQUET
Schema File Name: Upload spark schema file in JSON format.
Save Mode: Select the Save mode from the drop down.
Append
Overwrite
Provide the following details:
Client ID: Provide Azure Client ID. The client ID is the unique Application (client) ID assigned to your app by Azure AD when the app was registered.
Tenant ID: Provide the Azure Tenant ID. Tenant ID (also known as Directory ID) is a unique identifier that is assigned to an Azure AD tenant, which represents an organization or a developer account. It is used to identify the organization or developer account that the application is associated with.
Client Secret: Enter the Azure Client Secret. Client Secret (also known as Application Secret or App Secret) is a secure password or key that is used to authenticate an application to Azure AD.
Account Name: Provide the Azure account name.
Container: Provide the container name from where the blob is located. A container is a logical unit of storage in Azure Blob Storage that can hold blobs. It is similar to a directory or folder in a file system, and it can be used to organize and manage blobs.
Blob Name: Enter the Blob name. A blob is a type of object storage that is used to store unstructured data, such as text or binary data, like images or videos.
File type: There are four(4) types of file extensions are available under it:
CSV
JSON
PARQUET
Save Mode: Select the Save mode from the drop down.
Append
Overwrite
Schema File Name: Upload spark schema file in JSON format.
The user can access the Job Monitoring icon on the List Jobs and Job Workflow Editor pages.
Navigate to the List Jobs page.
The Job Monitoring icon can be seen for all the listed Jobs.
OR
Navigate to the Job Workflow Editor page.
The Job Monitoring icon is provided on the Header panel.
The Job Monitoring page opens displaying the details of resource usage for the selected job.
The Job Monitoring page displays the following information for the selected Job:
Job: Name of the Job.
Status: Running status of the Job. 'True' indicates the Job is active, while 'False' indicates inactivity.
Last Activated: Date and time when the job was last activated.
Last Deactivated: Date and time when the job was last deactivated.
Total Allocated CPU: Total allocated CPU in cores.
Total Allocated Memory: Total allocated memory in MB.
Total Consumed CPU: Total consumed CPU by the Job in cores.
Total Consumed Memory: Total consumed memory by the Job in MB.
Instance Name: Instance name of the Job (e.g., Driver and Executors for Spark and PySpark Jobs).
Last Processed Time: Last processed time of the instance.
Min CPU Usage: Minimum CPU usage in cores by the instance.
Max CPU Usage: Maximum CPU usage in cores by the instance.
Min Memory Usage: Minimum memory usage in MB by the instance.
Max Memory Usage: Maximum memory usage in MB by the instance.
CPU Utilization: Total CPU utilization in cores by the instance.
Memory Utilization: Total memory utilization in MB by the instance.
There are two tabs present on the Job Monitoring page:
Monitor: This tab will show all the resource allocated and consumption details for each task or instance in the job.
System Logs: This tab will show the Pods logs of the Job.
Once the user clicks on any instance, the page will expand to show the graphical representation of CPU and Memory usage over the given interval of time. For reference, please see the images below.
The below-given images displays Monitoring page for the Spark Job with details on the Spark driver and executor.
Displaying the monitoring details of the Spark Job Driver
Displaying the monitoring details of the Spark Job Executer
The below-given images displays Monitoring page for the PySpark Job with details on the PySpark driver and executor.
Displaying the monitoring details of the PySpark Job Driver
Displaying the monitoring details of the PySpark Job Executer
If Memory or Core allocated to the component is less than required, then it will be displayed in red color as shown in the below image.
Clear: It will clear all the monitoring details of the selected Job.
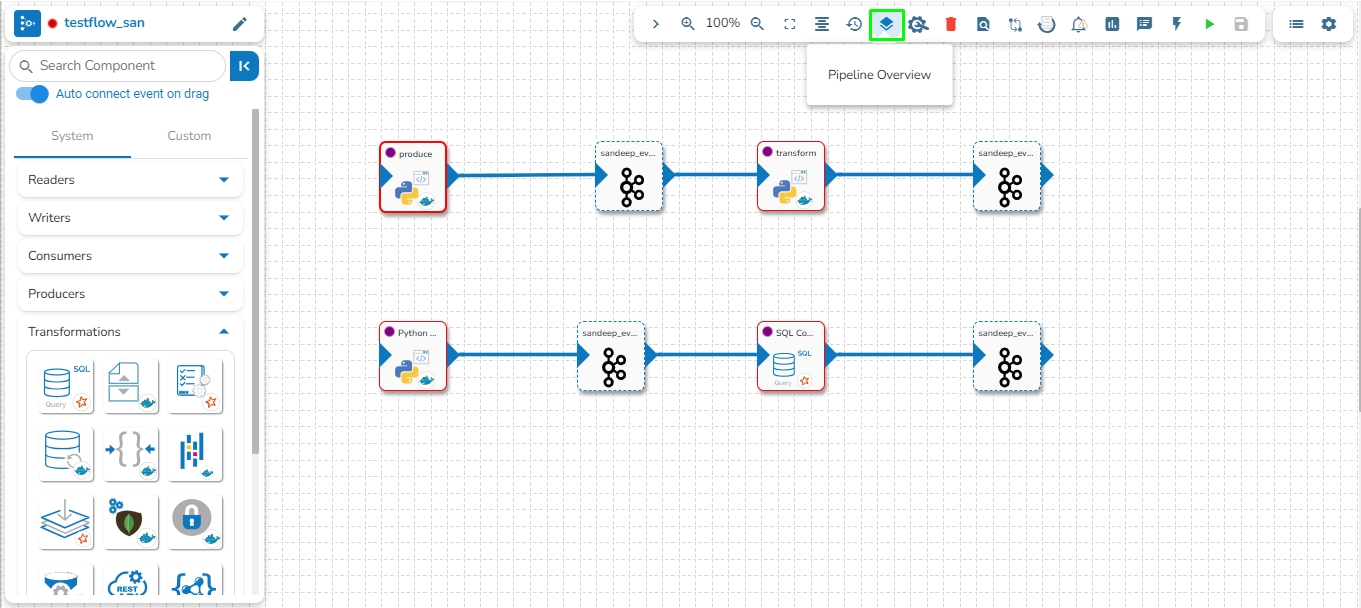
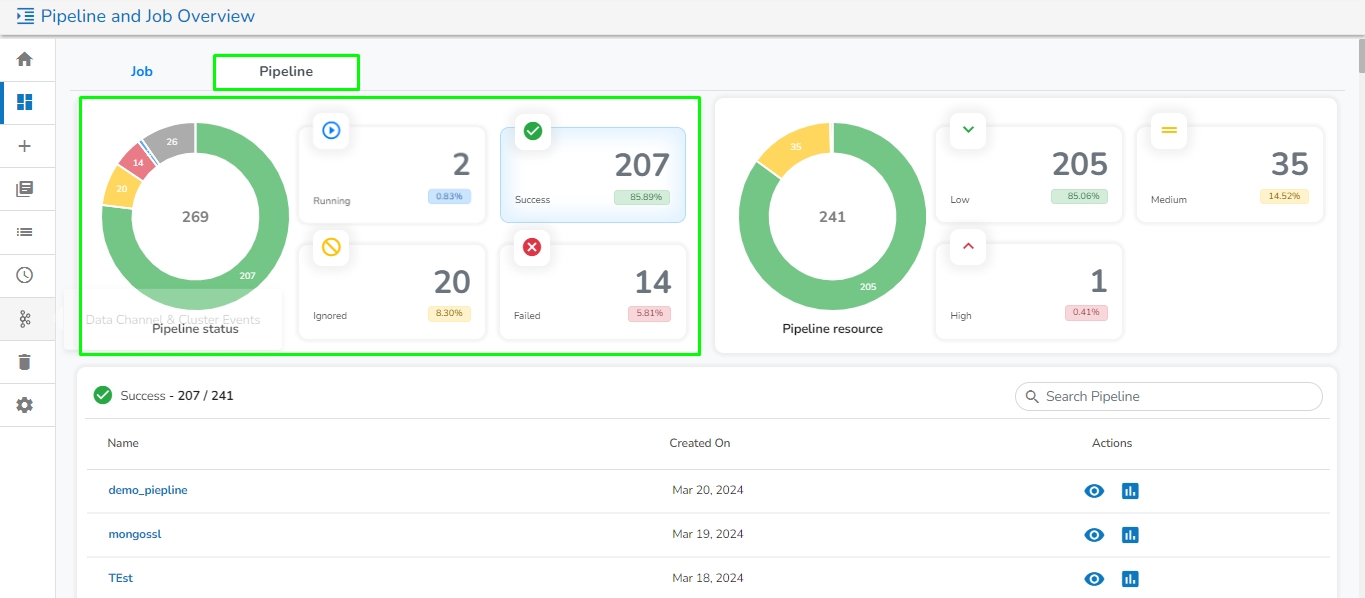
The Test suite module helps the developers to create a unit test for every component on the pipeline. We can upload input data and expected output data for every test case this will be then compared with the actual output generated by the component.
Check out the below-given walk through to understand the Pipeline Testing functionality.
The Test suite provides the following comparisons:
Compare no. of rows generated with the given output.
Compare no. of columns with the given output
Compare actual data with the given output
Schema validation with given schema.
Navigate to the Pipeline toolbar.
Click on Pipeline Testing.
The Test Framework page opens displaying details of the selected pipeline.
Search Component: A Search bar is provided to search all components associated with that pipeline. It helps to find a specific component by inserting the name in the Search Bar.
Component Panel: It displays all the components associated with that pipeline.
Create Test Case: By clicking on the Create Test Case icon.
Click the Create Test Case icon.
The Test Case opens. Here, the user can create a new test case for the selected component from the component panel.
Test Name: Enter the test case name.
Run Test Cases: It will run single and multiple test cases for the selected component by clicking on the Run Test Cases button.
Test Cases: It displays the created test cases list for the selected component.
It displays the following the details:
Checkbox: The User can select multiple or single test cases while running the test cases.
Test Name: It displays name of the test case.
Test Case Description: It displays description of the test case.
The user can update the test case details under this tab.
Test Case Name: The User can change the test case name.
Test Description: The User can change the description of the test case.
Output Schema File: A User can change the schema of expected output data by clicking on the upload icon, view the schema by clicking on the view icon, remove the schema by clicking on cross icon.
The user can check the existing input data by clicking on this tab. It contains Shrink, Expand, Upload, Remove icon.
Shrink: It Shrink the input data rows.
Expand: It expand the input data rows.
Upload: User can upload input data file by clicking on upload button.
Remove:
The user can check existing expected output data. It contains Shrink, Expand, Upload, Remove icon.
Shrink: It Shrink the expected output data rows.
Expand: It expand the expected output data rows.
Upload: User can upload expected output data file by clicking on upload button.
It displays the selected latest and previous test case reports.
Reports: It displays the latest report of each test cases for selected component. It displays each Test case name, Component Version, Comparison Logics and Run date.
It displays the log details of the component.
It displays the component pods, if user run test case.
This page aims to explain the various transformation options provided on the Jobs Editor page.
The following transformations are provided under the Transformations section.
Alter Columns
Select Columns
Date Formatter
Query
Filter
Formula
Join
Aggregation
Sort Task
The Alter Columns command is used to change the data type of a column in a table.
Add the Column name from the Alter Columns tab where the datatype needs to be changed.
Name (*): Column name.
Alias Name(*) : New column name.
Column Type(*): Specify datatype from dropdown.
Add New Column: Multiple columns can be added for desired modification in the datatype.
Helps to select particular columns from a table definition.
Name (*): Column name.
Alias Name(*) : New column name.
Column Type(*) : Specify datatype from dropdown.
Add New Column: Multiple columns can be added for the desired result
It helps in converting Date and Datetime columns to a desired format.
Name (*): Column name.
Input Format(*) : The function has total 61 different formats.
Output Format(*): The format in which the output will be given.
Output Column Name
The Query transformation allows you to write SQL (DML) queries such as Select queries and data view queries.
Query(*): Provide a valid query to transform data.
Table Name(*): Provide the table name.
Schema File Name: Upload Spark Schema file in JSON format.
Choose File
The Filter columns allow the user to filter table data based on different defined conditions.
Field Name(*): Provide field name.
Condition (*): 8 condition operations are available within this function.
Logical Condition(*)(AND/OR):
Add New Column:
It gives computation results based on the selected formula type.
Field Name(*): Provide field name.
Formula Type(*): Select a Formula Type from the drop-down option.
Math (22 Math Operations)
It joins 2 tables based on the specified column conditions.
Join Type (*): Provides drop-down menu to choose a Join type.
The supported Join Types are:
Inner
An aggregate task performs a calculation on a set of values and returns a single value by using the Group By column.
Group By Columns(*): Provide a name for the group by column.
Field Name(*): Provide the field name.
Operation (*): 30 operations are available within this function.
Alias
This transformation sorts all the data from a table based on the selected column and order.
Sort Key(*): Provide a sort key.
Order(*): Select an option out of Ascending or Descending.
Add New Column: Adds a new column.
GCS Reader component is typically designed to read data from Google Cloud Storage (GCS), a cloud-based object storage service provided by Google Cloud Platform. A GCS Reader can be a part of an application or system that needs to access data stored in GCS buckets. It allows you to retrieve, read, and process data from GCS, making it accessible for various use cases, such as data analysis, data processing, backups, and more.
GCS Reader pulls data from the GCS Monitor, so the first step is to implement GCS Monitor.
Note: The users can refer to the GCS Monitor section of this document for the details.
All component configurations are classified broadly into the following sections:
Meta Information
Navigate to the Pipeline Workflow Editor page for an existing pipeline workflow with GCS Monitor and Event component.
Open the Reader section of the Component Pallet.
Drag the GCS Reader to the Workflow Editor.
Click on the dragged GCS Reader component to get the component properties tabs below.
It is the default tab to open for the component while configuring it.
Invocation Type: Select an invocation mode from the ‘Real-Time’ or ‘Batch’ using the drop-down menu.
Deployment Type: It displays the deployment type for the reader component. This field comes pre-selected.
Container Image Version: It displays the image version for the docker container. This field comes pre-selected.
Bucket Name: Enter the Bucket name for GCS Reader. A bucket is a top-level container for storing objects in GCS.
Directory Path: Enter the path where the file is located, which needs to be read.
File Name: Enter the file name.
Navigate to the Pipeline Workflow Editor page for an existing pipeline workflow with the PySpark GCS Reader and Event component.
OR
You may create a new pipeline with the mentioned components.
Open the Reader section of the Component Pallet.
Drag the PySpark GCS Reader to the Workflow Editor.
Click the dragged GCS Reader component to get the component properties tabs below.
Invocation Type: Select an invocation mode from the ‘Real-Time’ or ‘Batch’ using the drop-down menu.
Deployment Type: It displays the deployment type for the reader component. This field comes pre-selected.
Container Image Version: It displays the image version for the docker container. This field comes pre-selected.
Failover Event: Select a failover Event from the drop-down menu.
Secret File (*): Upload the JSON from the Google Cloud Storage.
Bucket Name (*): Enter the Bucket name for GCS Reader. A bucket is a top-level container for storing objects in GCS.
Path: Enter the path where the file is located, which needs to be read.
Read Directory: Disable reading single files from the directory.
Select the desired columns using the Download Data and Upload File options.
Or
The user can also use the Column Filter section to select columns.
Click the Save Component in Storage icon after doing all the configurations to save the reader component.
A notification message appears to inform about the component configuration success.
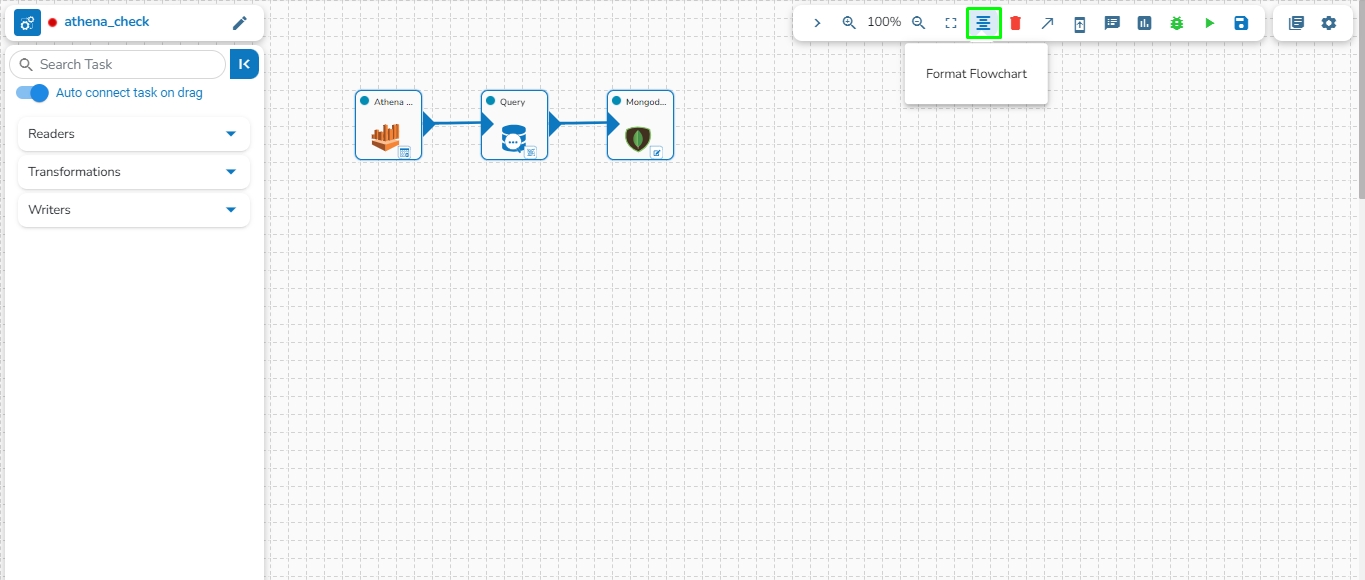
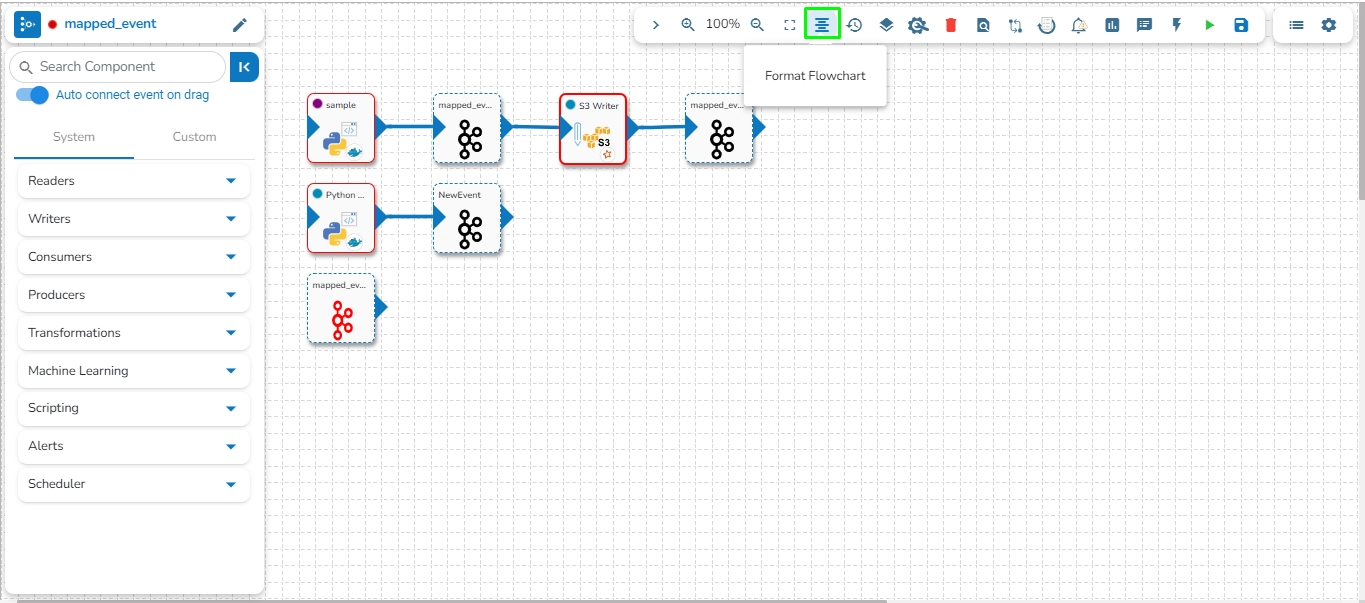
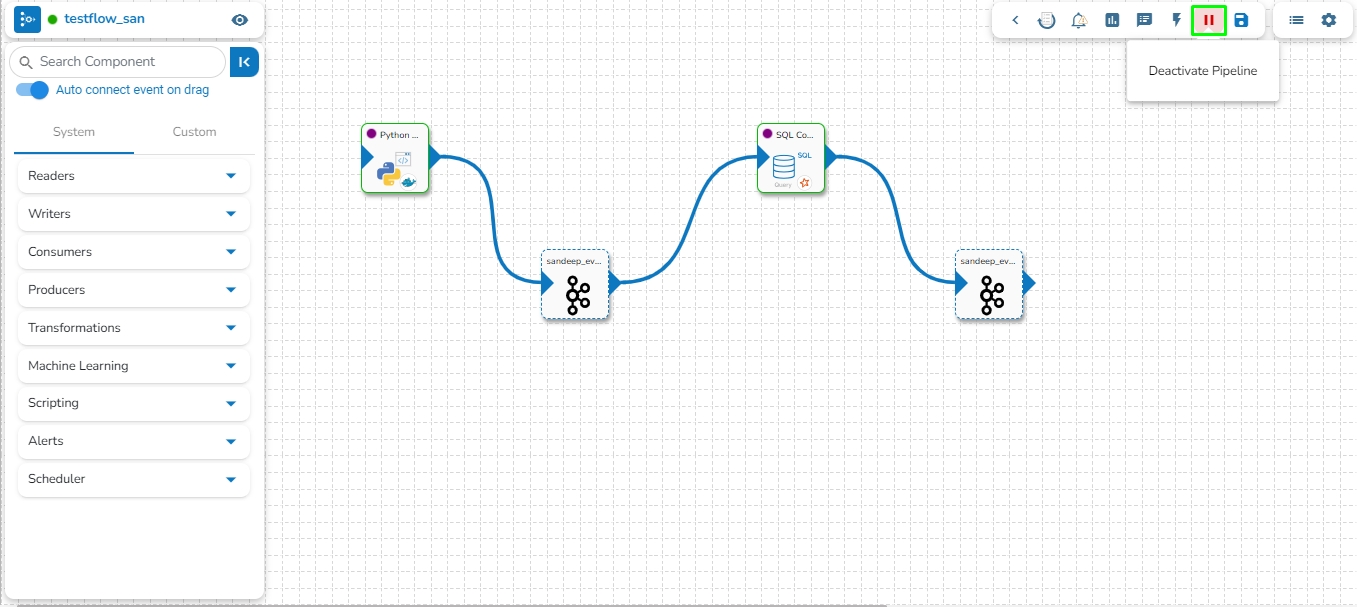
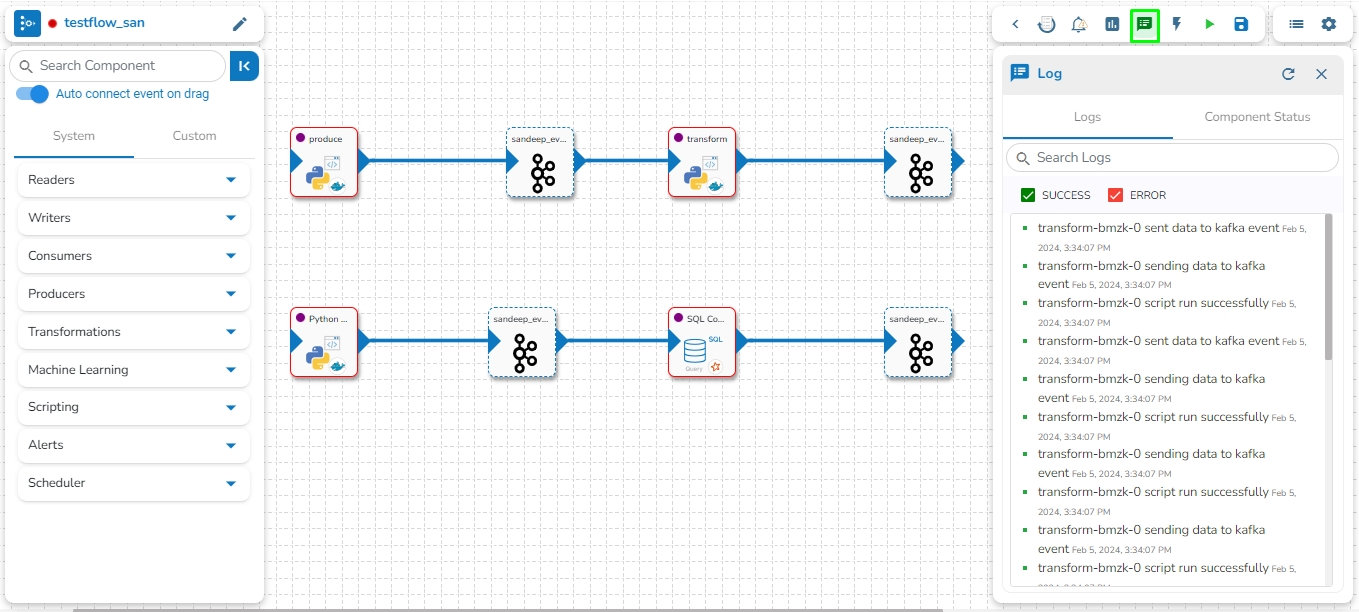
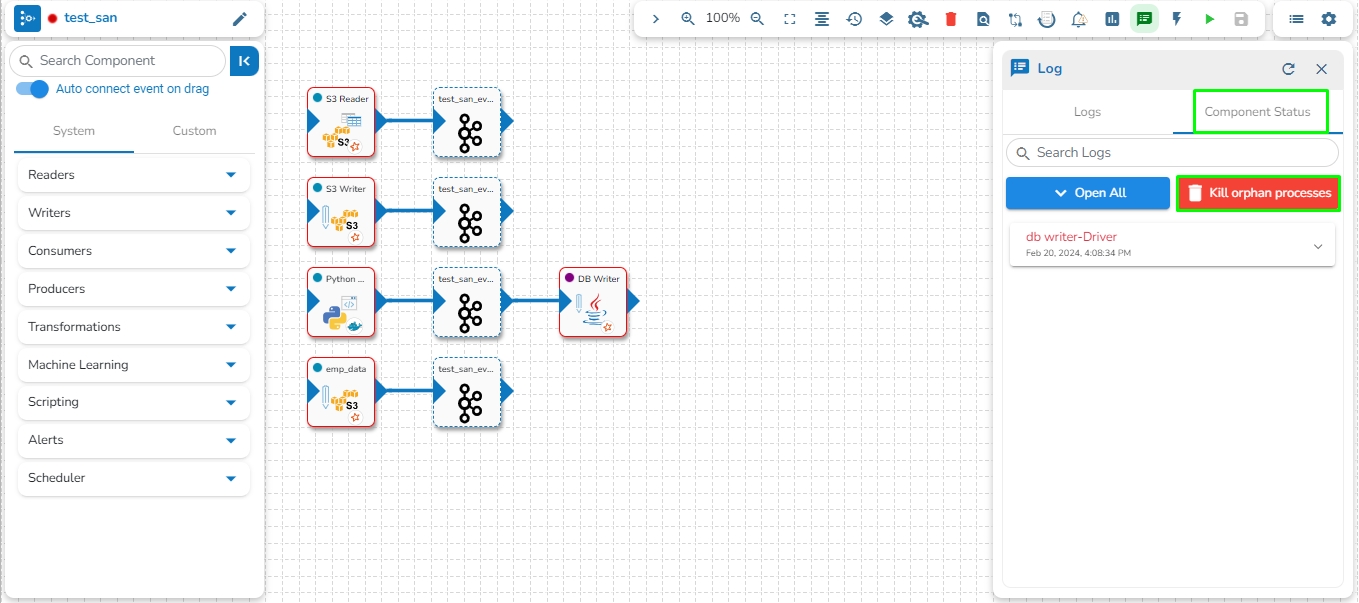
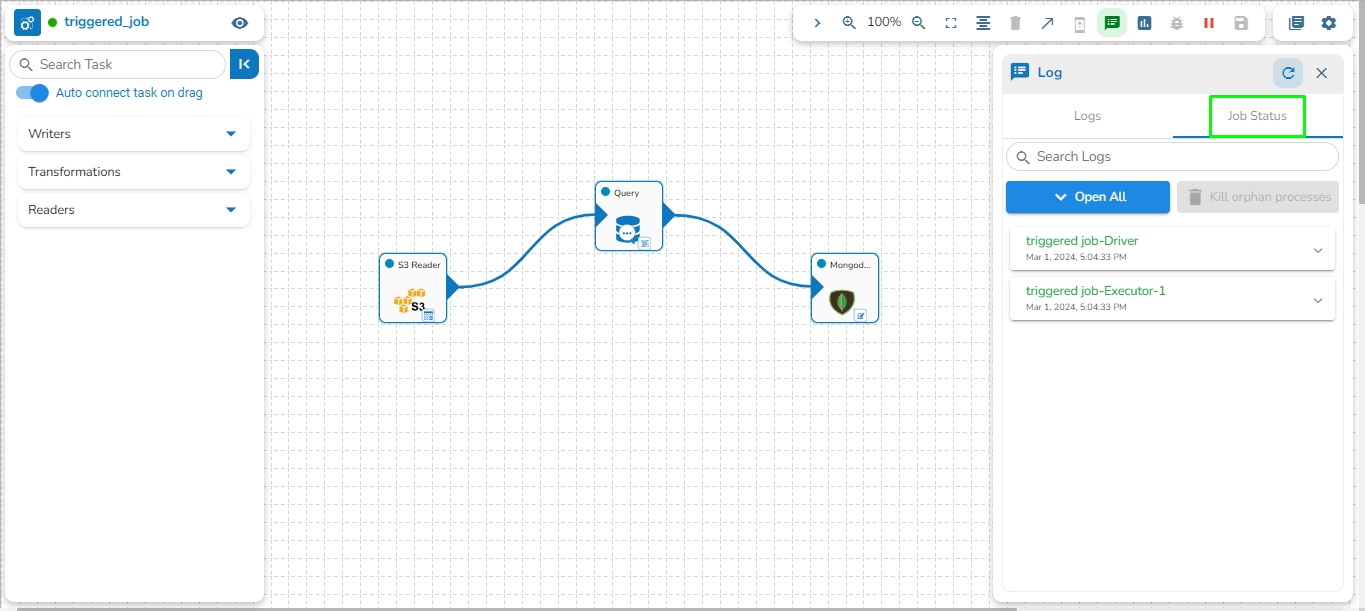
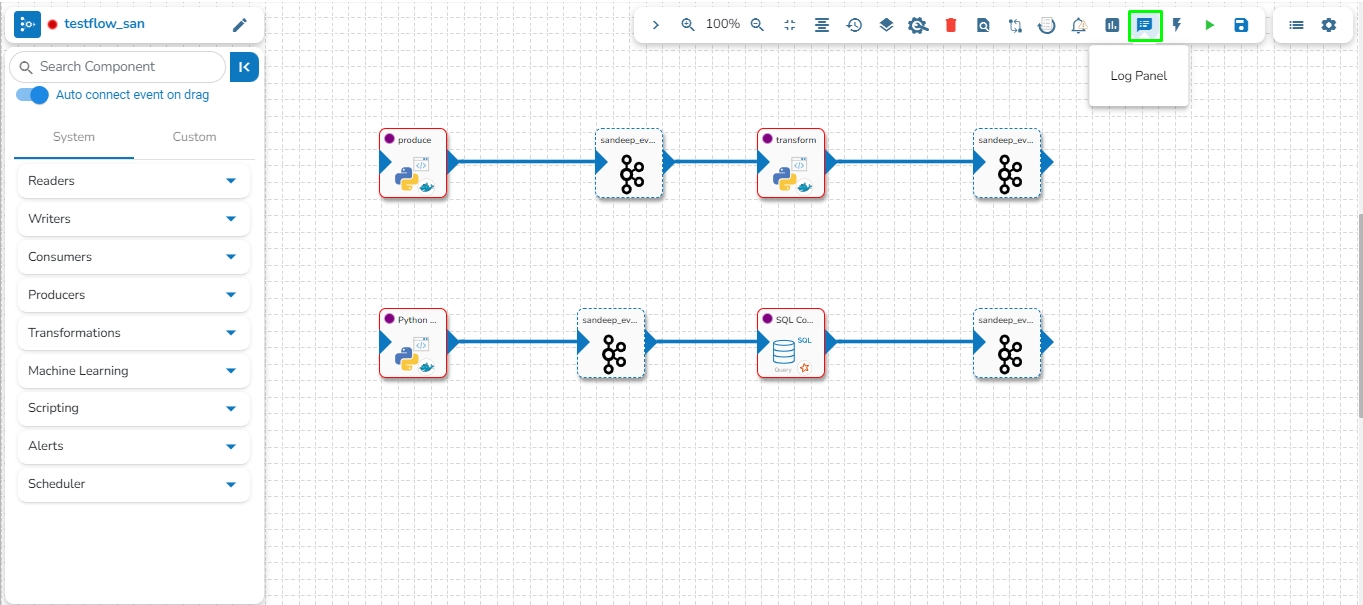
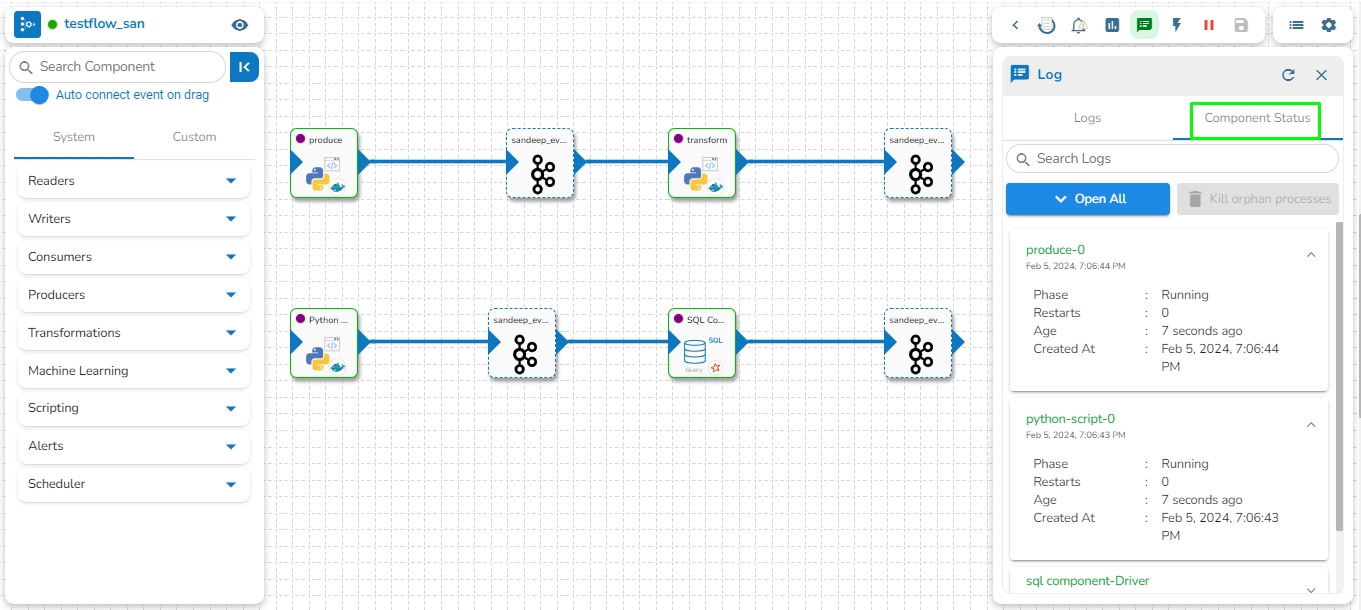
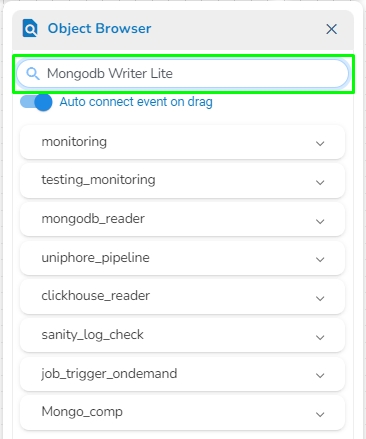
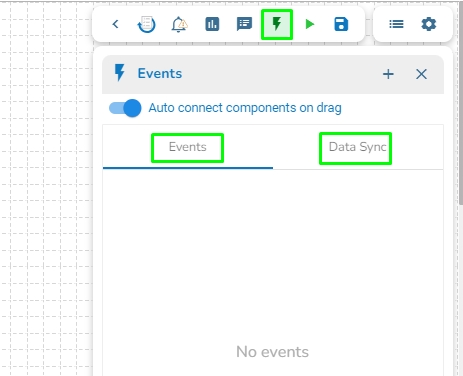
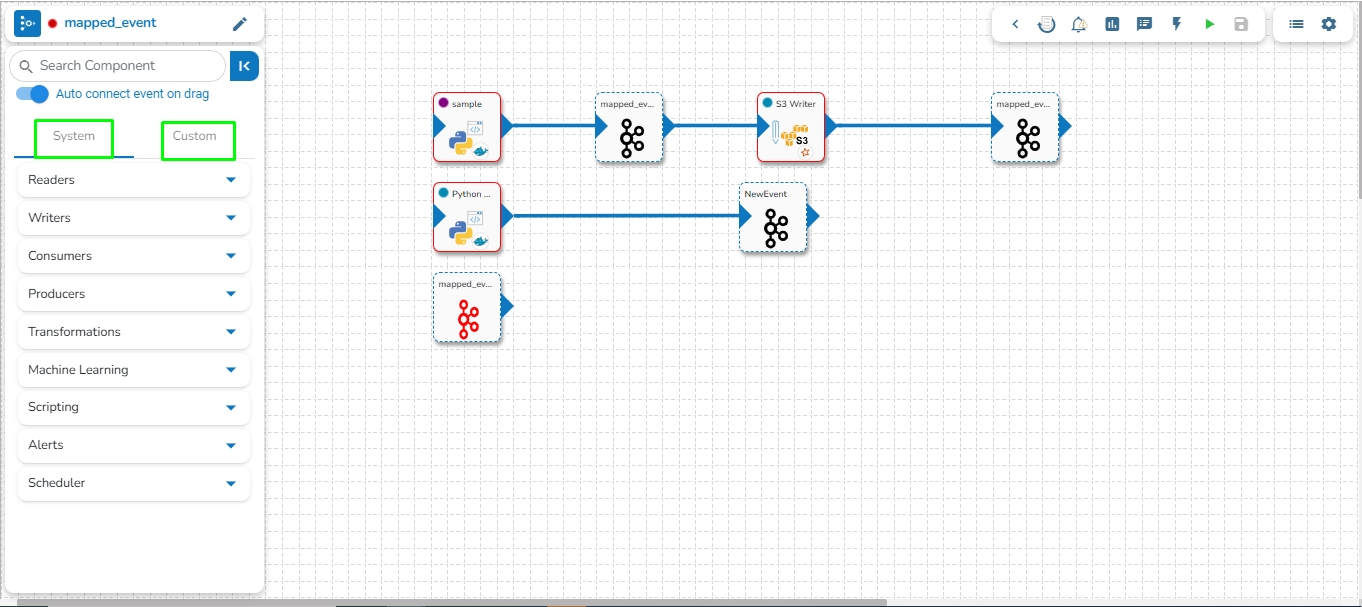
This page covers configuration details for the MongoDB Reader component.
A MongoDB reader is designed to read and access data stored in a MongoDB database. Mongo readers typically authenticate with MongoDB using a username and password or other authentication mechanisms supported by MongoDB.
All component configurations are classified broadly into the following sections:
Meta Information
select * from employee where Gender = 'Male';
//In the Spark SQL query above, the selected database contains a table named 'employee'. The query retrieves all records from the 'employee' table where the gender is specified as 'Male'.Row Tags: Provide the row tags from the XML files.
Join Row Tags: Enable this option to join multiple row tags.
False: When push down is set to False, predicate filters are not pushed down to the ORC storage layer. Instead, filtering is performed after the data has been read into memory by the processing engine. This may result in more data being read and potentially slower query performance compared to when push down is enabled.

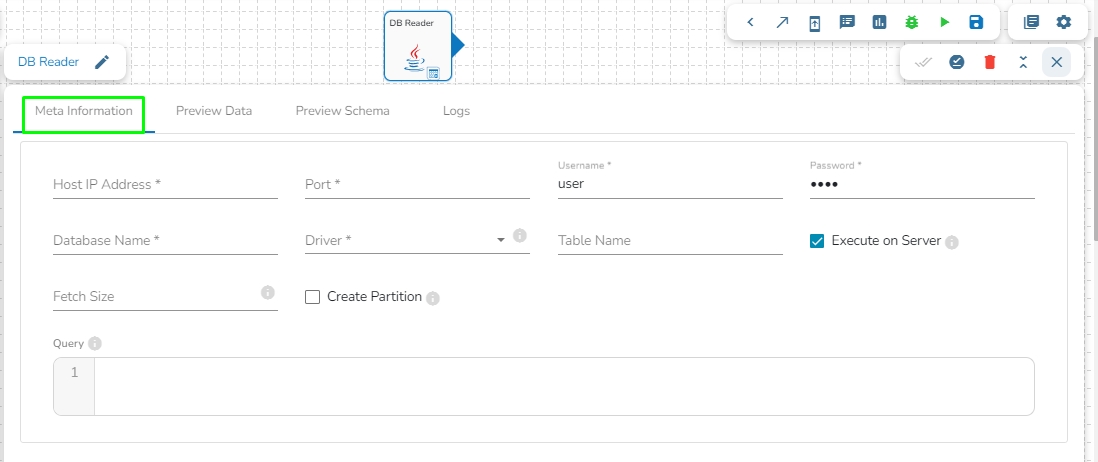
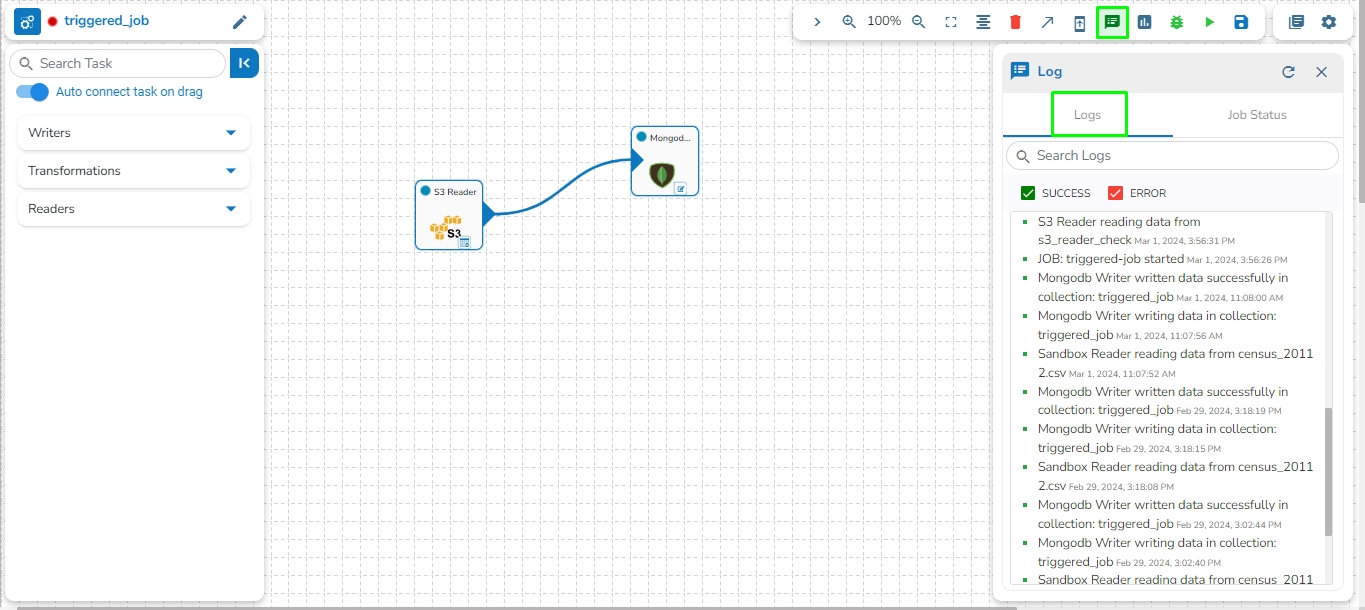
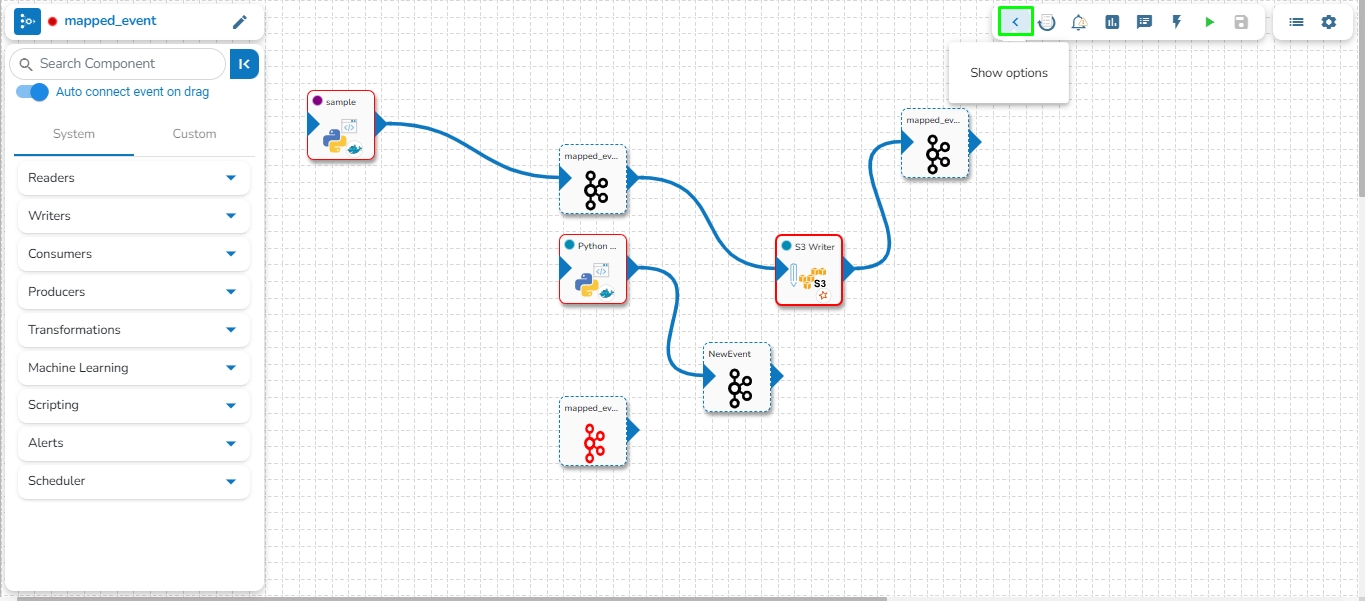
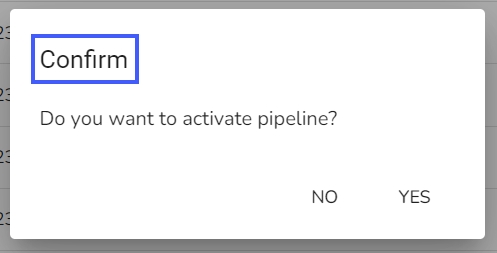
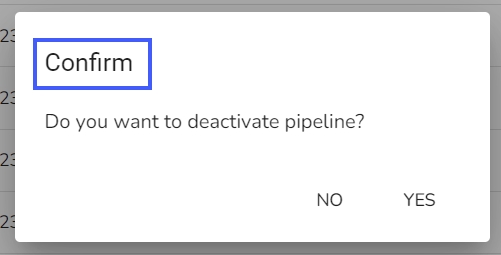

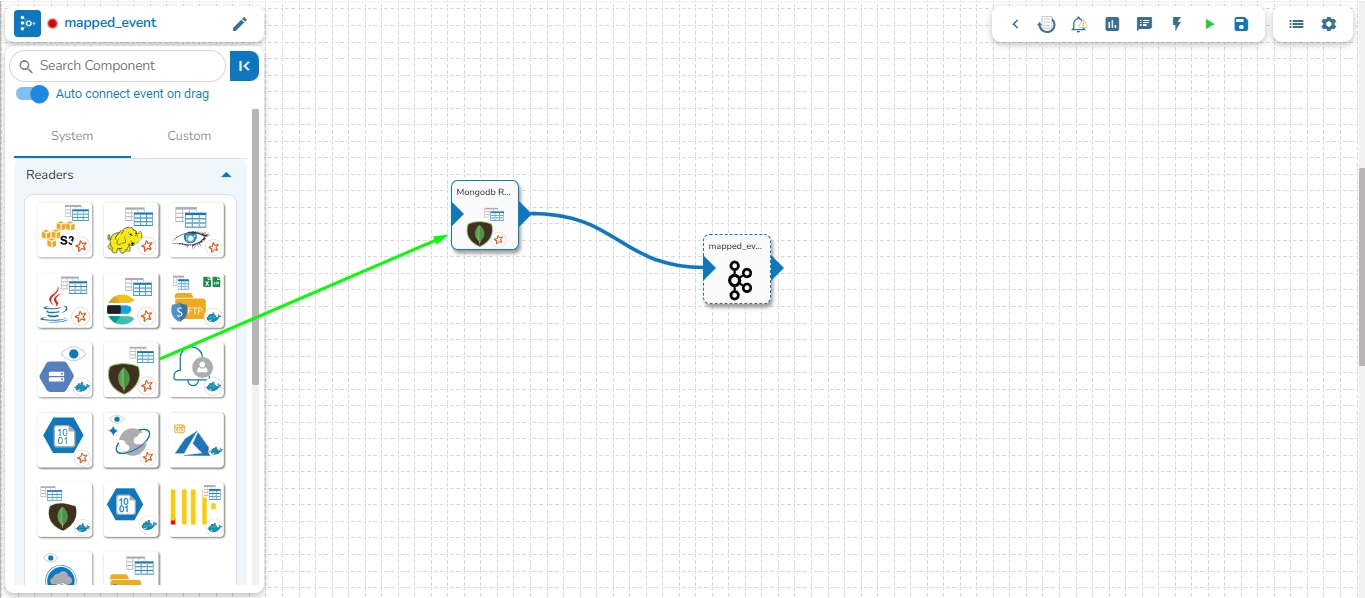
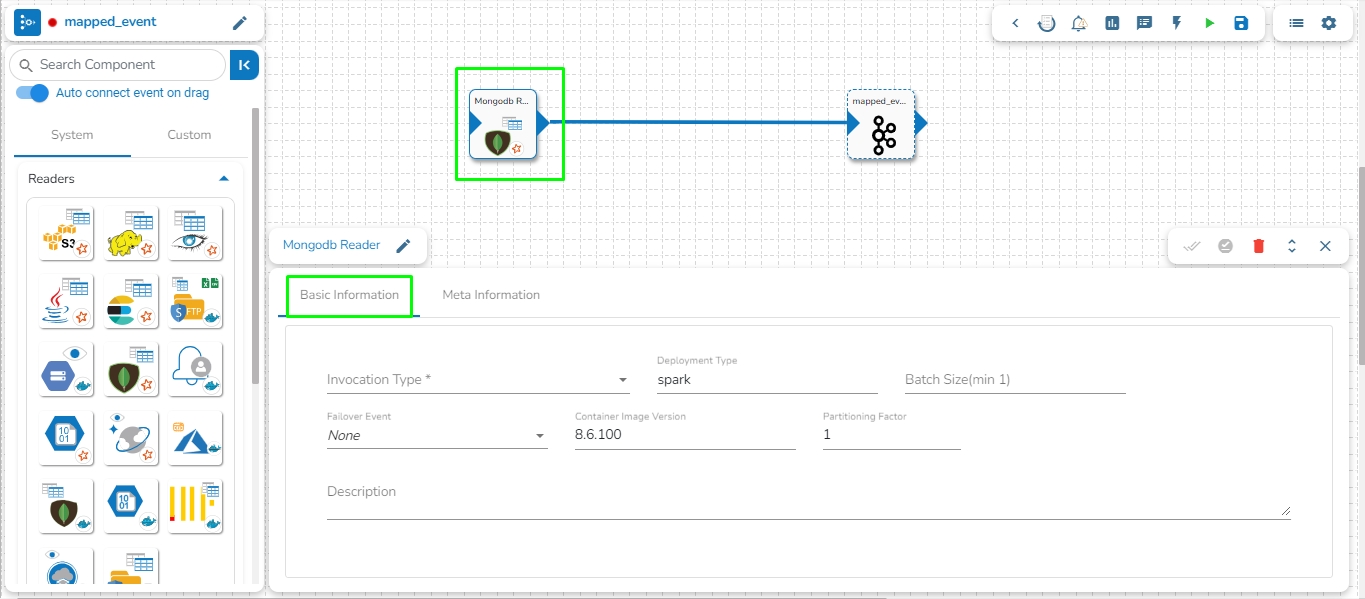
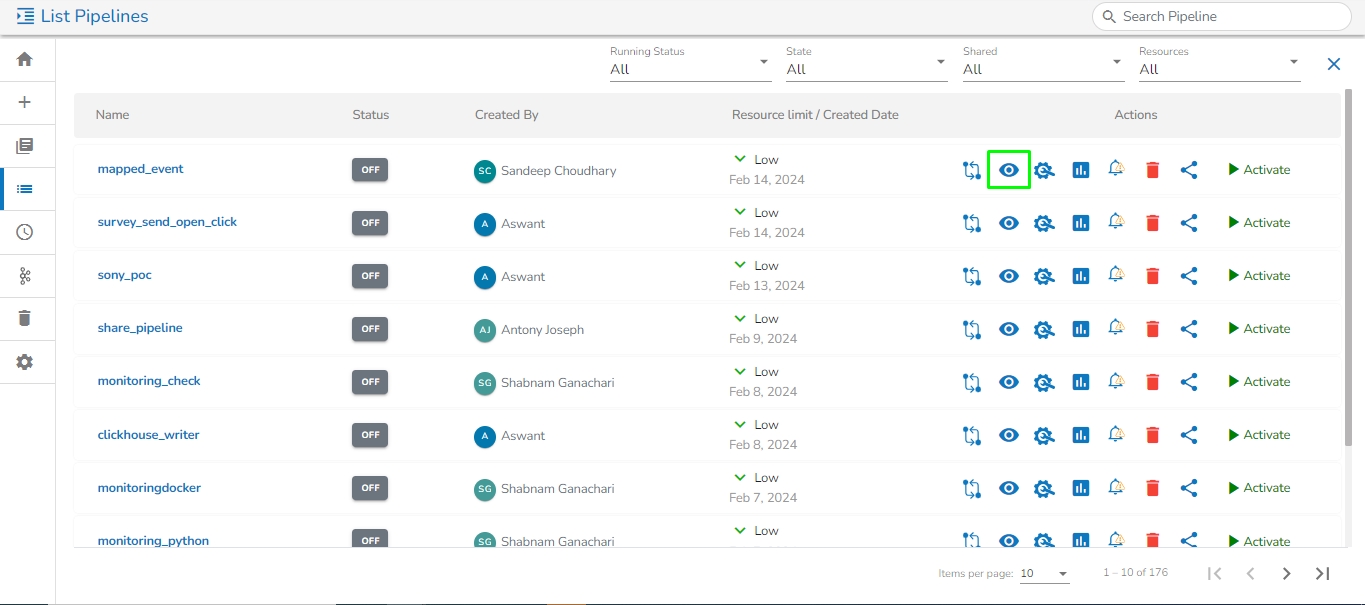
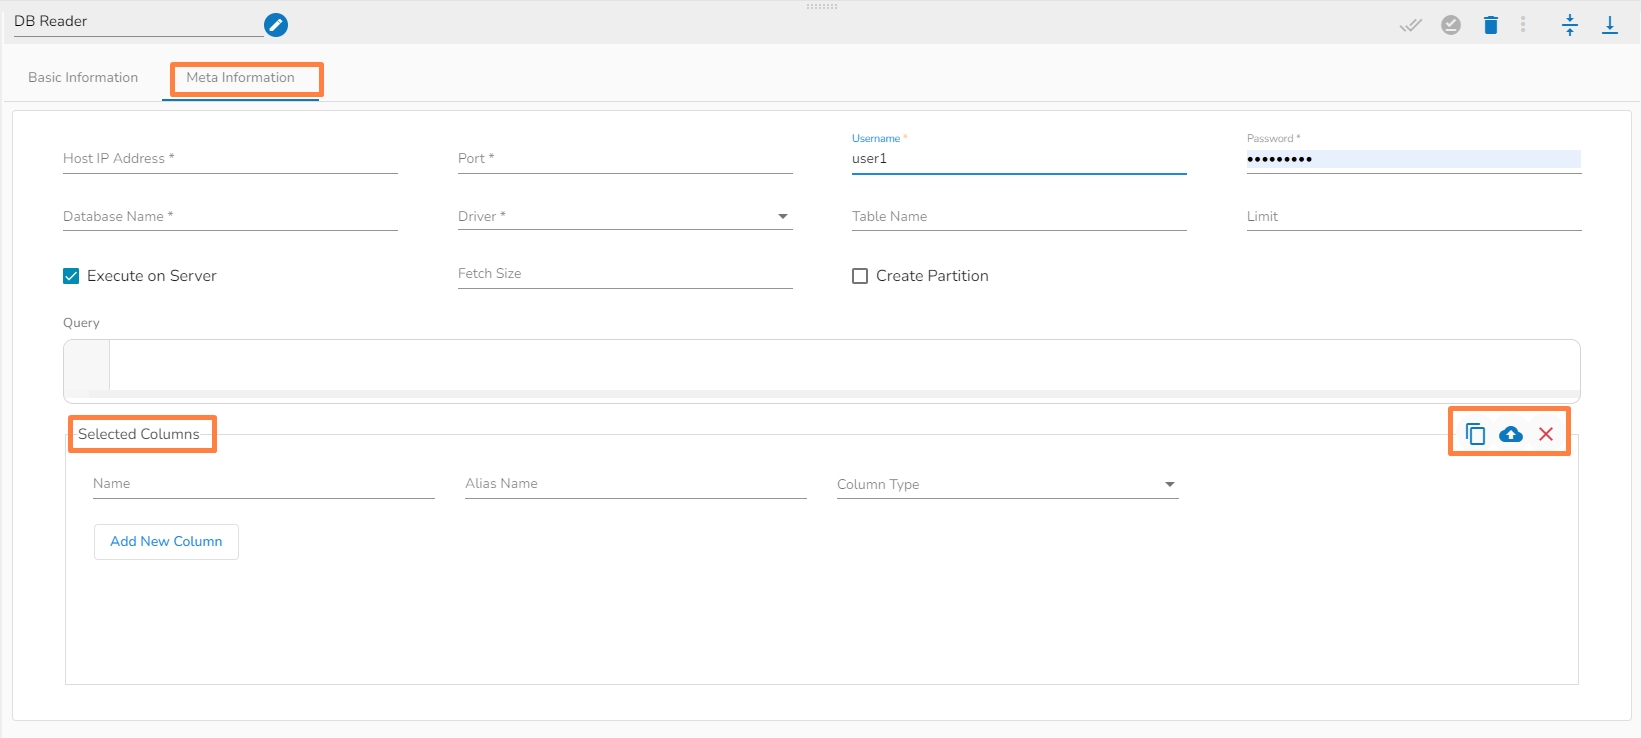
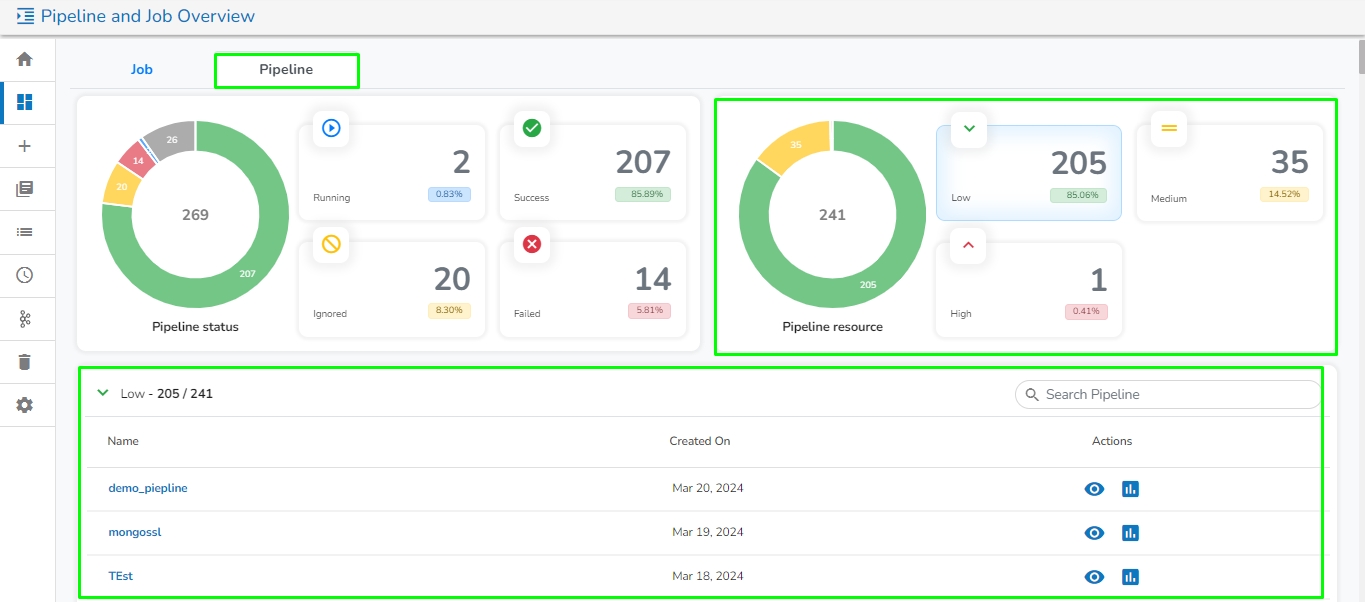

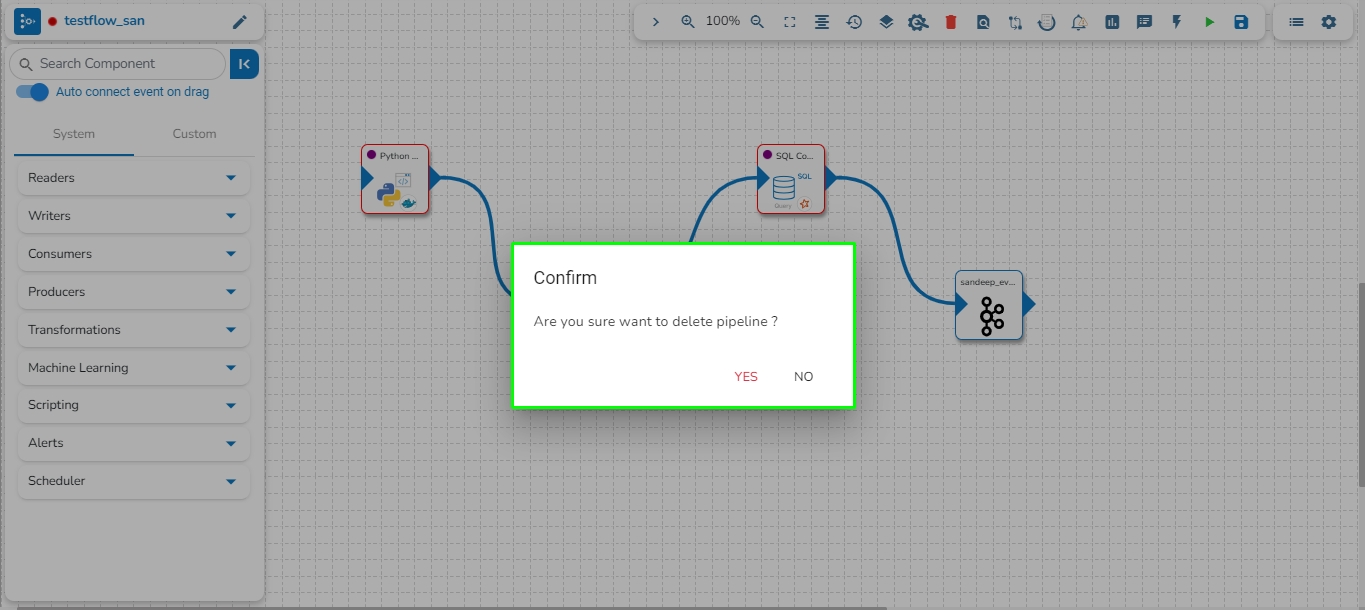


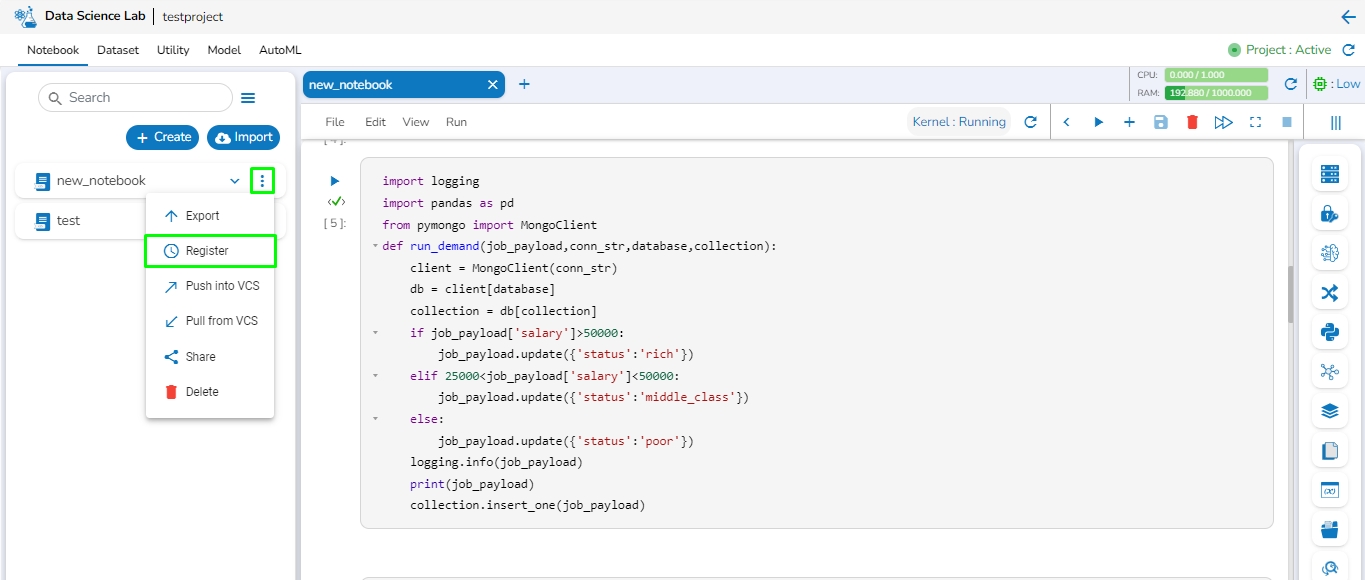
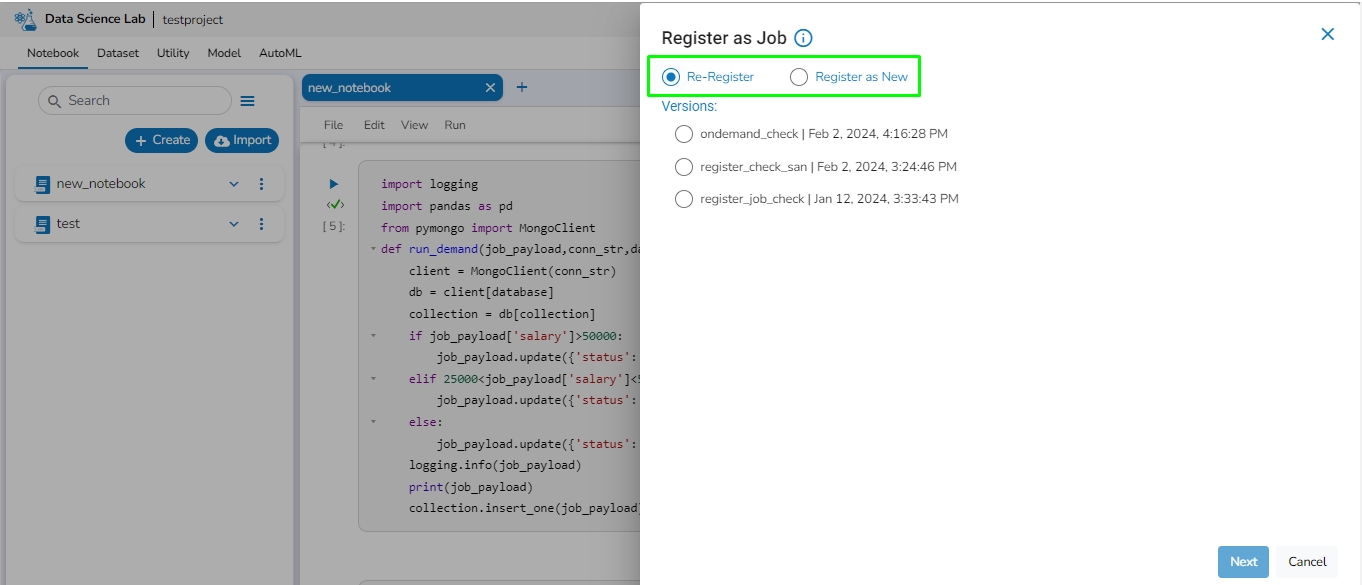
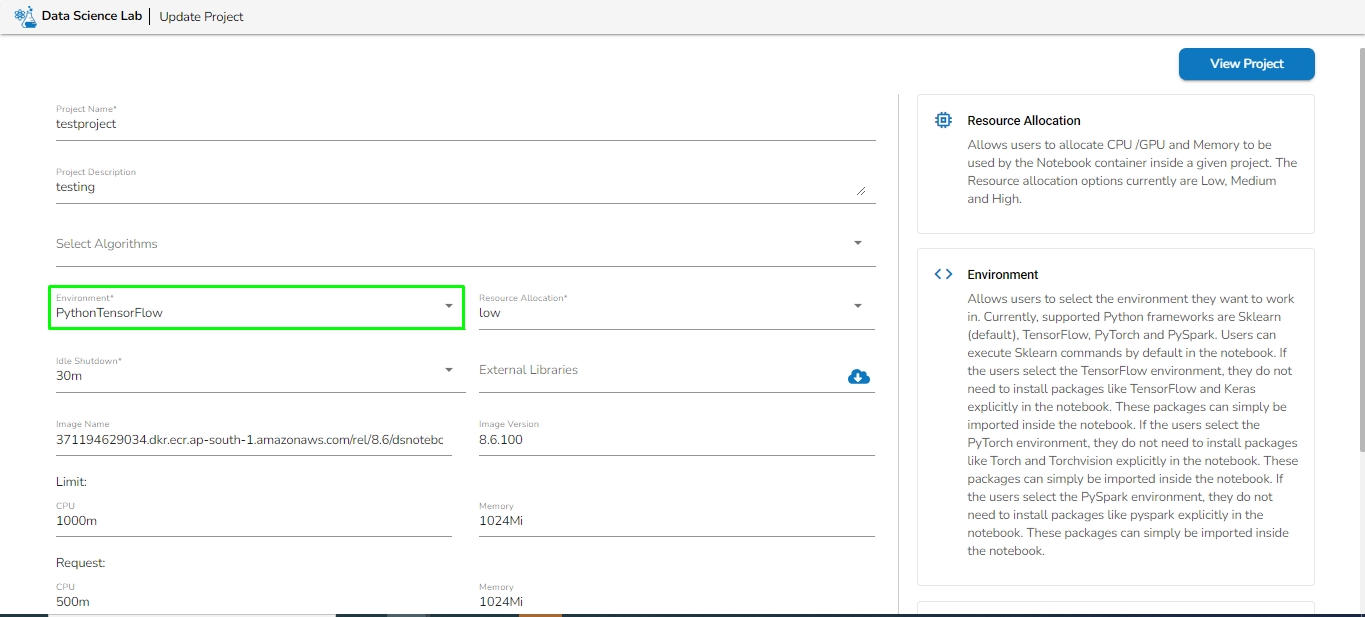
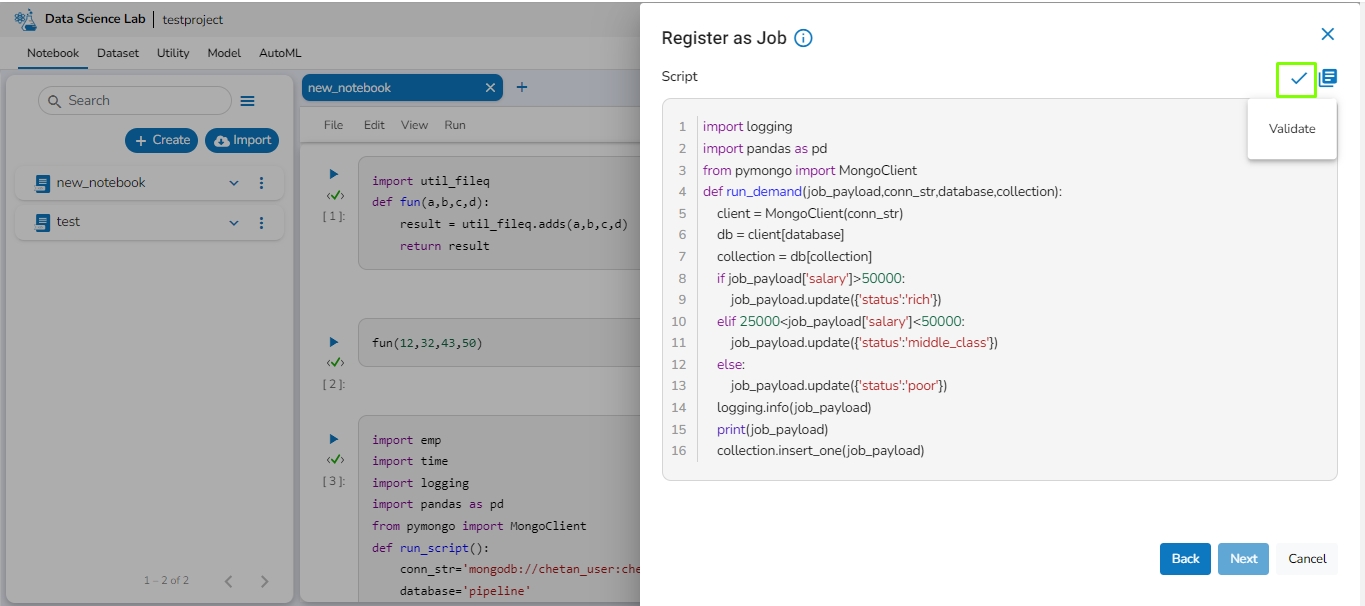
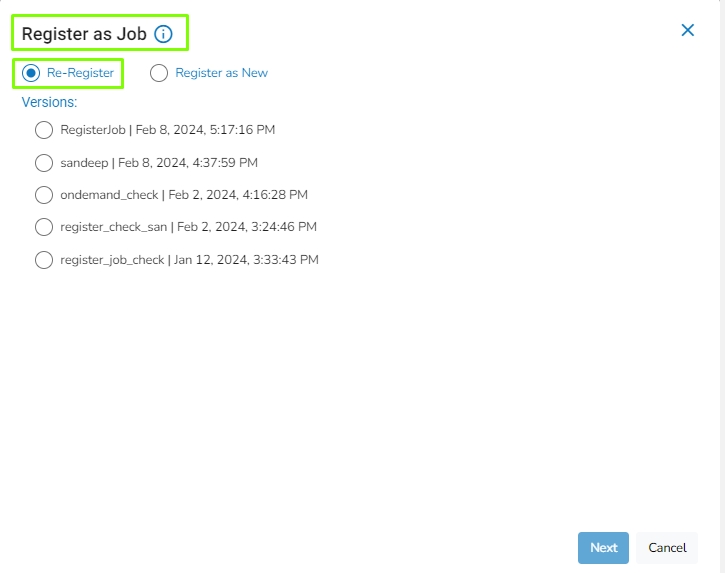
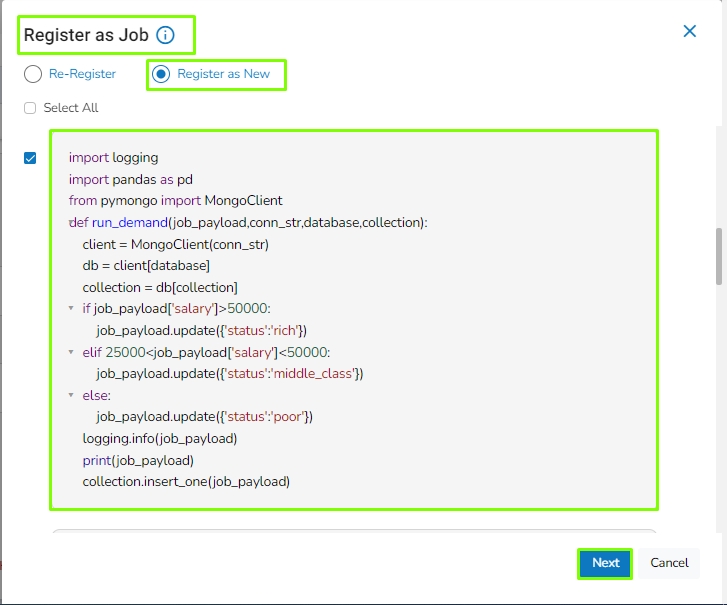
PARQUET: No extra field gets displayed with PARQUET as the selected File Type.
AVRO: This File Type provides two drop-down menus.
Compression: Select an option out of the Deflate and Snappy options.
Compression Level: This field appears for the Deflate compression option. It provides 0 to 9 levels via a drop-down menu.
XML: Select this option to read XML file. If this option is selected, the following fields will get displayed:
Infer schema: Enable this option to get true schema of the column.
Path: Provide the path of the file.
Root Tag: Provide the root tag from the XML files.
Row Tags: Provide the row tags from the XML files.
Join Row Tags: Enable this option to join multiple row tags.
Start Function
Repository
Input Arguments
AVRO
AVRO
AVRO
Test Description: Enter the description of the test case.
Input Data File: Upload the input data file. It is required for transformations and writer’s components.
Output Data File: Upload the expected output data file.
Schema File: Upload the schema of expected output data.
Input Data Type: It supports the JSON type.
Assertion Method: It supports the equals assertion method.
Sort: It orders the column values in Actual Output. A User can sort the string and integer column values.
Comparison Logic: It contains four type of comparison logic:
Compare Number of Columns: It compares input data columns with output data columns.
Compare Data: It compares input data with output data.
Compare Number of Rows: It compares input data rows with output data rows.
Check Data Matches Schema: It checks the uploaded schema with expected output data.
Save: This button will save the test case and the test case will list in the Test Case list.
Delete Icon: The User can remove the test case by clicking on the delete icon.
Update: By clicking on the Update button user can update the test case details.
Last Updated Date: It displays the last updated date of the test case.
Add New Row: To insert a new row.
Bitwise (3 Bitwise Operations)
Output Field Name(*): Provide the output field name.
Add New Column: Adds a new column.
Full
Full outer
Left outer
Left
Right outer
Right
Left semi
Left anti
Left Column(*): Conditional column from the left table.
Right Column(*) : Conditional column from right table.
Add New Column: Adds a new column.
Add New Column: Adds a new column.
Batch Size (min 10): Provide the maximum number of records to be processed in one execution cycle (the minimum limit for this field is 10).
Batch Size (min 10): Provide the maximum number of records to be processed in one execution cycle (the minimum limit for this field is 10).
Limit: Set a limit for the number of records to be read.
File-Type: Select the File-Type from the drop-down.
File Type (*): Supported file formats are:
CSV: The Header, Multilibe, and Infer Schema fields will be displayed with CSV as the selected File Type. Enable the Header option to get the Header of the reading file and enable the Infer Schema option to get the true schema of the column in the CSV file. Check the Multiline option if there is any Multiline string in the file.
JSON: The Multiline and Charset fields are displayed with JSON as the selected File Type. Check in the Multiline option if there is any Multiline string in the file.
PARQUET: No extra field gets displayed with PARQUET as the selected File Type.
AVRO: This File Type provides two drop-down menus.
Compression: Select an option out of the Deflate and Snappy options.
Compression Level: This field appears for the Deflate compression option. It provides 0 to 9 levels via a drop-down menu.
XML: Select this option to read the XML file. If this option is selected, the following fields will be displayed:
Infer schema: Enable this option to get the true schema of the column.
Path: Provide the path of the file.
Root Tag: Provide the root tag from the XML files.
Query: Enter the Spark SQL query.


Please follow the demonstration to configure the component.
MongoDB Reader reads the data from the specified collection of Mongo Database. It has an option to filter data using spark SQL query.
Drag & Drop the MongoDB Reader on the Workflow Editor.
Click on the dragged reader component to open the component properties tabs below.
It is the default tab to open for the MongoDB reader while configuring the component.
Select an Invocation type from the drop-down menu to confirm the running mode of the reader component. Select the Real-Time or Batch option from the drop-down menu.
Deployment Type: It displays the deployment type for the component. This field comes pre-selected.
Container Image Version: It displays the image version for the docker container. This field comes pre-selected.
Failover Event: Select a failover Event from the drop-down menu.
Batch Size: Provide the maximum number of records to be processed in one execution cycle.
Connection Type: Select the connection type from the drop-down:
Standard
SRV
Connection String
Host IP Address (*): Hadoop IP address of the host.
Port(*): Port number (It appears only with the Standard Connection Type).
Username(*): Provide username.
Password(*): Provide a valid password to access the MongoDB.
Database Name(*): Provide the name of the database from where you wish to read data.
Collection Name(*): Provide the name of the collection.
Partition Column: specify a unique column name, whose value is a number .
Query: Enter a Spark SQL query. Take the mongo collection_name as the table name in Spark SQL query.
Limit: Set a limit for the number of records to be read from MongoDB collection.
Schema File Name: Upload Spark Schema file in JSON format.
Cluster Sharded: Enable this option if data has to be read from sharded clustered database. A sharded cluster in MongoDB is a distributed database architecture that allows for horizontal scaling and partitioning of data across multiple nodes or servers. The data is partitioned into smaller chunks, called shards, and distributed across multiple servers.
Additional Parameters: Provide the additional parameters to connect with MongoDB. This field is optional.
Enable SSL: Check this box to enable SSL for this components. MongoDB connection credentials will be different if this option is enabled.
Certificate Folder: This option will appear when the Enable SSL field is checked-in. The user has to select the certificate folder from drop down which contains the files which has been uploaded to the admin settings for connecting MongoDB with SSL. Please refer the below given images for the reference.
Sample Spark SQL query for MongoDB Reader:
The following images display the various possibilities of the Meta Information for the MongoDB Reader:
i. Meta Information Tab with Standard as Connection Type.
ii. Meta Information Tab with SRV as Connection Type.
iii. Meta Information Tab with Connection String as Connection Type.
Column Filter: The users can select some specific columns from the table to read data instead of selecting a complete table; this can be achieved via the Column Filter section. Select the columns which you want to read and if you want to change the name of the column, then put that name in the alias name section otherwise keep the alias name the same as of column name and then select a Column Type from the drop-down menu.
or
Use the Download Data and Upload File options to select the desired columns.
1. Upload File: The user can upload the existing system files (CSV, JSON) using the Upload File icon (file size must be less than 2 MB).
2. Download Data (Schema): Users can download the schema structure in JSON format by using the Download Data icon.
After doing all the configurations click the Save Component in Storage icon provided in the reader configuration panel to save the component.
A notification message appears to inform about the component configuration success.
Redirect to the page listing all the accessible Pipelines by the user.
Redirects to the Scheduler List page.
Redirects to the page containing the information on Data Channel & Cluster Events.
Redirects to the Trash page.
Redirects to the Settings page.


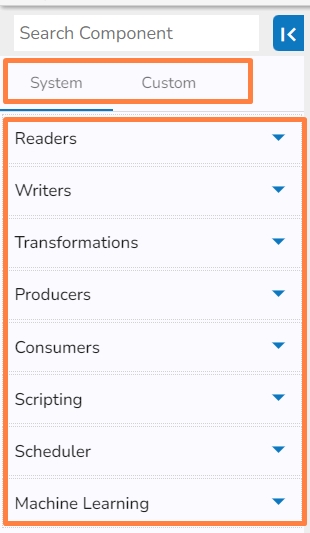
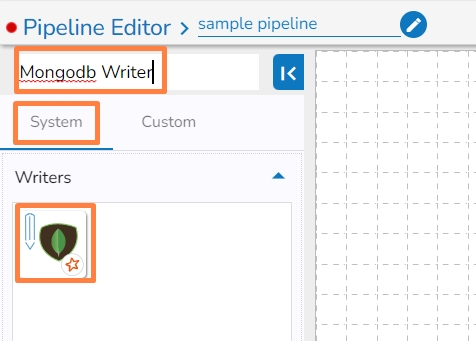
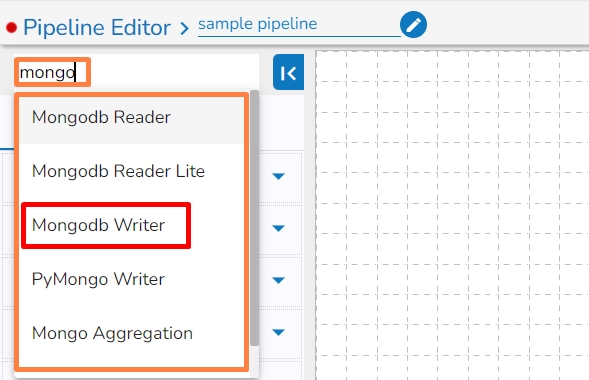
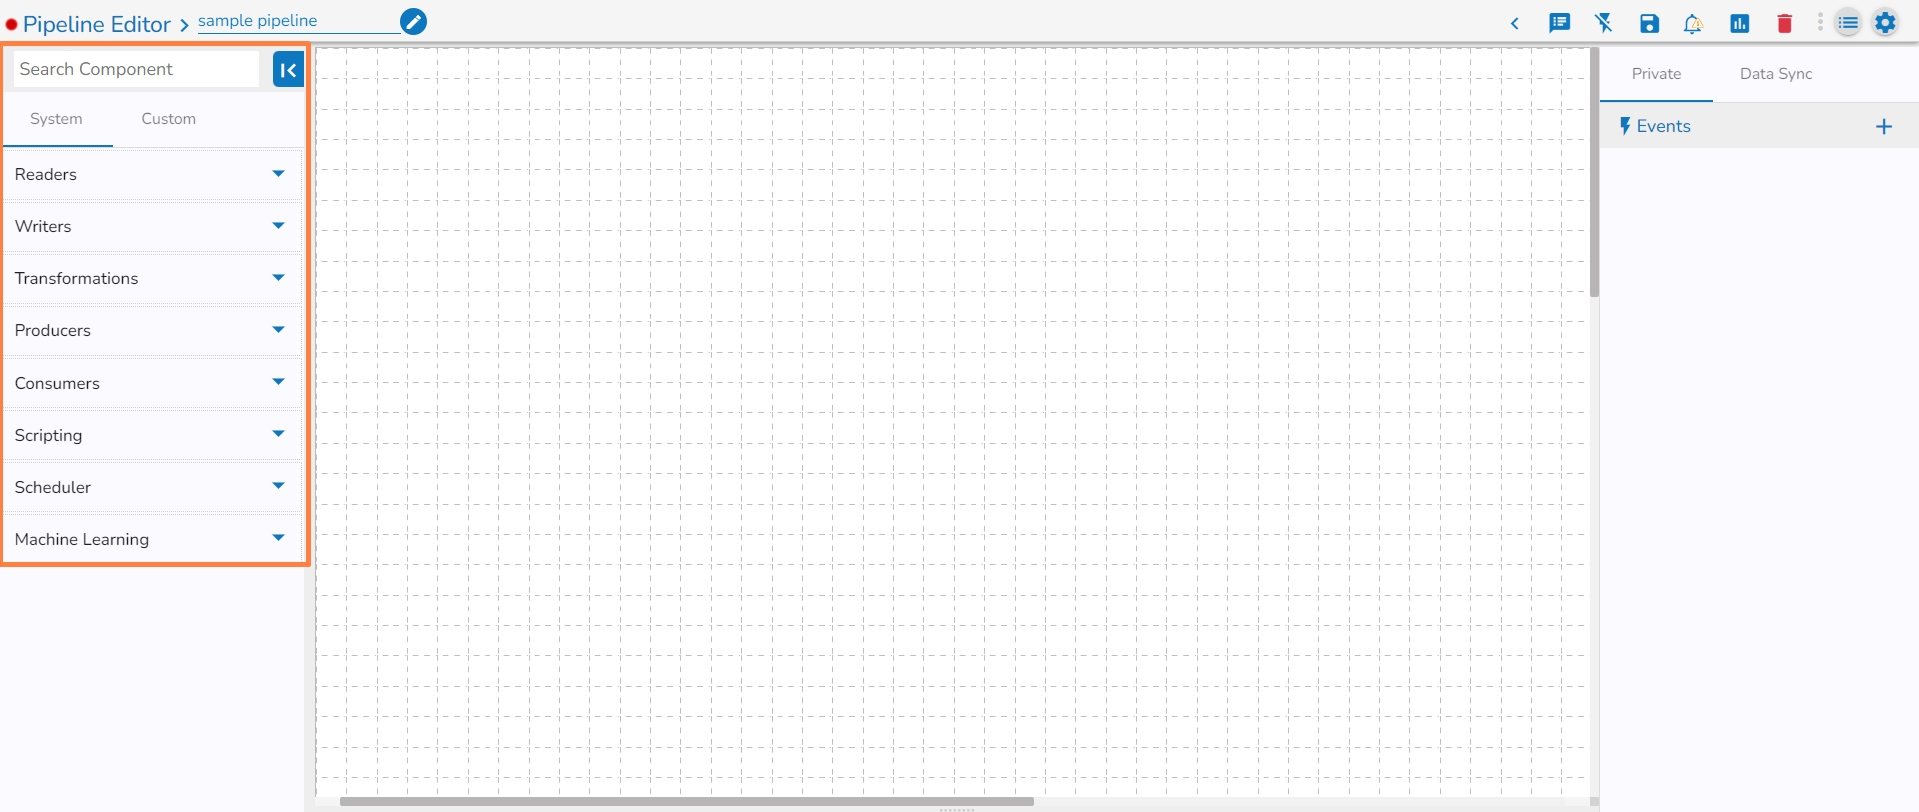
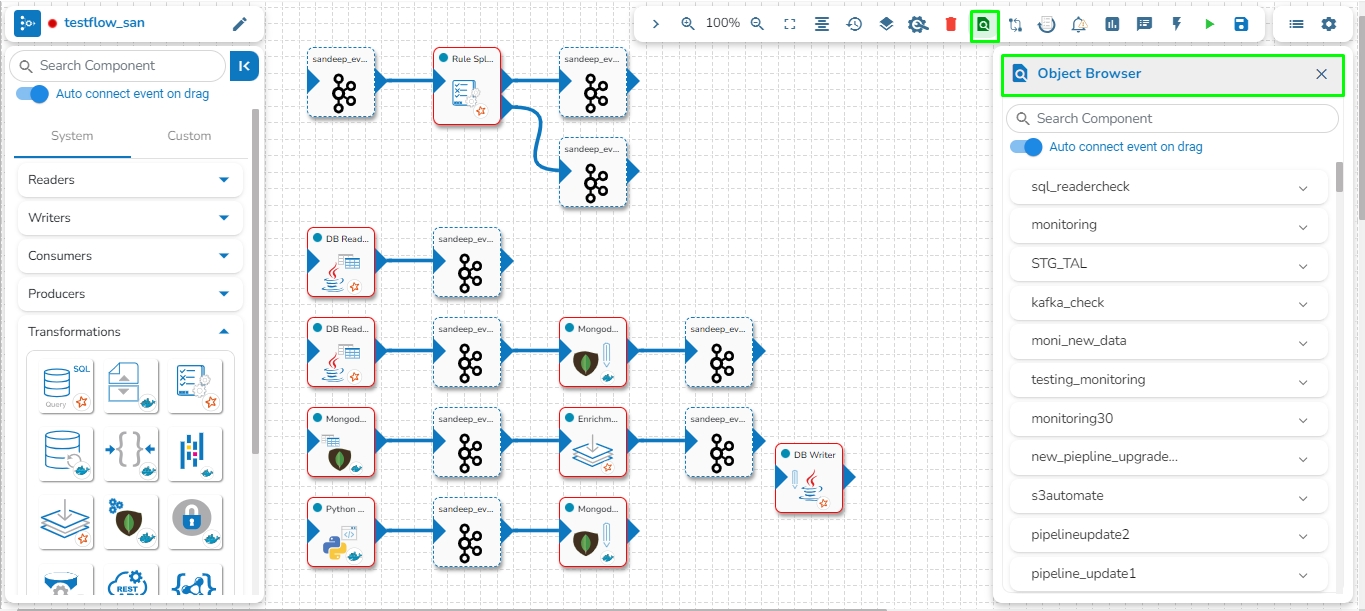
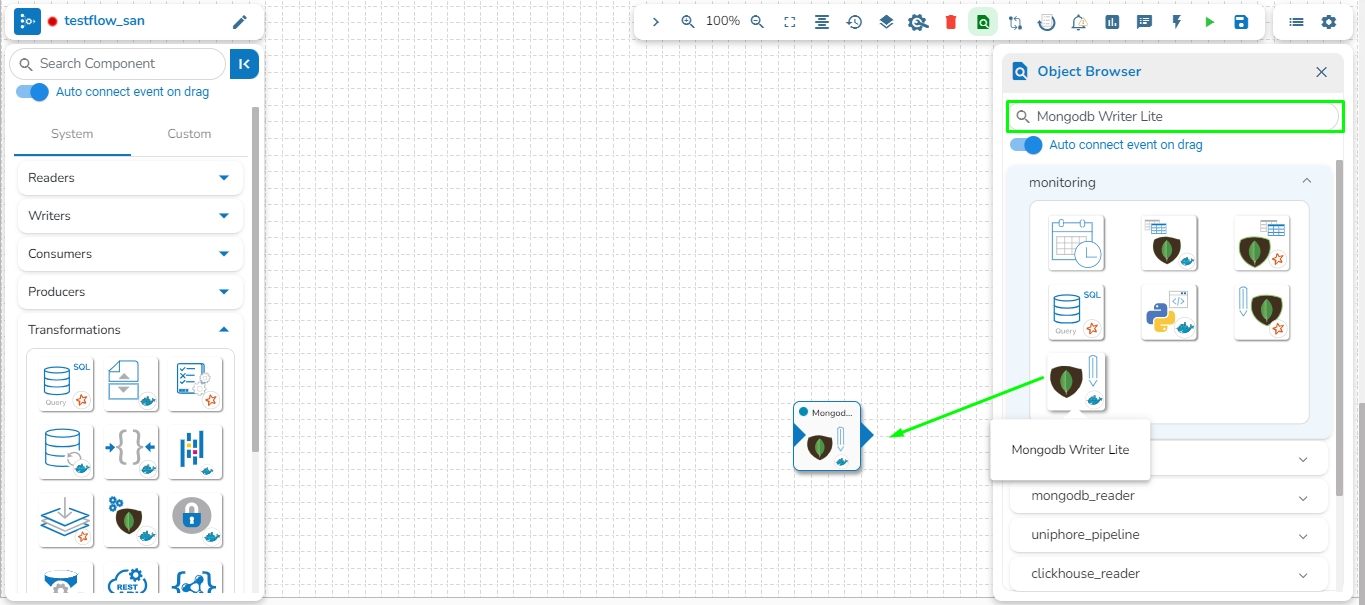
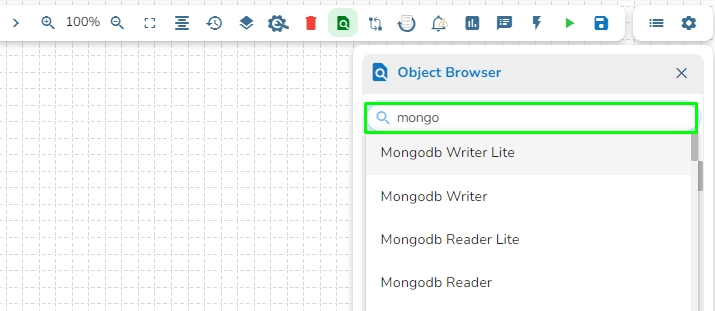
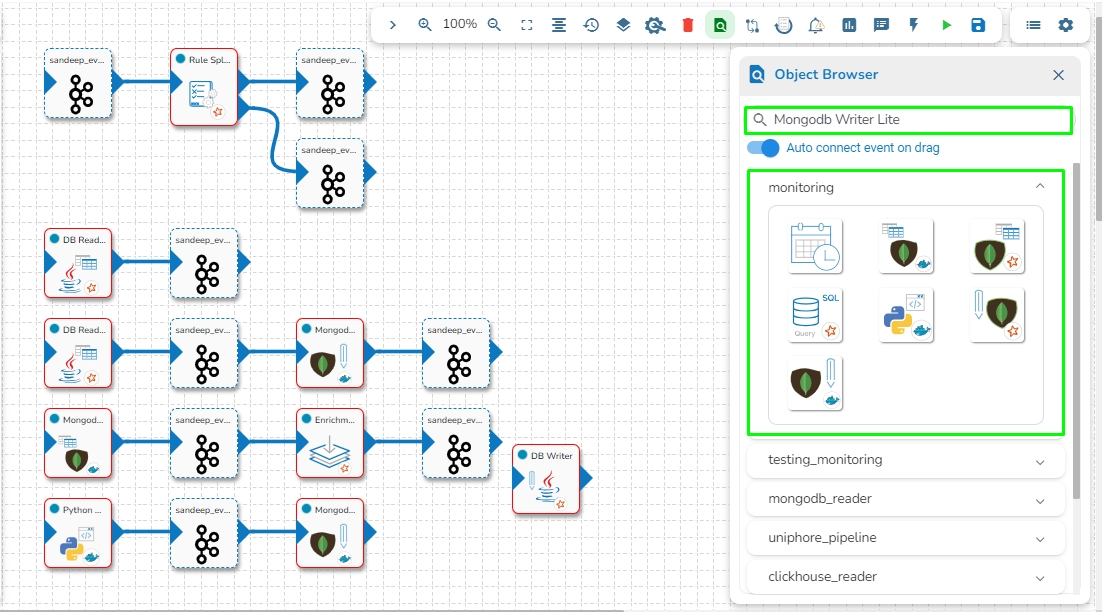
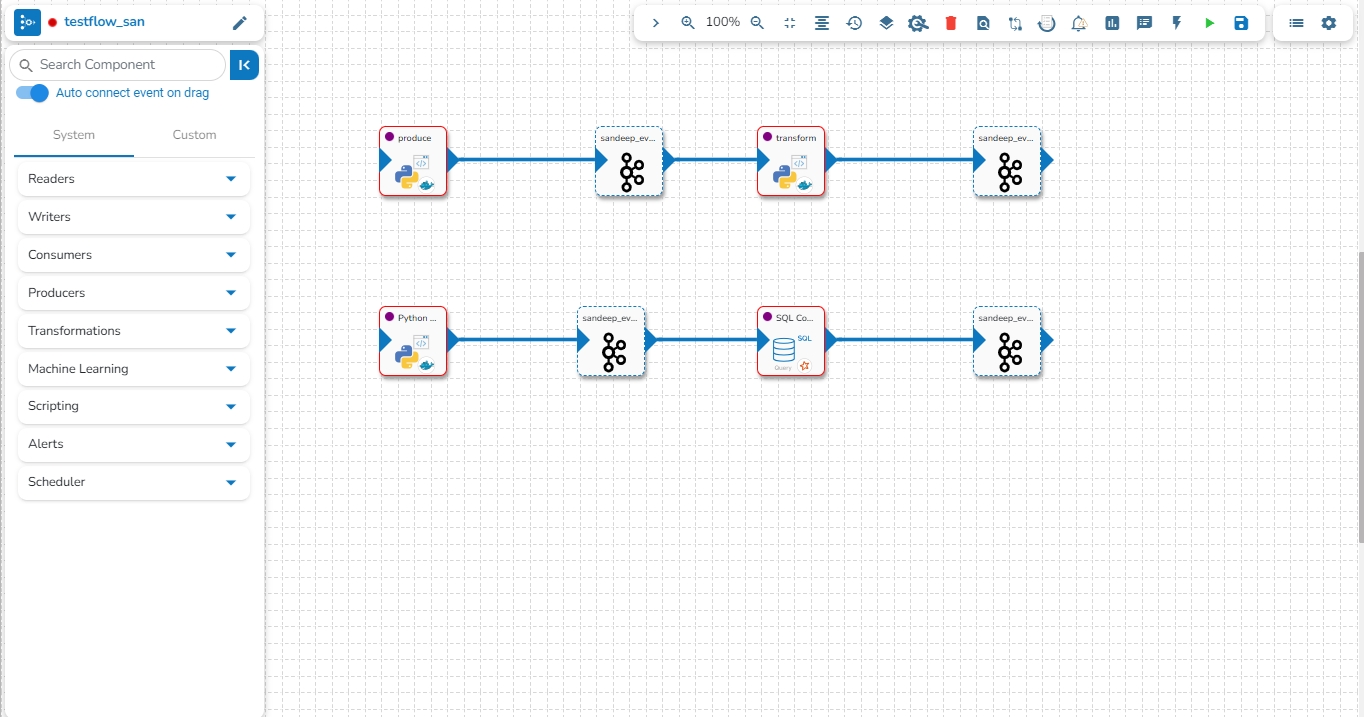
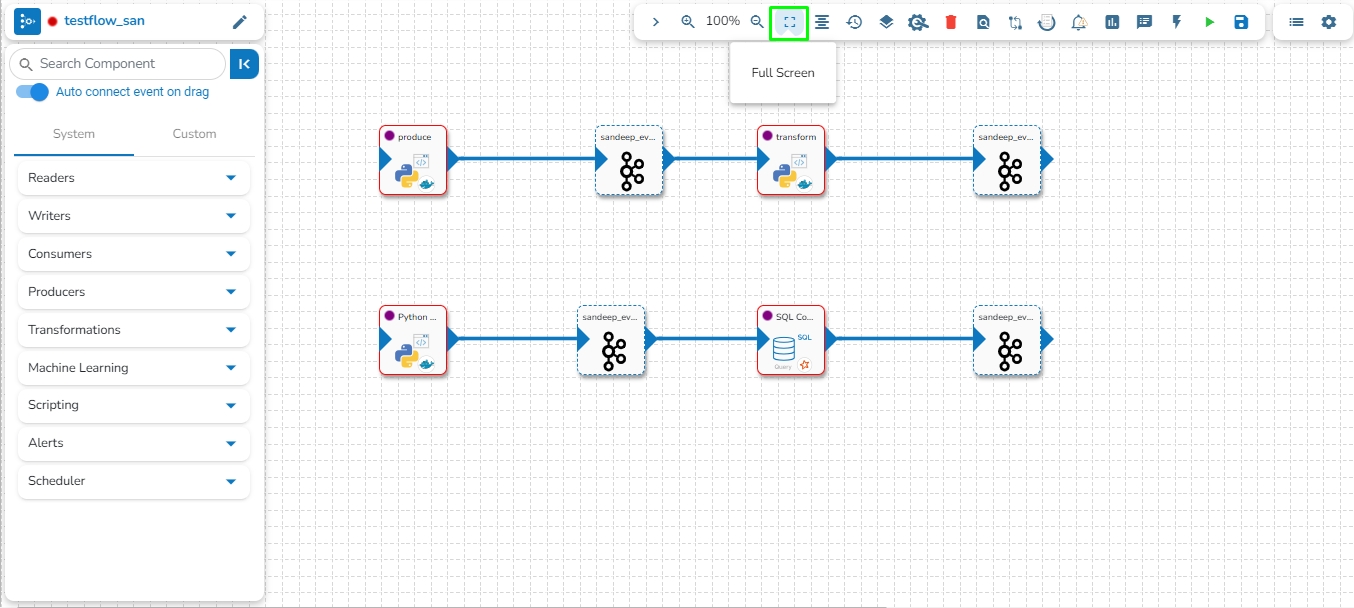

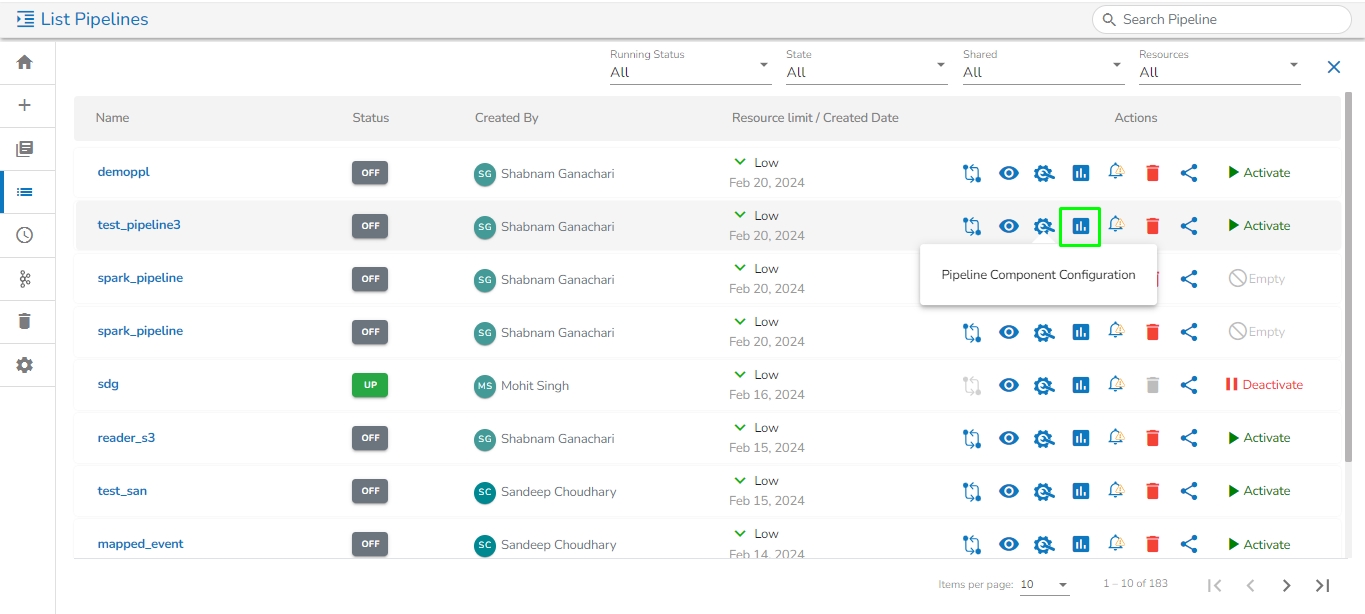
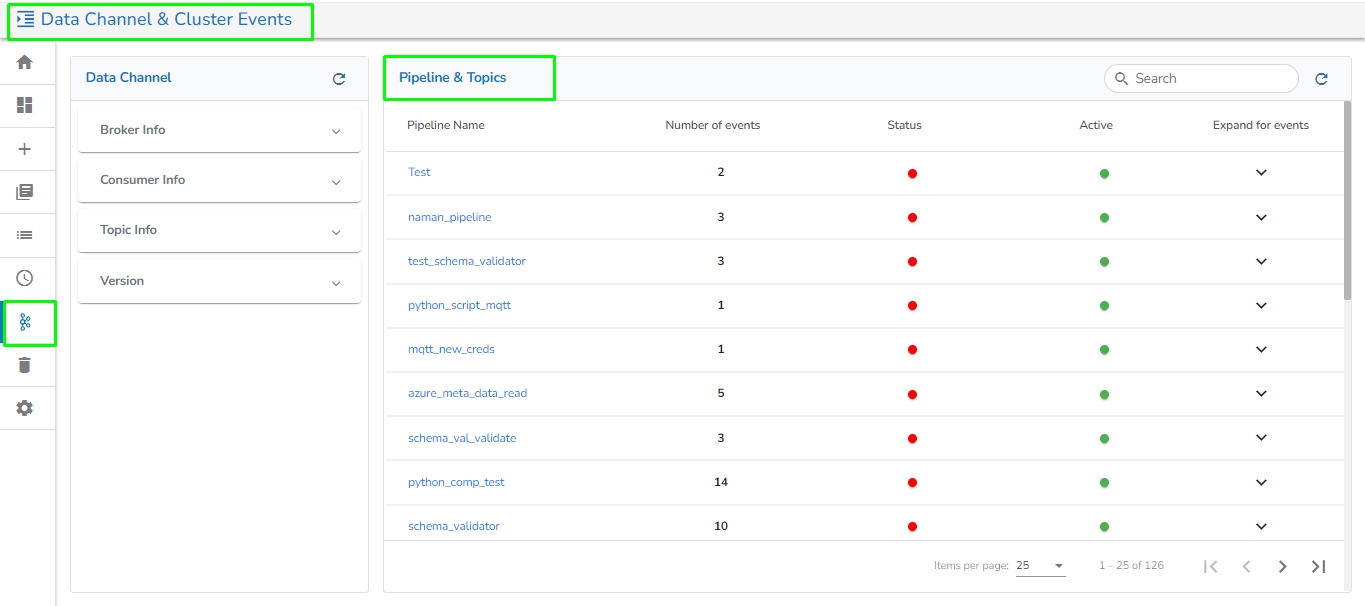
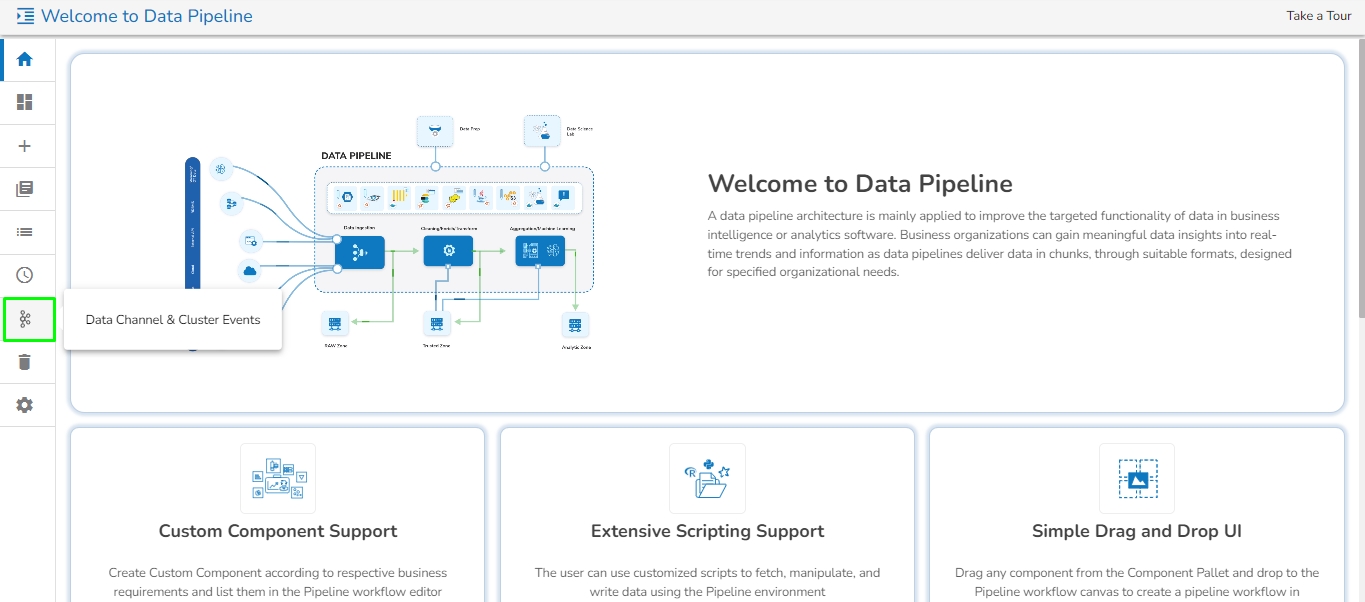
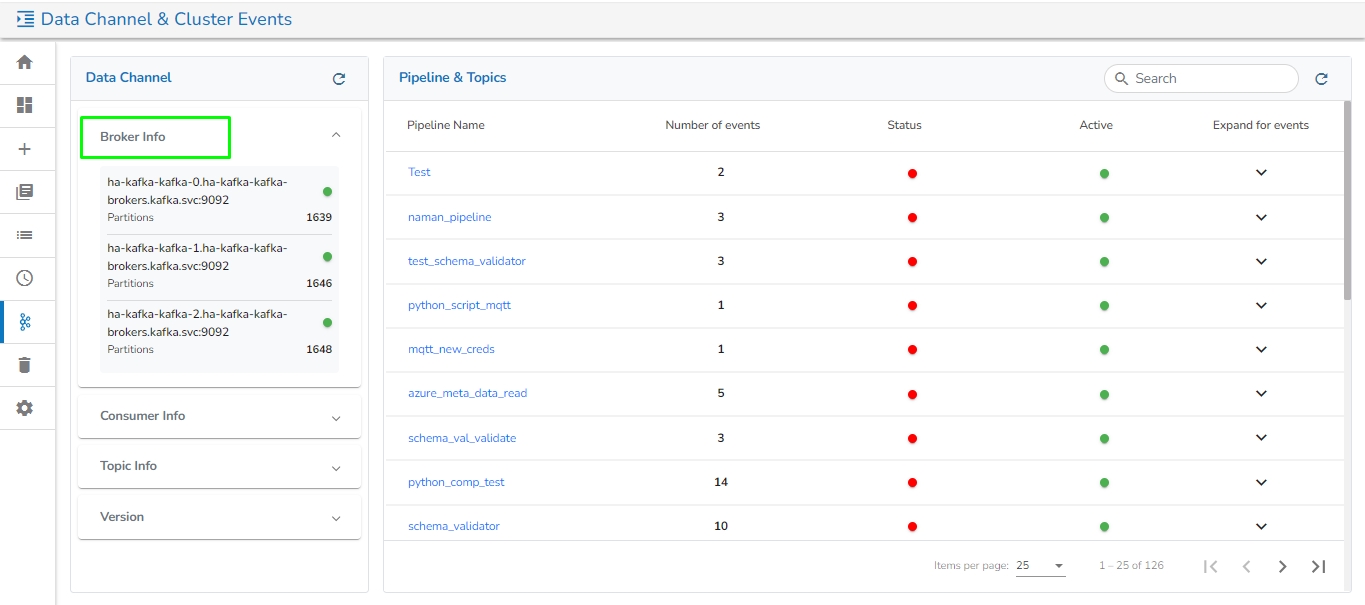
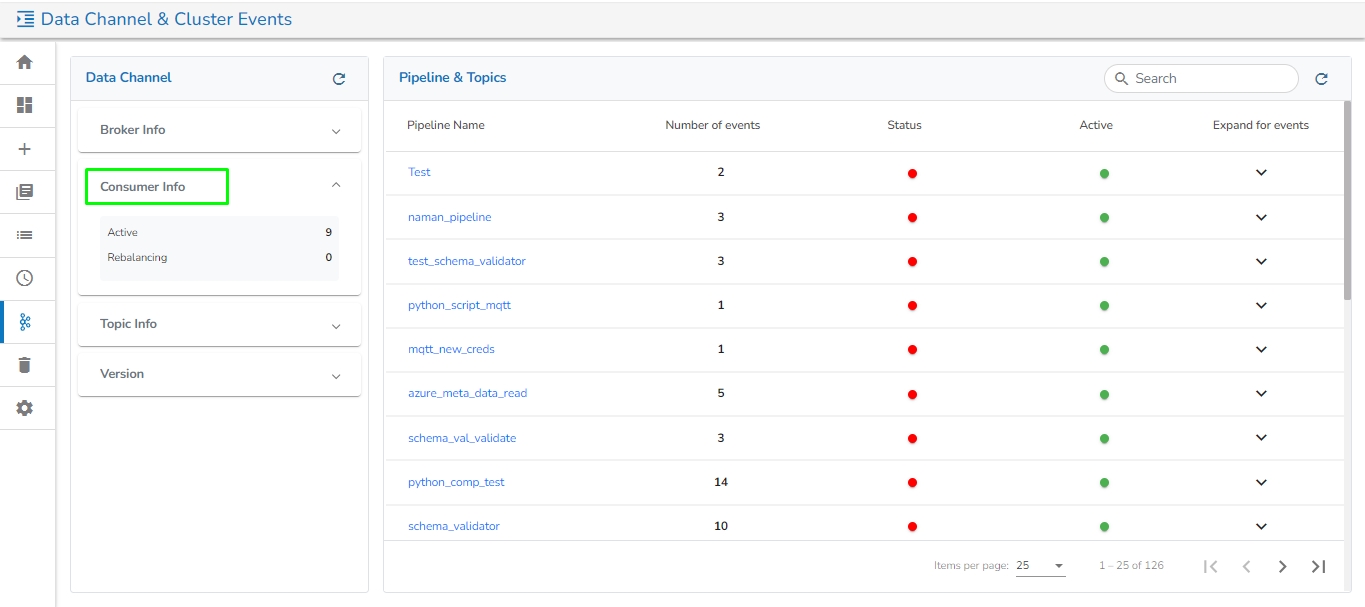
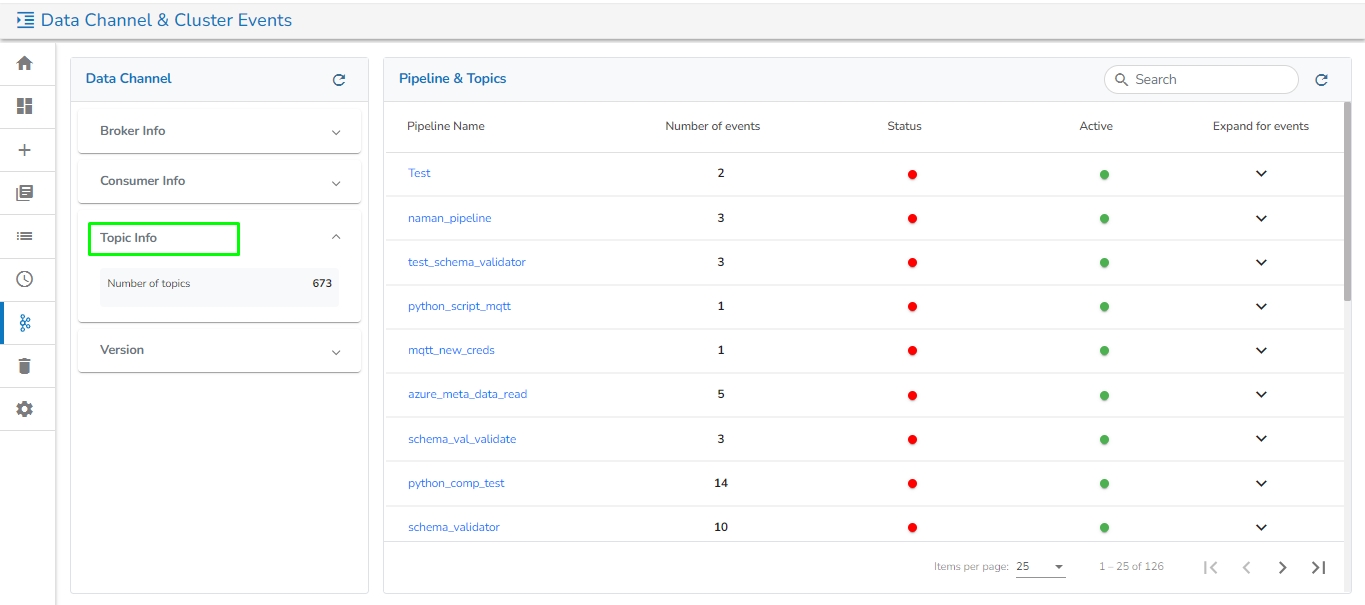
S3 Reader component typically authenticate with S3 using AWS credentials, such as an access key ID and secret access key, to gain access to the S3 bucket and its contents. S3 Reader is designed to read and access data stored in an S3 bucket in AWS.
All component configurations are classified broadly into the following sections:
Meta Information
Check out the below-given demonstration to configure the S3 component and use it in a pipeline workflow.
Navigate to the Data Pipeline Editor.
Expand the Reader section provided under the Component Pallet.
Drag and drop the S3 Reader component to the Workflow Editor.
Click on the dragged S3 Reader to get the component properties tabs.
It is the default tab to open for the component while configuring it.
Invocation Type: Select an invocation mode out of ‘Real-Time’ or ‘Batch’ using the drop-down menu.
Deployment Type: It displays the deployment type for the reader component. This field comes pre-selected.
Container Image Version: It displays the image version for the docker container. This field comes pre-selected.
Open the ‘Meta Information’ tab and fill in all the connection-specific details for the S3 Reader.·
Bucket Name (*): Enter AWS S3 Bucket Name.
Zone (*): Enter S3 Zone. (For eg: us-west-2)
Access Key (*): Provide Access Key ID shared by AWS.
Access Key (*): Provide Access Key ID shared by AWS.
Secret Key (*): Provide Secret Access Key shared by AWS.
Table (*): Mention the Table or file name from S3 location which is to be read.
Sample Spark SQL query for S3 Reader:
There is also a section for the selected columns in the Meta Information tab if the user can select some specific columns from the table to read data instead of selecting a complete table so this can be achieved by using the ‘Selected Columns’ section. Select the columns which you want to read and if you want to change the name of the column, then put that name in the alias name section otherwise keep the alias name the same as of column name and then select a Column Type from the drop-down menu.
or
Use ‘Download Data’ and ‘Upload File’ options to select the desired columns.
Provide a unique Key column name on which the partition has been done and has to be read.
Click the Save Component in Storage icon after doing all the configurations to save the reader component.
A notification message appears to inform about the component configuration success.
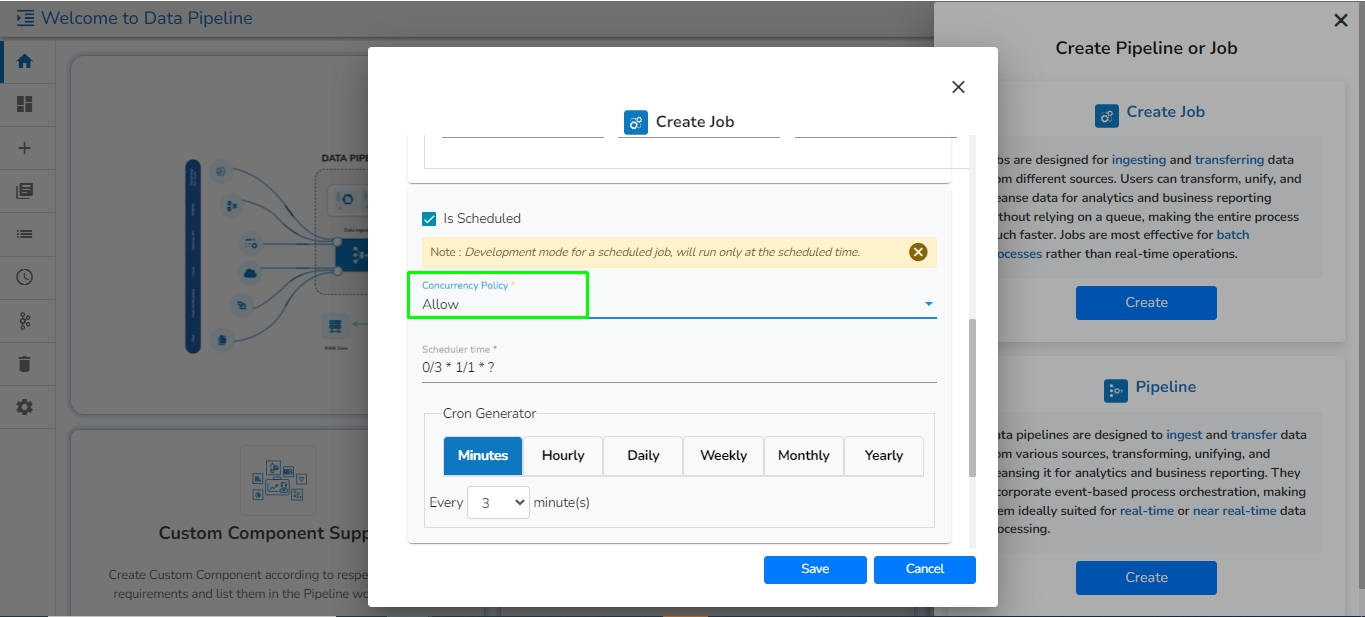


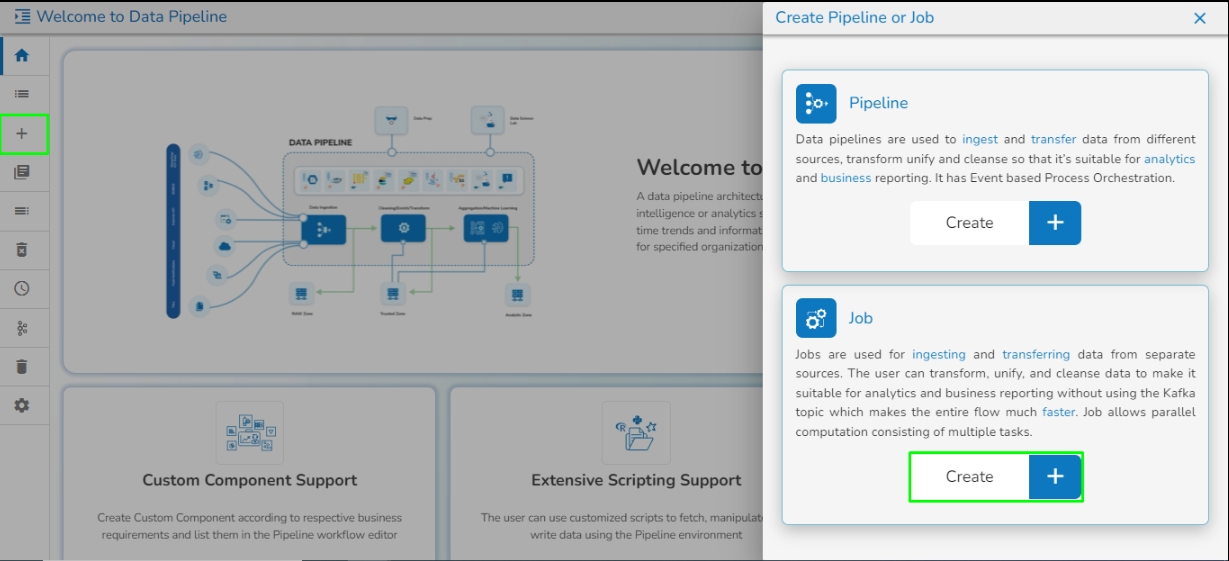
The on-demand python job functionality allows you to initiate a python job based on a payload using an API call at a desirable time.
Before creating the Python (On demand) Job, the user has to create a project in the Data Science Lab module under Python Environment. Please refer the below image for reference:
Please follow the below given steps to configure Python Job(On-demand):
Navigate to the Data Pipeline homepage.
The Pipeline Editor contains a Toolbar at the top right side of the page with various options to be applied to a Pipeline workflow.
The Toolbar can be expanded or some of the options can be hidden by using the Show Options or Hide Options icons.
Hide Options: By clicking this icon some of the Toolbar icons get hidden.
The Test suite module helps the developers to create a unit test for every component on the pipeline. We can upload input data and expected output data for every test case this will be then compared with the actual output generated by the component.
Check out the below-given walk through to understand the Pipeline Testing functionality.
The Test suite provides the following comparisons:
Azure Blob Reader is designed to read and access data stored in Azure Blob Storage. Azure Blob Readers typically authenticate with Azure Blob Storage using Azure Active Directory credentials or other authentication mechanisms supported by Azure. This is a spark based component.
All component configurations are classified broadly into the following sections:
Meta Information
SELECT department, AVG(salary) AS average_salary FROM employee_table
GROUP BY department;
// In the above Spark SQL query, employee_table is the name of collection which is filled in the Collection Name field of Meta Information tab. 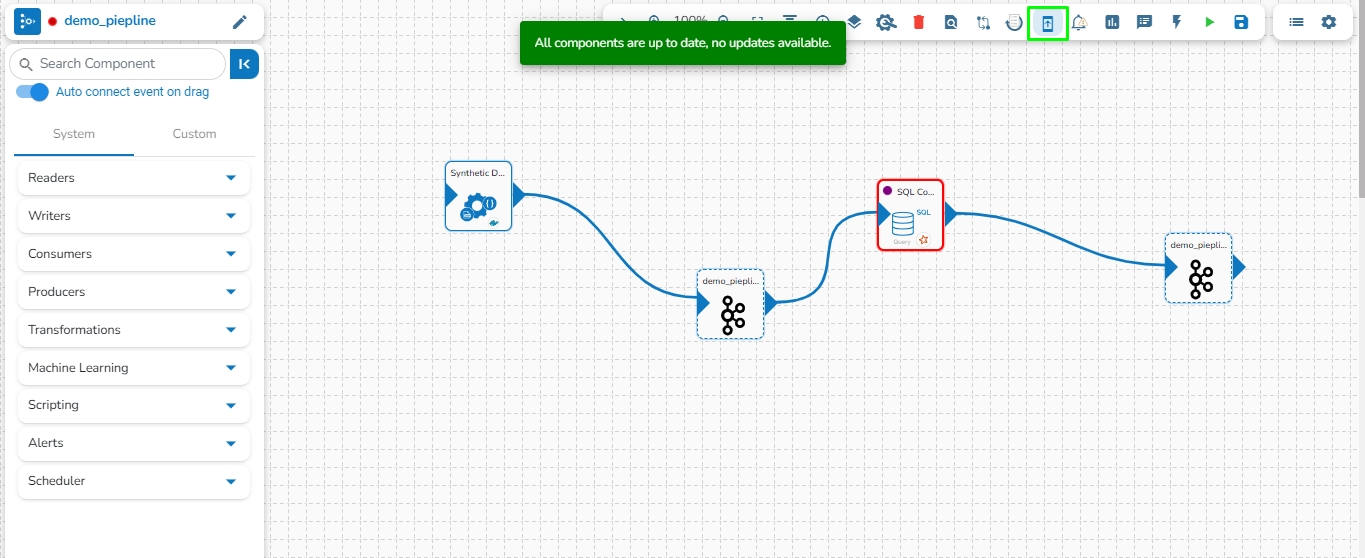
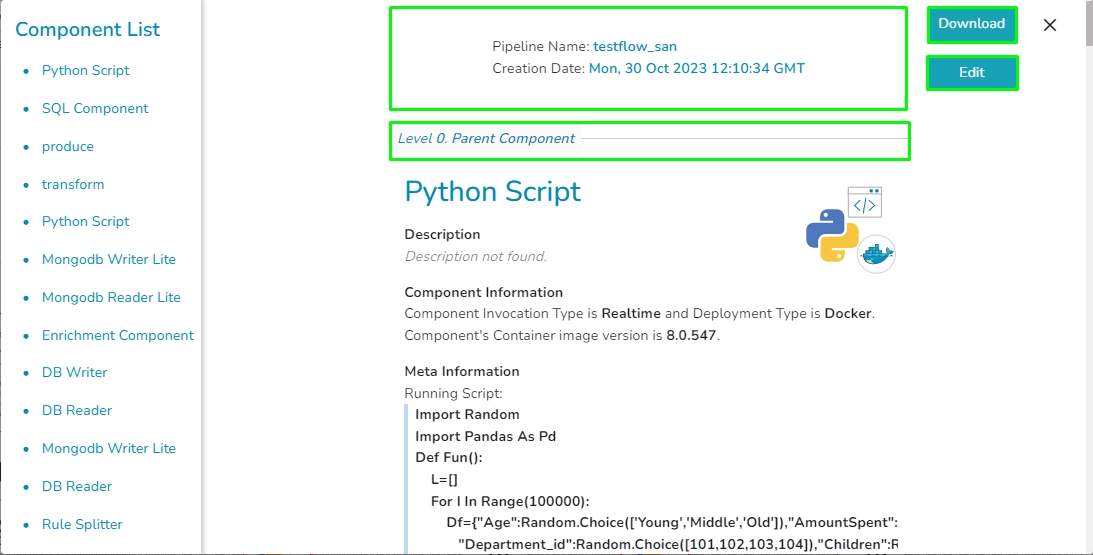

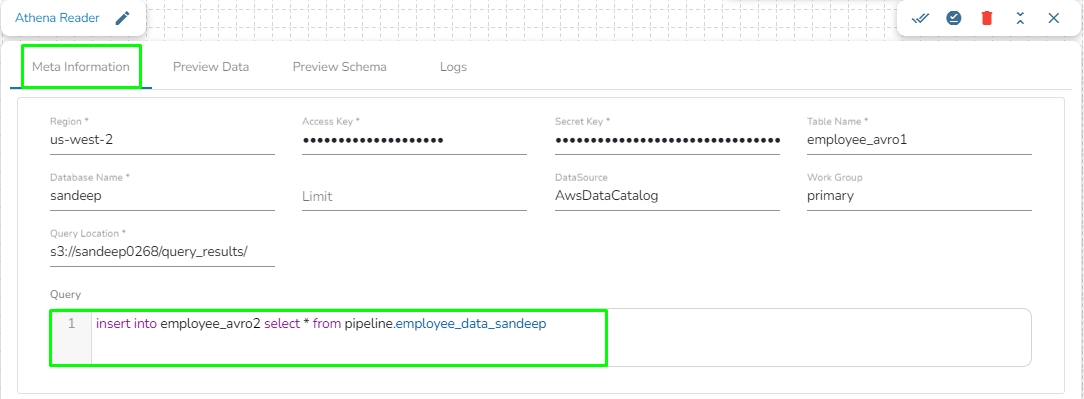

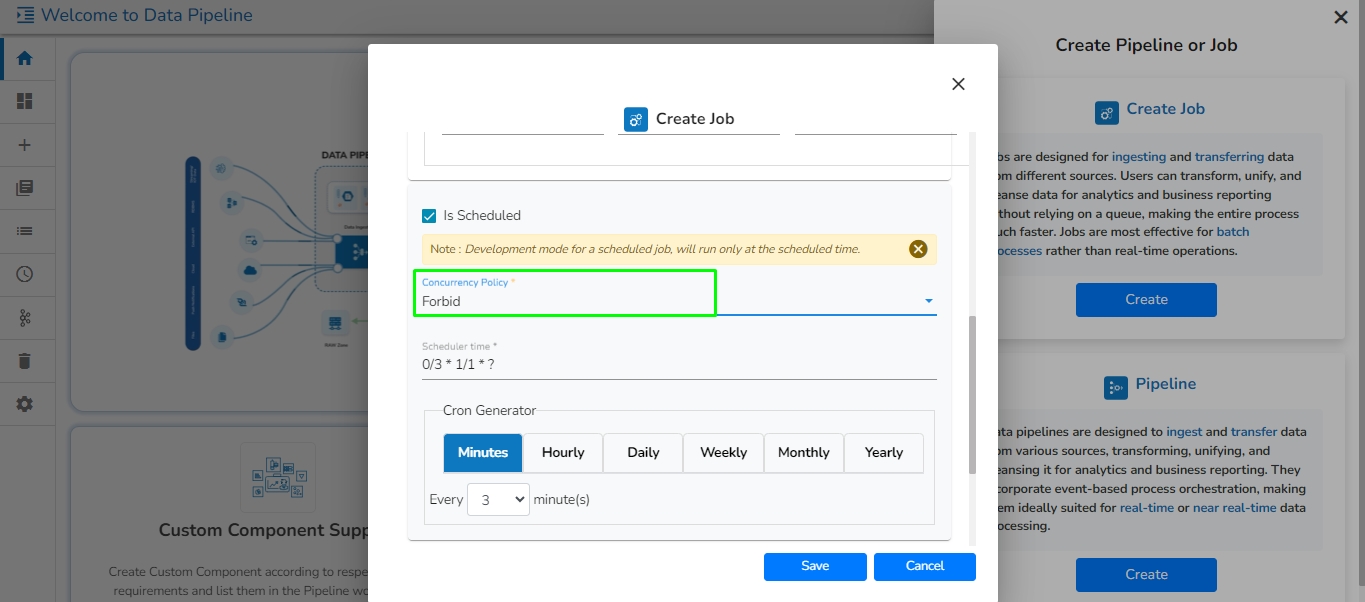
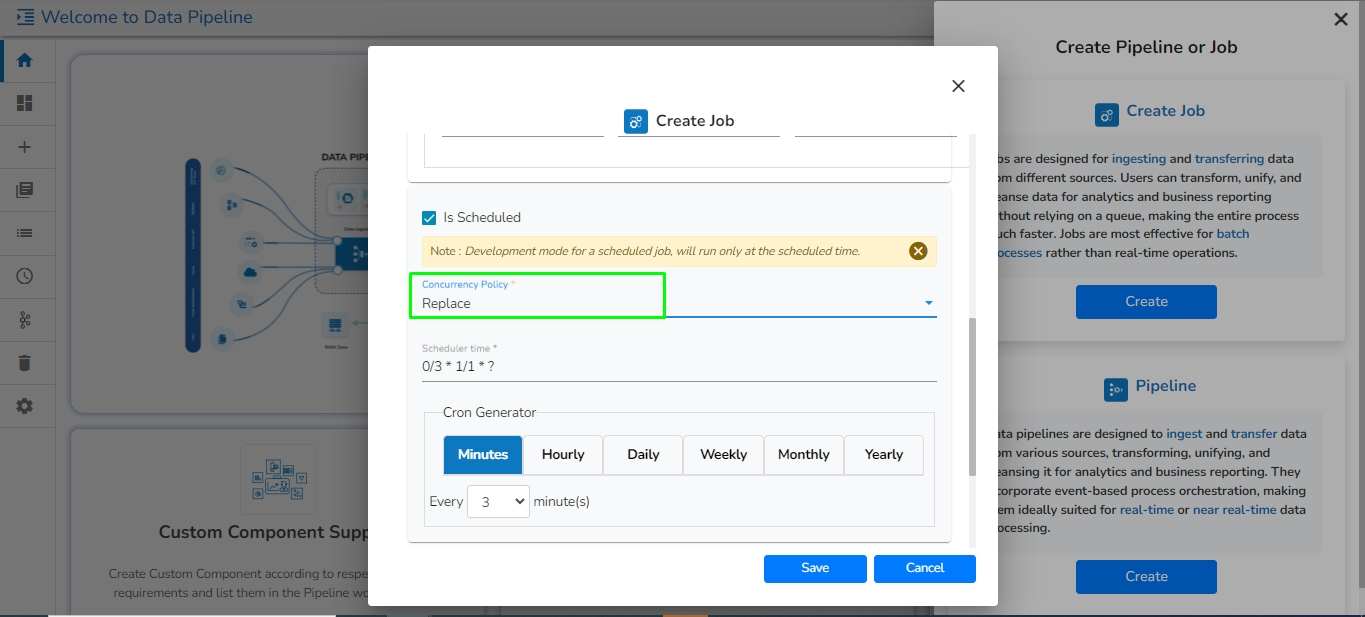
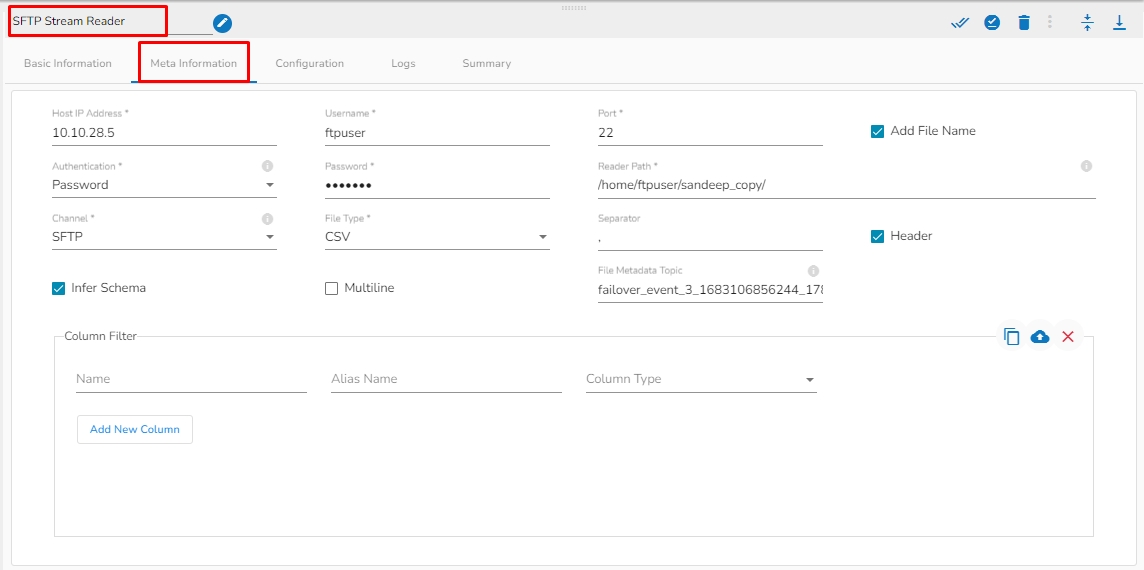

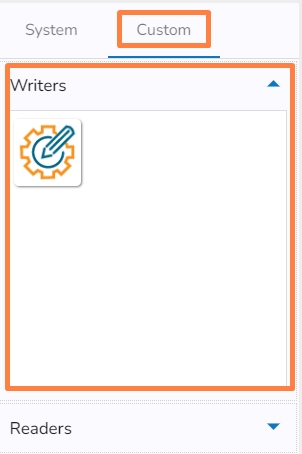
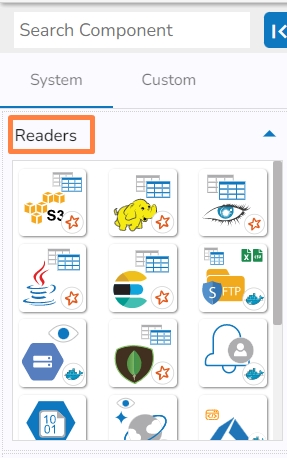

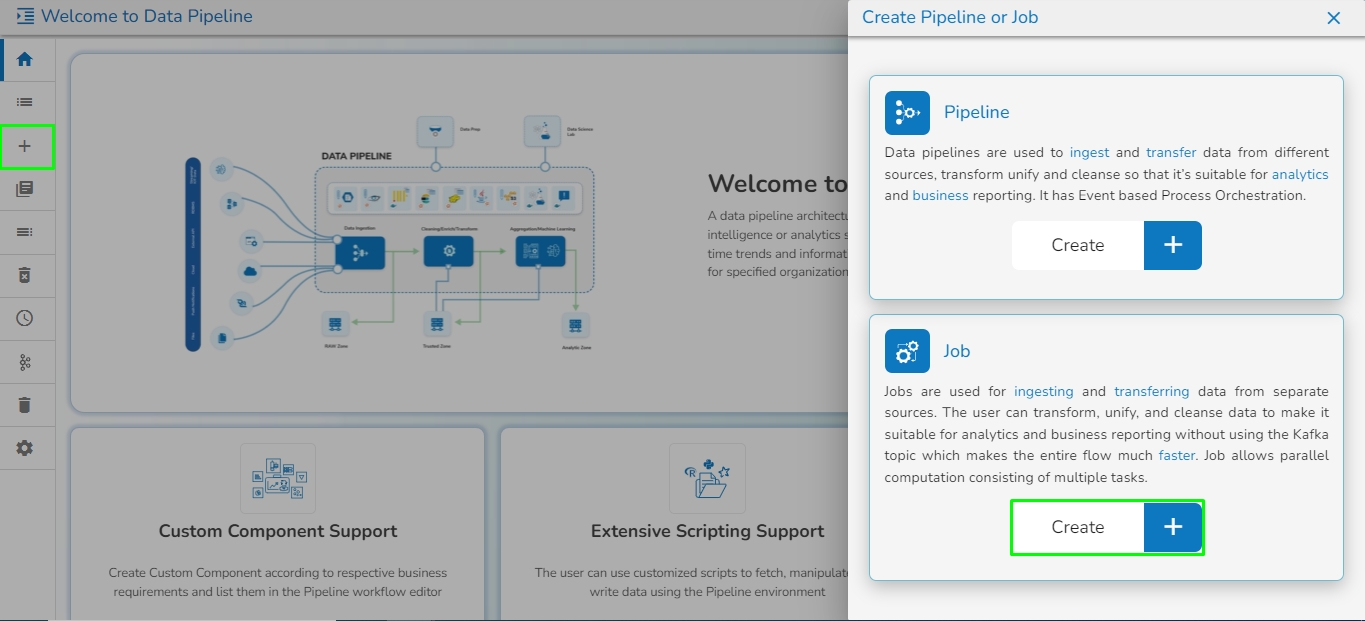
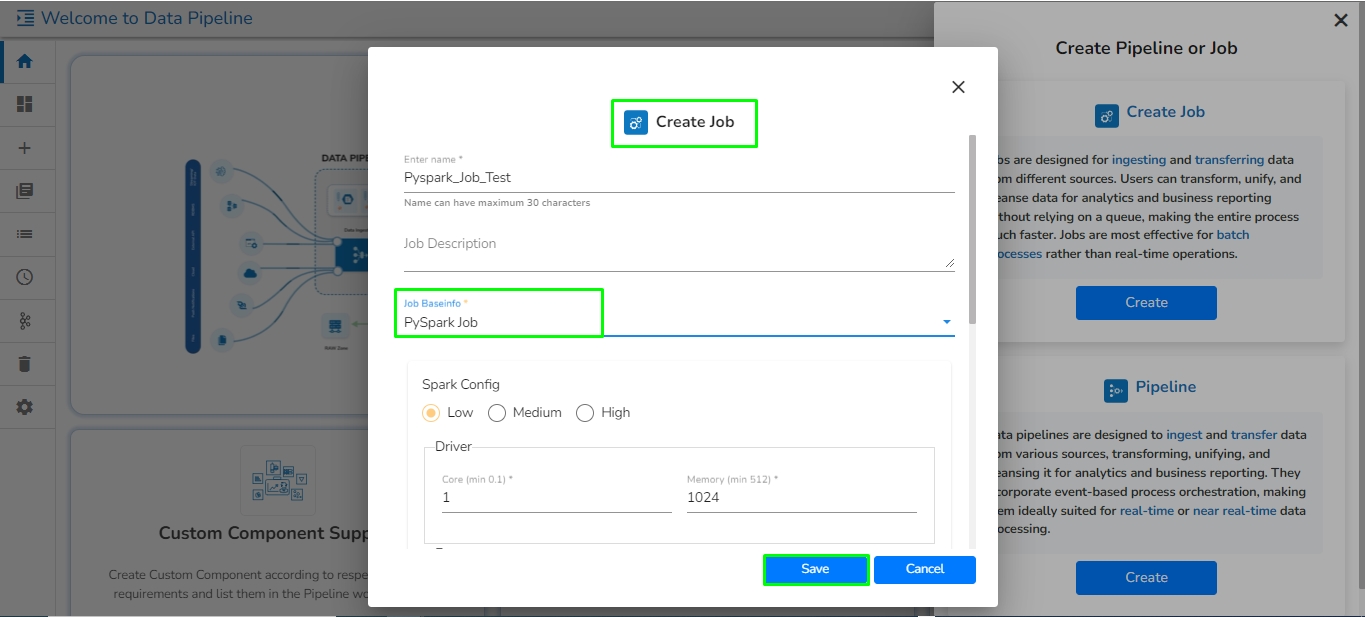
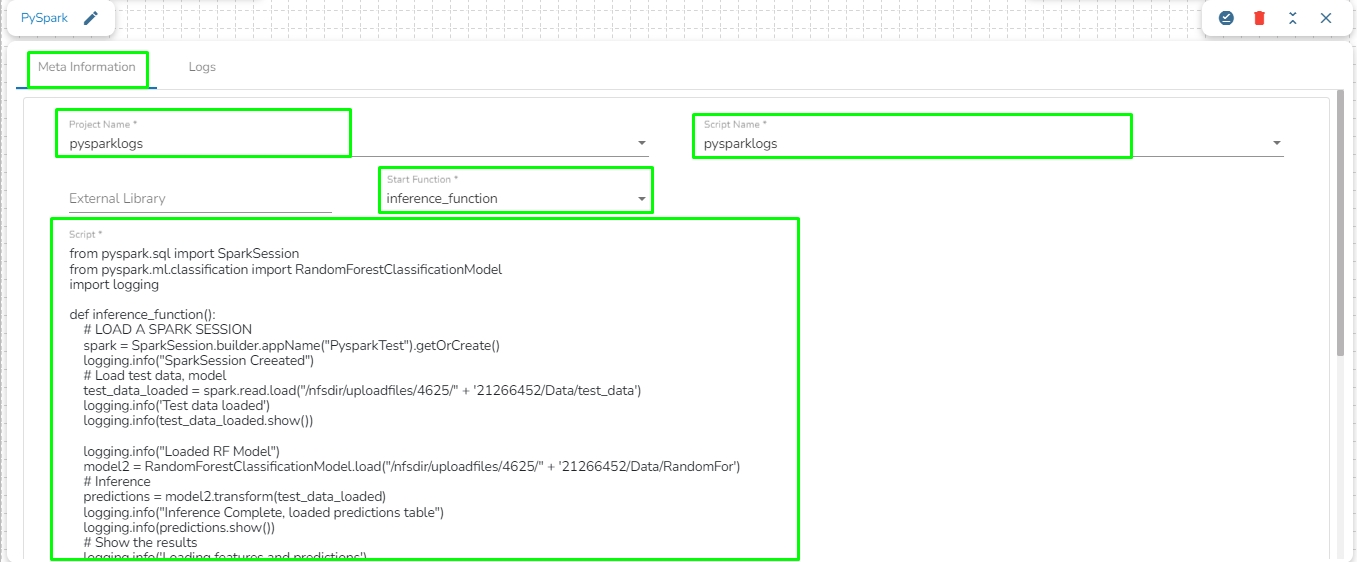
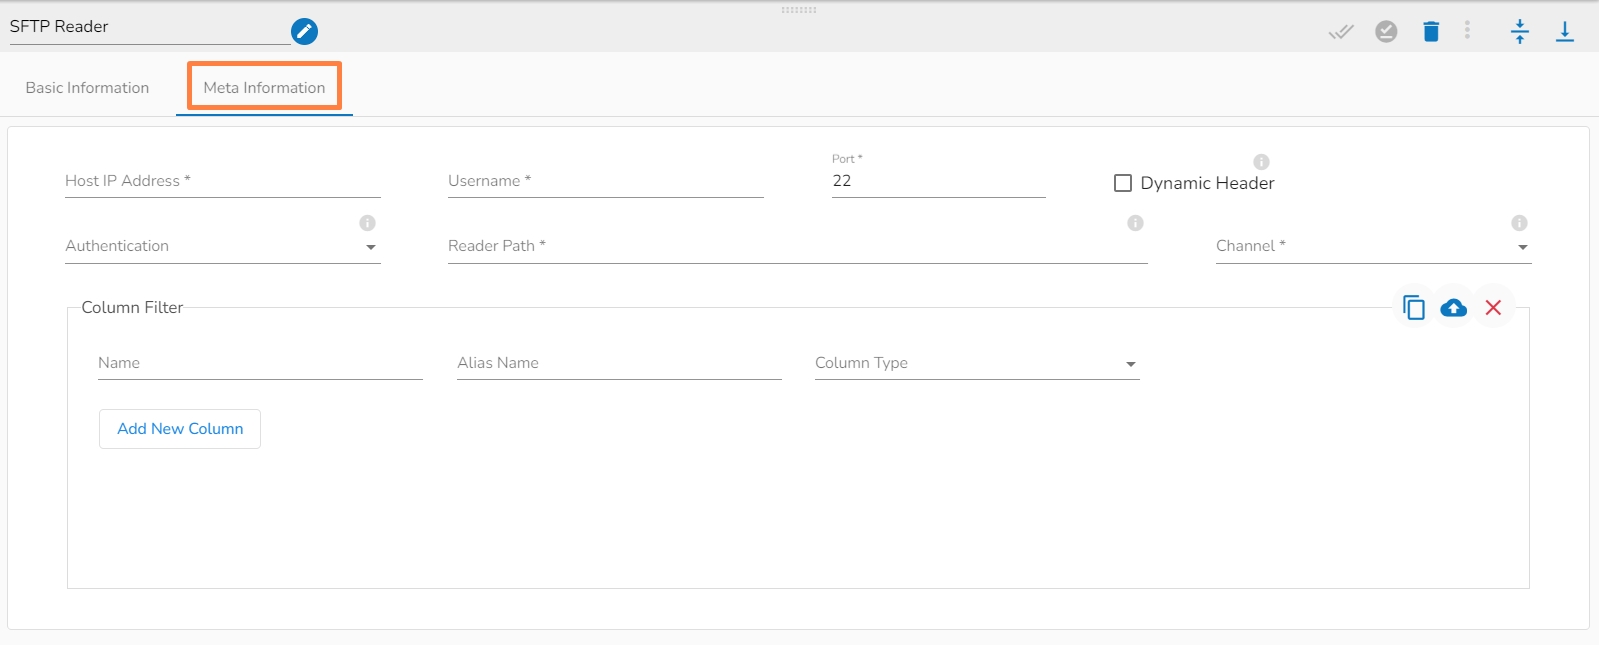
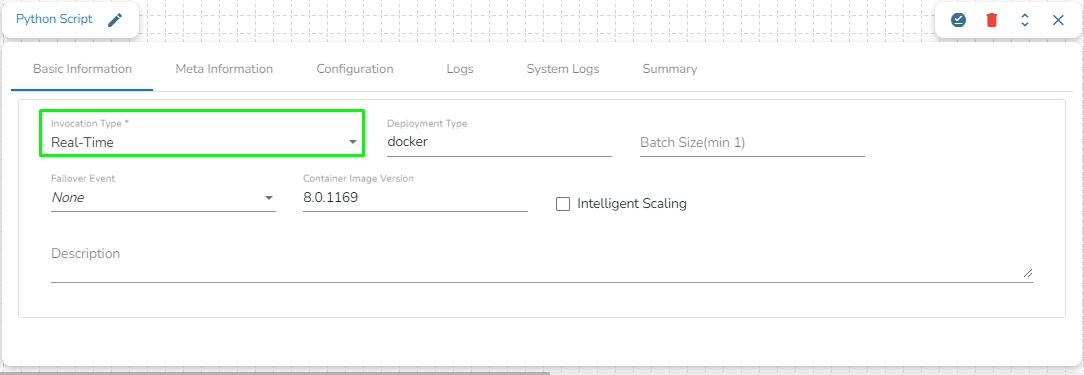
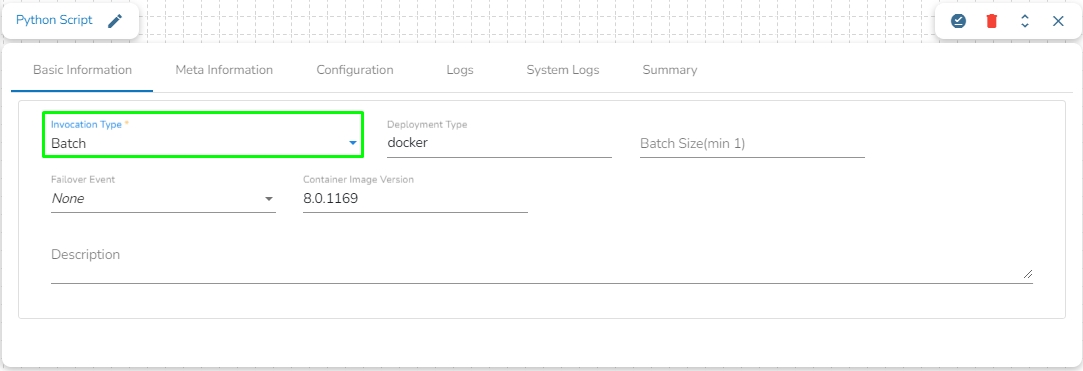
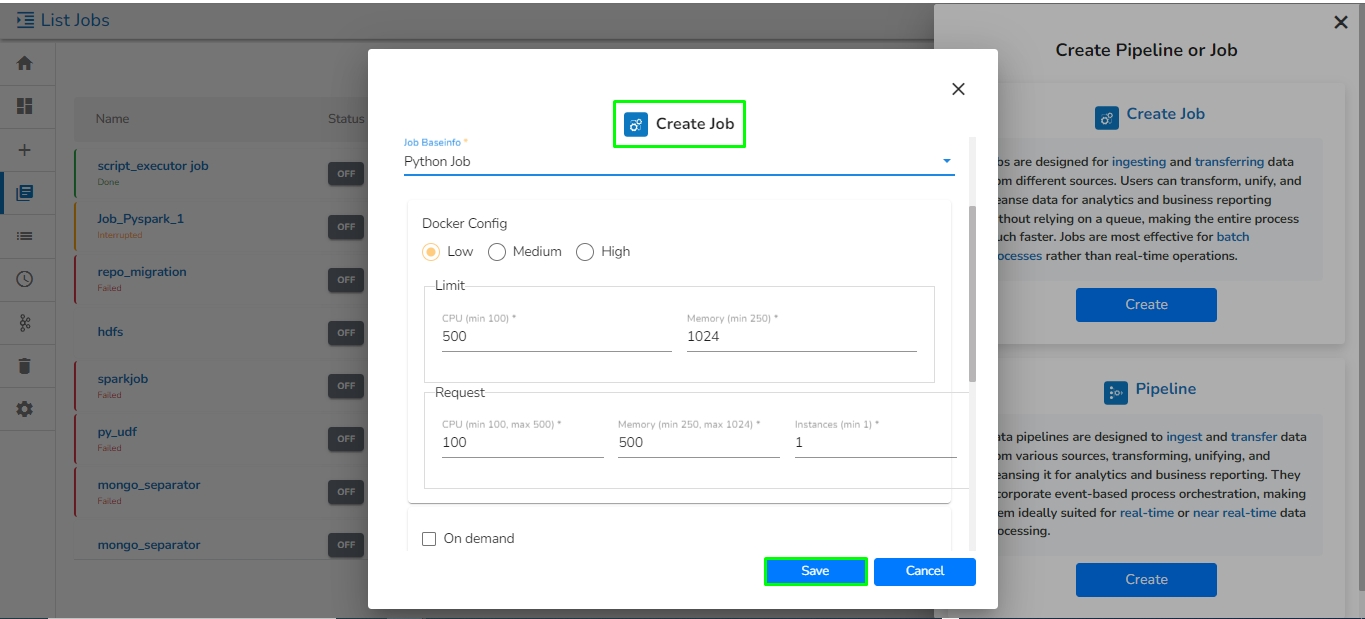
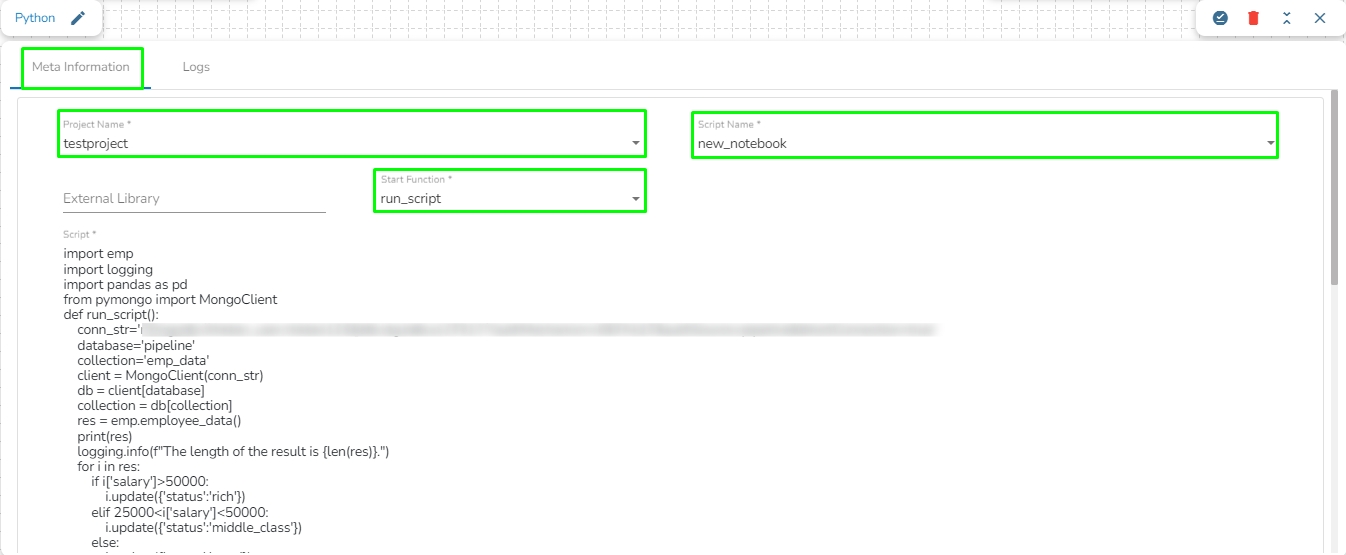
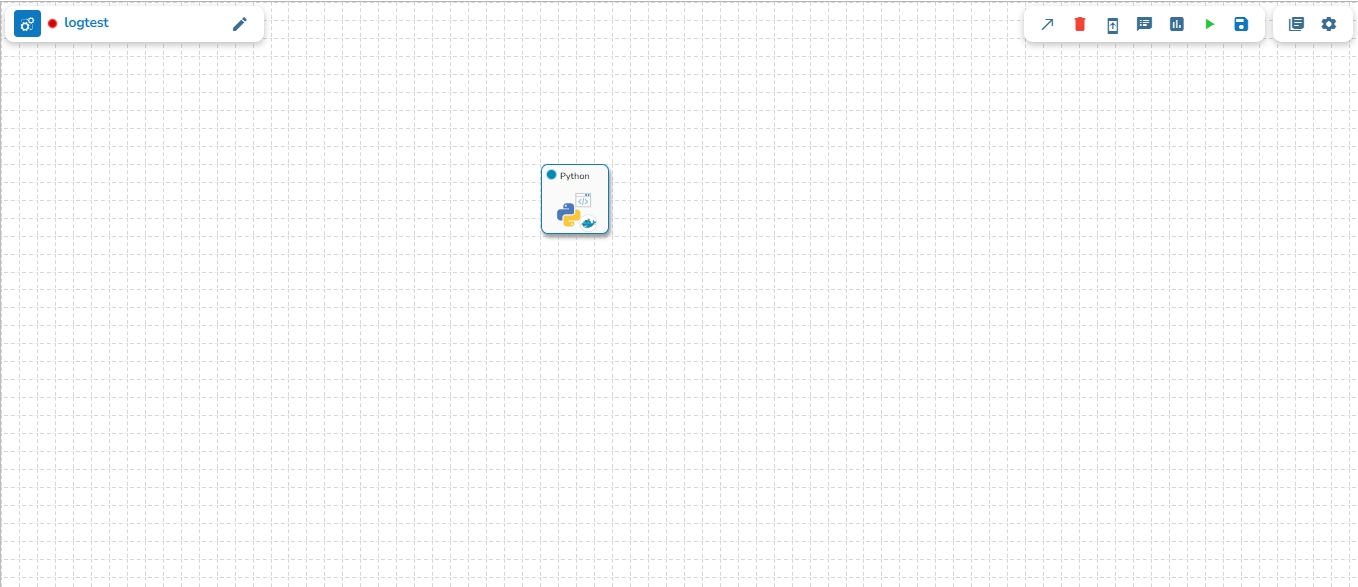
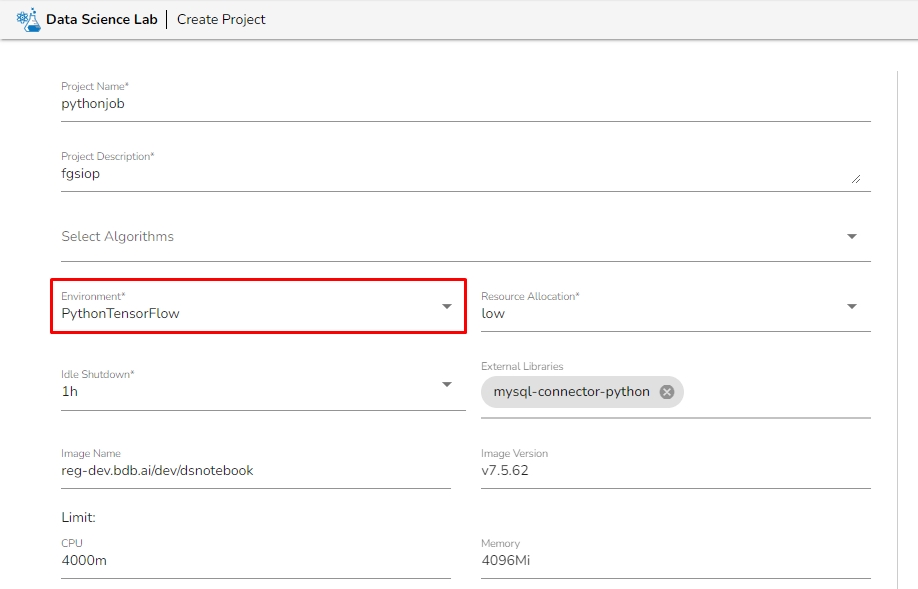
Row Tags: Provide the row tags from the XML files.
Join Row Tags: Enable this option to join multiple row tags.


Batch Size (min 10): Provide the maximum number of records to be processed in one execution cycle (Min limit for this field is 10).
Table (*): Mention the Table or file name from S3 location which is to be read.
File Type (*): Select a file type from the drop-down menu (CSV, JSON, PARQUET, AVRO, XML and ORC are the supported file types)
Limit: Set a limit for the number of records to be read.
Query: Enter a Spark SQL query. Take inputDf as table name.
Limit: Set a limit for the number of records to be read.
Query: Enter a Spark SQL query. Take inputDf as table name.
Selected Columns- There should not be a data type mismatch in the Column Type for all the Reader components.
The Meta Information fields may vary based on the selected File Type.
All the possibilities are mentioned below:
CSV: ‘Header’ and ‘Infer Schema’ fields get displayed with CSV as the selected File Type. Enable Header option to get the Header of the reading file and enable Infer Schema option to get true schema of the column in the CSV file.
JSON: ‘Multiline’ and ‘Charset’ fields get displayed with JSON as the selected File Type. Check-in the Multiline option if there is any multiline string in the file.
PARQUET: No extra field gets displayed with PARQUET as the selected File Type.
AVRO: This File Type provides two drop-down menus.
Compression: Select an option out of the ‘Deflate’ and ‘Snappy’ options.
Compression Level: This field appears for the Deflate compression option. It provides 0 to 9 levels via a drop-down menu.
XML: Select this option to read XML file. If this option is selected, the following fields will get displayed:
Infer schema: Enable this option to get true schema of the column.
Path: Provide the path of the file.
ORC: Select this option to read ORC file. If this option is selected, the following fields will get displayed:
Push Down: In ORC (Optimized Row Columnar) file format, "push down" typically refers to the ability to push down predicate filters to the storage layer for processing. There will be two options in it:
True: When push down is set to True, it indicates that predicate filters can be pushed down to the ORC storage layer for filtering rows at the storage level. This can improve query performance by reducing the amount of data that needs to be read into memory for processing.
Click on the Create Job icon.
The New Job dialog box appears redirecting the user to create a new Job.
Enter a name for the new Job.
Describe the Job(Optional).
Job Baseinfo: In this field, there are three options:
Spark Job
PySpark Job
Python Job
Select the Python Job option from Job Baseinfo.
Check-in On demand option as shown in the below image.
Docker Configuration: Select a resource allocation option using the radio button. The given choices are:
Low
Medium
High
Provide the resources required to run the python Job in the limit and Request section.
Limit: Enter max CPU and Memory required for the Python Job.
Request: Enter the CPU and Memory required for the job at the start.
The payload field will appear once the "On Demand" option is checked. Enter the payload in the form of a JSON array containing JSON objects.
Trigger By: There are 2 options for triggering a job on success or failure of a job:
Success Job: On successful execution of the selected job the current job will be triggered.
Failure Job: On failure of the selected job the current job will be triggered.
Click the Save option to create the job.
A success message appears to confirm the creation of a new job.
The Job Editor page opens for the newly created job.
Based on the given number of instances, topics will be created, and the payload will be distributed across these topics. The logic for distributing the payload among the topics is as follows:
The number of data on each topic can be calculated as the ceiling value of the ratio between the payload size and the number of instances.
For example:
Payload Size: 10
Number of Topics=Number of Instances: 3
The number of data on each topic is calculated as Payload Size divided by Number of Topics:
In this case, each topic will hold the following number of data:
Topic 1: 4
Topic 2: 4
Topic 3: 2 (As there are only 2 records left)
In the On-Demand Job system, the naming convention for topics is based on the Job_Id, followed by an underscore (_) symbol, and successive numbers starting from 0. The numbers in the topic names will start from 0 and go up to n-1, where n is the number of instances. For clarity, consider the following example:
Job_ID: job_13464363406493
Number of instances: 3
In this scenario, three topics will be created, and their names will follow the pattern:
Please Note:
When writing a script in DsLab Notebook for an On-Demand Job, the first argument of the function in the script is expected to represent the payload when running the Python On-Demand Job. Please refer to the provided sample code.
job_payload is the payload provided when creating the job or sent from an API call or ingested from the Job trigger component from the pipeline.
Once the Python (On demand) Job is created, follow the below given steps to configure the Meta Information tab of the Python Job:
Project Name: Select the same Project using the drop-down menu where the Notebook has been created.
Script Name: This field will list the exported Notebook names which are exported from the Data Science Lab module to Data Pipeline.
External Library: If any external libraries are used in the script the user can mention it here. The user can mention multiple libraries by giving comma (,) in between the names.
Start Function: Here, all the function names used in the script will be listed. Select the start function name to execute the python script.
Script: The Exported script appears under this space.
Input Data: If any parameter has been given in the function, then the name of the parameter is provided as Key, and value of the parameters has to be provided as value in this field.
Python (On demand) Job can be activated in the following ways:
Activating from UI
Activating from Job trigger component
For activating Python (On demand) job from UI, it is mandatory for the user to enter the payload in the Payload section. Payload has to be given in the form of a JSON Array containing JSON objects as shown in the below given image.
Once the user configure the Python (On demand) job, the job can be activated using the activate icon on the job editor page.
Please go through the below given walk-through which will provide a step-by-step guide to facilitate the activation of the Python (On demand) Job as per user preferences.
Sample payload for Python Job (On demand):
The Python (On demand) job can be activated using the Job Trigger component in the pipeline. To configure this, the user has to set up their Python (On demand) job in the meta-information component within the pipeline. The in-event data of the Job Trigger component will then be utilized as a payload in the Python (On demand) Job.
Please go through the below given walk-through which will provide a step-by-step guide to facilitate the activation of the Python (On demand) Job through Job trigger component.
Please follow the below given steps to configure Job trigger component to activate the Python (On demand) job:
Create a pipeline that generates meaningful data to be sent to the out event, which will serve as the payload for the Python (On demand) job.
Connect the Job Trigger component to the event that holds the data to be used as payload in the Python (On demand) job.
Open the meta-information of the Job Trigger component and select the job from the drop-down menu that needs to be activated by the Job Trigger component.
The data from the previously connected event will be passed as JSON objects within a JSON Array and used as the payload for the Python (On demand) job. Please refer to the image below for reference:
In the provided image, the event contains a column named "output" with four different values: "jobs/ApportionedIdentifiers.csv", "jobs/accounnts.csv", "jobs/gluue.csv", and "jobs/census_2011.csv". The payload will be passed to the Python (On demand) job in the JSON format given below.
Opens Pipeline Overview page.
Redirects to the Pipeline testing page
Update the version of the components.
/


Compare no. of columns with the given output
Compare actual data with the given output
Schema validation with given schema.
Navigate to the Pipeline Workflow Editor page. Click the Test Pipeline icon on the Header panel.
The Test Framework page opens displaying details of the selected pipeline.
Search Component: A Search bar is provided to search all components associated with that pipeline. It helps to find a specific component by inserting the name in the Search Bar.
Component Panel: It displays all the components associated with that pipeline.
Create Test Case: User can create a test case by clicking on the Create Test Case icon.
Click the Create Test Case icon.
The Test Case opens. Here, the user can create a new test case for the selected component from the component panel.
Test Name: Enter the test case name.
Test Description: Enter the description of the test case.
Input Data File: Upload the input data file. It is required for transformations and writer’s components.
Output Data File: Upload the expected output data file.
Schema File: Upload the schema of expected output data.
Input Data Type: It supports the JSON type.
Assertion Method: It supports the equals assertion method.
Sort: It orders the column values in Actual Output. A User can sort the string and integer column values.
Comparison Logic: It contains four type of comparison logic:
Compare Number of Columns: It compares input data columns with output data columns.
Compare Data: It compares input data with output data.
Run Test Cases: It will run single and multiple test cases for the selected component by clicking on the Run Test Cases button.
Test Cases: It displays the created test cases list for the selected component.
It displays the following the details:
Checkbox: The User can select multiple or single test cases while running the test cases.
Test Name: It displays name of the test case.
Test Case Description: It displays description of the test case.
Created Date: It displays the created date of the test case.
Delete Icon: The User can remove the test case by clicking on the delete icon.
The user can update the test case details under this tab.
Test Case Name: The User can change the test case name.
Test Description: The User can change the description of the test case.
Output Schema File: A User can change the schema of expected output data by clicking on the upload icon, view the schema by clicking on the view icon, remove the schema by clicking on cross icon.
Sort Column Name: A User can change the sorting column name.
Update: By clicking on the Update button user can update the test case details.
Last Updated Date: It displays the last updated date of the test case.
The user can check the existing input data by clicking on this tab. It contains Shrink, Expand, Upload, Remove icon.
Shrink: It Shrink the input data rows.
Expand: It expand the input data rows.
Upload: User can upload input data file by clicking on upload button.
Remove: User can remove input data file by clicking on remove button.
The user can check existing expected output data. It contains Shrink, Expand, Upload, Remove icon.
Shrink: It Shrink the expected output data rows.
Expand: It expand the expected output data rows.
Upload: User can upload expected output data file by clicking on upload button.
Remove: User can remove expected output data file by clicking on remove button.
It displays the selected latest and previous test case reports.
Reports: It displays the latest report of each test cases for selected component. It displays each Test case name, Component Version, Comparison Logics and Run date.
It displays the log details of the component.
It displays the component pods, if user run test case.
Please Note: Before starting to use the Azure Reader component, please follow the steps below to obtain the Azure credentials from the Azure Portal:
Accessing Azure Blob Storage: Shared Access Signature (SAS), Secret Key, and Principal Secret
This document outlines three methods for accessing Azure Blob Storage: Shared Access Signatures (SAS), Secret Keys, and Principal Secrets.
Understanding Security Levels:
Shared Access Signature (SAS): This is the recommended approach due to its temporary nature and fine-grained control over access permissions. SAS tokens can be revoked, limiting potential damage if compromised.
Secret Key: Secret keys grant full control over your storage account. Use them with caution and only for programmatic access. Consider storing them securely in Azure Key Vault and avoid hardcoding them in scripts.
Principal Secret: This applies to Azure Active Directory (Azure AD) application access. Similar to secret keys, use them cautiously and store them securely (e.g., Azure Key Vault).
1. Shared Access Signature (SAS):
Benefits:
Secure: Temporary and revocable, minimizing risks.
Granular Control: Define specific permissions (read, write, list, etc.) for each SAS token.
Steps to Generate an SAS Token:
Navigate to Azure Portal: Open the Azure portal () and log in with your credentials.
Access Blob Storage Account: Locate "Storage accounts" in the left menu and select your storage account.
Configure SAS Settings: Find and click on "Shared access signature" in the settings. Define the permissions, expiry date, and other parameters for your needs.
2. Secret Key:
Use with Caution:
High-Risk: Grants full control over your storage account.
Secure Storage: Store them securely in Azure Key Vault, never hardcode them in scripts.
Steps to Obtain Secret Key:
Navigate to Azure Portal: Open the Azure portal and log in.
Access Blob Storage Account: Locate and select your storage account.
View Secret Keys: Click on "Access keys" to view your storage account keys. Do not store these directly in code. Consider Azure Key Vault for secure storage.
3. Principal Secret (Azure AD Application):
Use for Application Access:
Grants access to your storage account through an Azure AD application.
Secure Storage: Store them securely in Azure Key Vault, never hardcode them in scripts.
Steps to Obtain Principal Secret:
Navigate to Azure AD Portal: Open the Azure AD portal () and log in with your credentials.
Access App Registrations: Locate "App registrations" in the left menu.
Select Your Application: Find and click on the application for which you want to obtain the principal secret.
Read Using: There are three authentication methods available to connect with Azure in the Azure Blob Reader Component:
Shared Access Signature
Secret Key
Principal Secret
Provide the following details:
Shared Access Signature: This is a URI that grants restricted access rights to Azure Storage resources.
Account Name: Provide the Azure account name.
Container: Provide the container name from where the file is located and which has to be read.
File Type: There are five (5) types of file extensions available:
CSV
JSON
PARQUET
AVRO
XML
Read Directory: This field will be checked by default. If this option is enabled, the component will read data from all the blobs present in the container.
Blob Name: This field will display only if the Read Directory field is disabled. Enter the specific name of the blob whose data has to be read.
Limit: Enter a number to limit the number of records that has to be read by the component.
Column Filter: Enter the column names here. Only the specified columns will be fetched from Azure Blob. In this field, the user needs to fill in the following information:
Source Field: Enter the name of the column from the blob. The user can add multiple columns by clicking on the "Add New Column" option.
Destination Field: Enter the alias name for the source field.
Column Type
Query: Enter a Spark SQL query in this field. Use inputDf as the table name.
Provide the following details:
Account Key: Used to authorize access to data in your storage account via Shared Key authorization.
Account Name: Provide the Azure account name.
Container: Provide the container name from where the file is located and which has to be read.
File Type: There are five (5) types of file extensions available:
CSV
JSON
PARQUET
AVRO
XML
Read Directory: This field will be checked by default. If this option is enabled, the component will read data from all the blobs present in the container.
Blob Name: This field will display only if the Read Directory field is disabled. Enter the specific name of the blob whose data has to be read.
Limit: Enter a number to limit the number of records that has to be read by the component.
Column Filter: Enter the column names here. Only the specified columns will be fetched from Azure Blob. In this field, the user needs to fill in the following information:
Source Field: Enter the name of the column from the blob. The user can add multiple columns by clicking on the "Add New Column" option.
Destination Field: Enter the alias name for the source field.
Column Type
Query: Enter a Spark SQL query in this field. Use inputDf as the table name.
Provide the following details:
Client ID: The unique Application (client) ID assigned to your app by Azure AD when the app was registered.
Tenant ID: A globally unique identifier (GUID) that is different from your organization name or domain.
Client Secret: The password of the service principal.
Account Name: Provide the Azure account name.
File Type: There are five (5) types of file extensions available:
CSV
JSON
PARQUET
AVRO
Read Directory: This field will be checked by default. If this option is enabled, the component will read data from all the blobs present in the container.
Blob Name: This field will display only if the Read Directory field is disabled. Enter the specific name of the blob whose data has to be read.
Limit: Enter a number to limit the number of records that has to be read by the component.
Column Filter: Enter the column names here. Only the specified columns will be fetched from Azure Blob. In this field, the user needs to fill in the following information:
Source Field: Enter the name of the column from the blob. The user can add multiple columns by clicking on the "Add New Column" option.
Destination Field: Enter the alias name for the source field.
Column Type
Query: Enter a Spark SQL query in this field. Use inputDf as the table name.
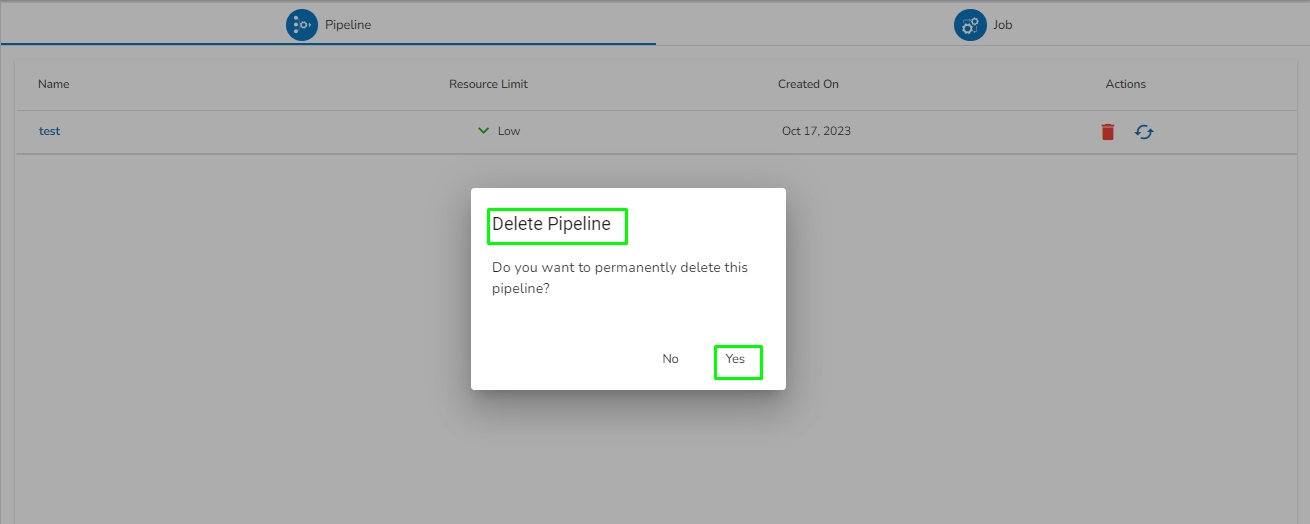
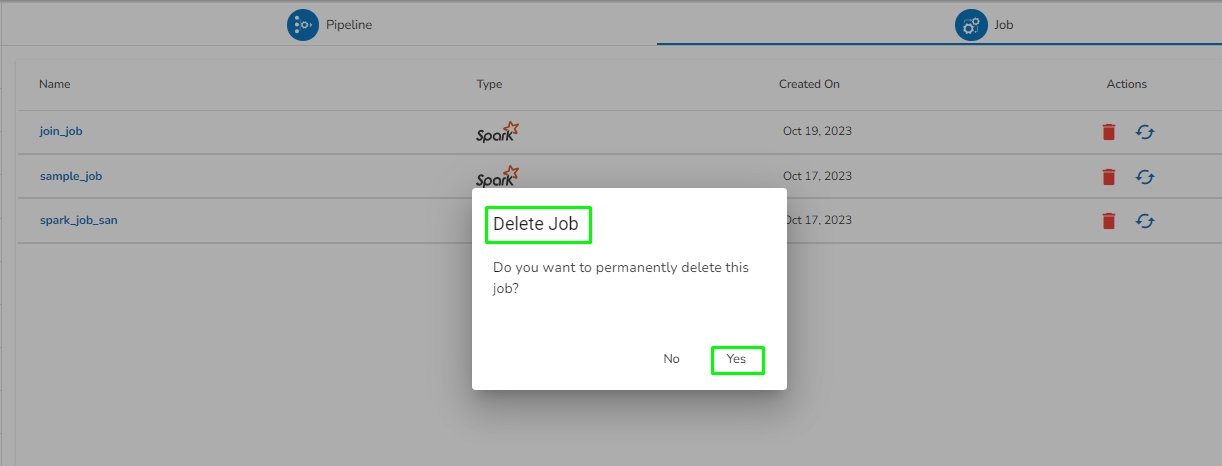
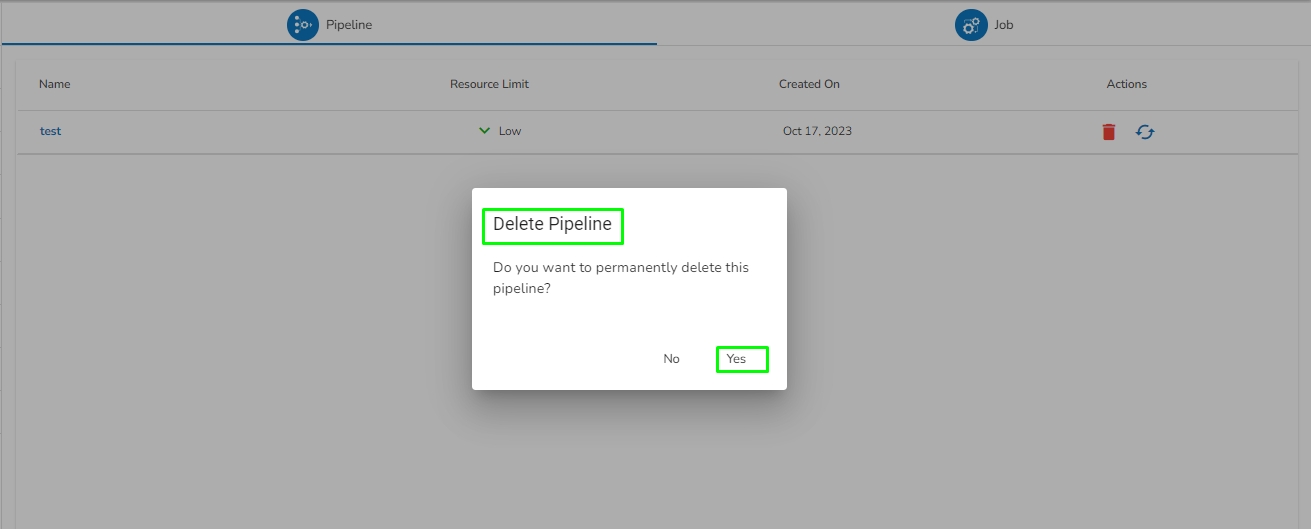
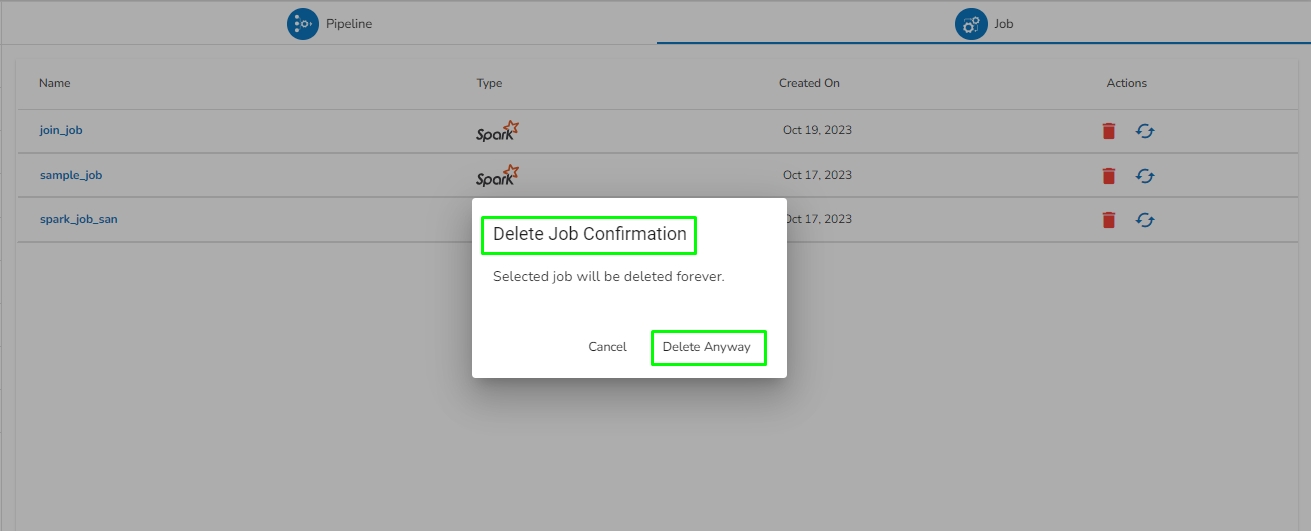
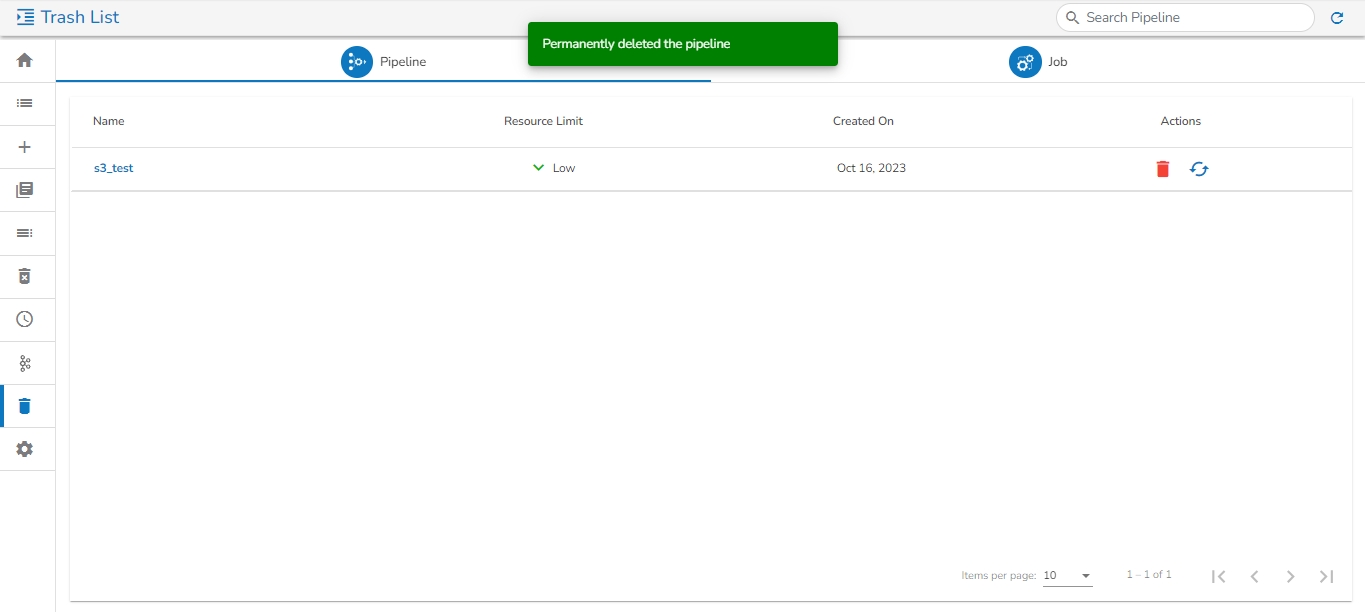
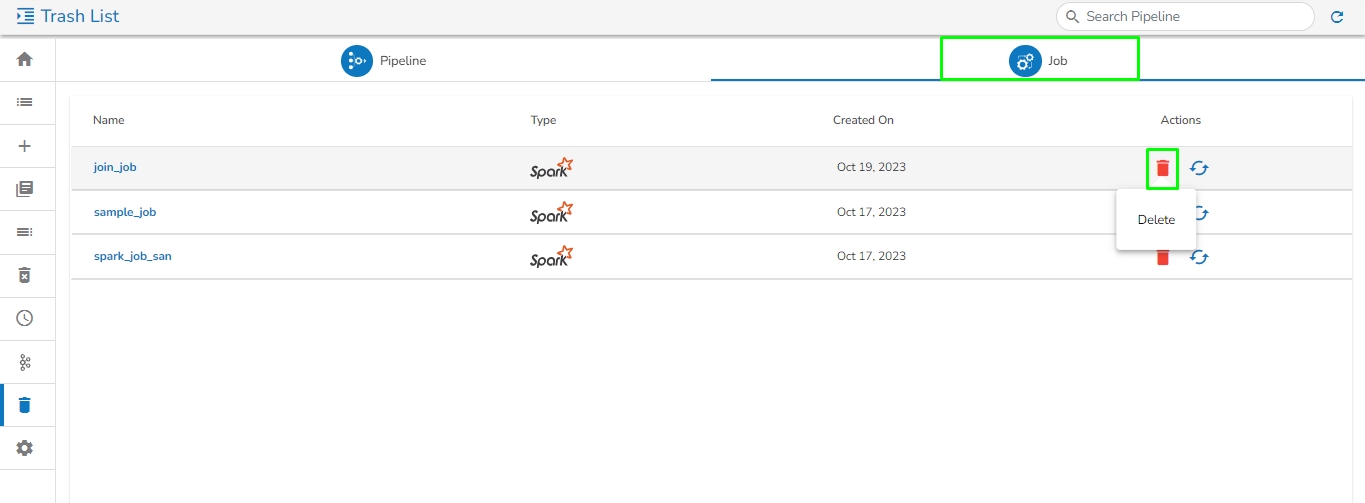
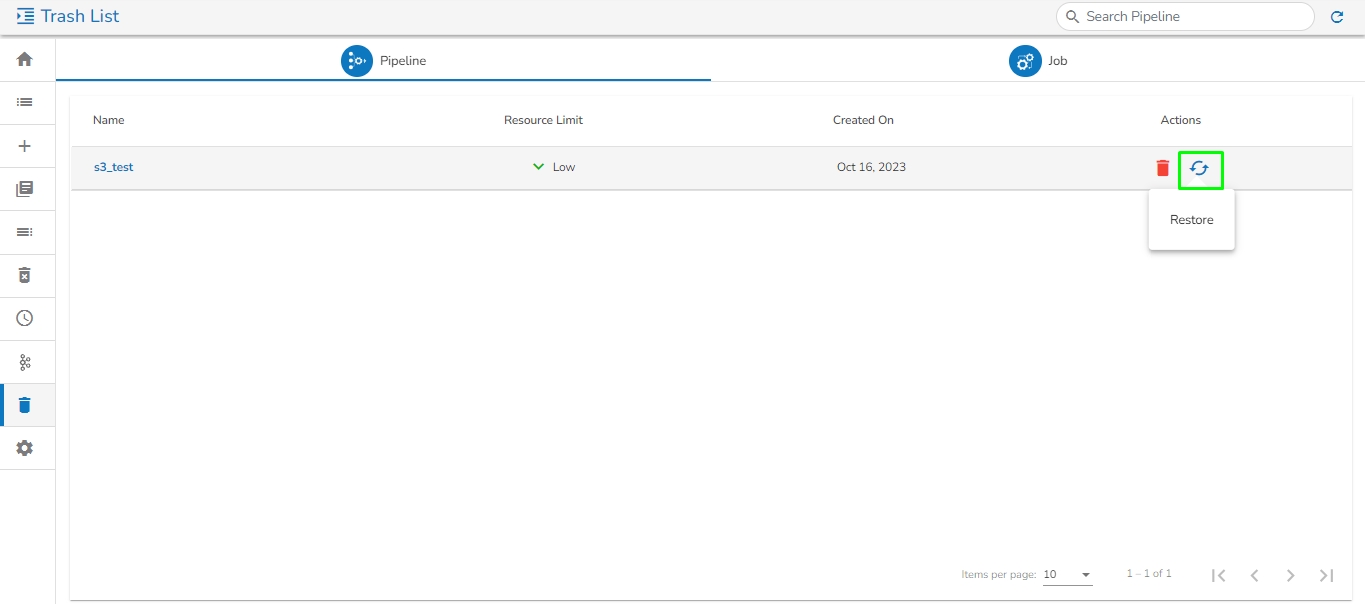
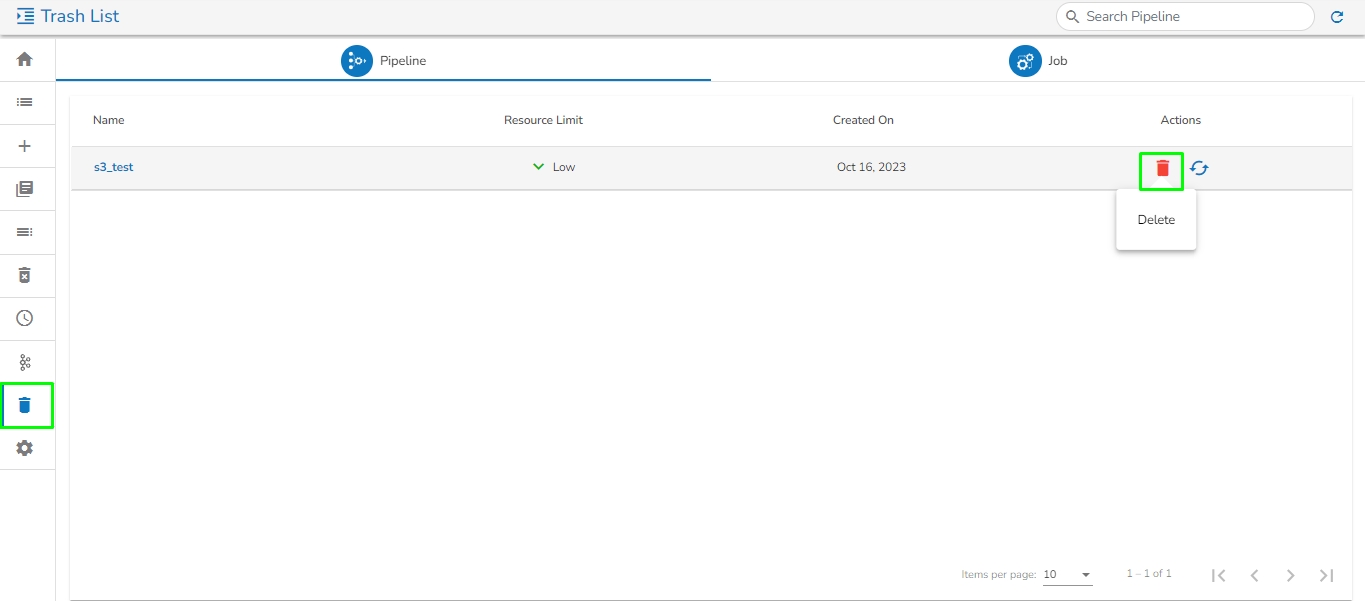
A MongoDB reader component is designed to read and access data stored in a MongoDB database. Mongo readers typically authenticate with MongoDB using a username and password or other authentication mechanisms supported by MongoDB.
This page covers the configuration steps for the Mongo DB Reader.All component configurations are classified broadly into the following sections:
Meta Information
MongoDB Reader reads data from the specified database’s Collection. It also has an option to filter the data using Mongo Query Language(MQL), Which will run the MQL directly on the MongoDB Server, and push the data to the out event.
Drag & drop the Mongo Reader component to the Workflow Editor.
Click on the dragged reader component.
The component properties tabs open below.
It is the default tab to open for the Mongodb Reader Lite while configuring the component.
Select an Invocation Type from the drop-down menu to confirm the running mode of the reader component. Select Real-Time or Batch from the drop-down menu.
Deployment Type: It displays the deployment type for the component (This field comes pre-selected).
Container Image Version: It displays the image version for the docker container (This field comes pre-selected).
Open the Meta Information tab and fill in all the connection-specific details of MongoDB Reader Lite. The Meta Information tab opens with the below given fields:
Connection Type: Select either of the options out of Standard, SRV, and Connection String as connection types.
Port number (*): Provide the Port number (It appears only with the Standard connection type).
Meta Information Tab with enabled the "Enable SSL" field:
After configuring the required configuration fields, click the Save Component in Storage icon provided in the reader configuration panel to save the component.
A confirmation message appears to notify the component properties are saved.
Click on the Update Pipeline icon to update the pipeline.
A confirmation message appears to inform the user.
Click on the Activate Pipeline icon.
The Confirm dialog box appears to ask the user permission.
Click the YES option.
A confirmation message appears to inform that the pipeline has been activated.
Click on the Toggle Log Panel icon.
The Log Panel opens displaying the Logs and Advance Logs tabs.
A configured component will display some more tabs such as the Configuration, Logs, and Pod Logs tabs (as displayed below for the Mongodb Reader Lite component).
This tab will show all the description about the component.

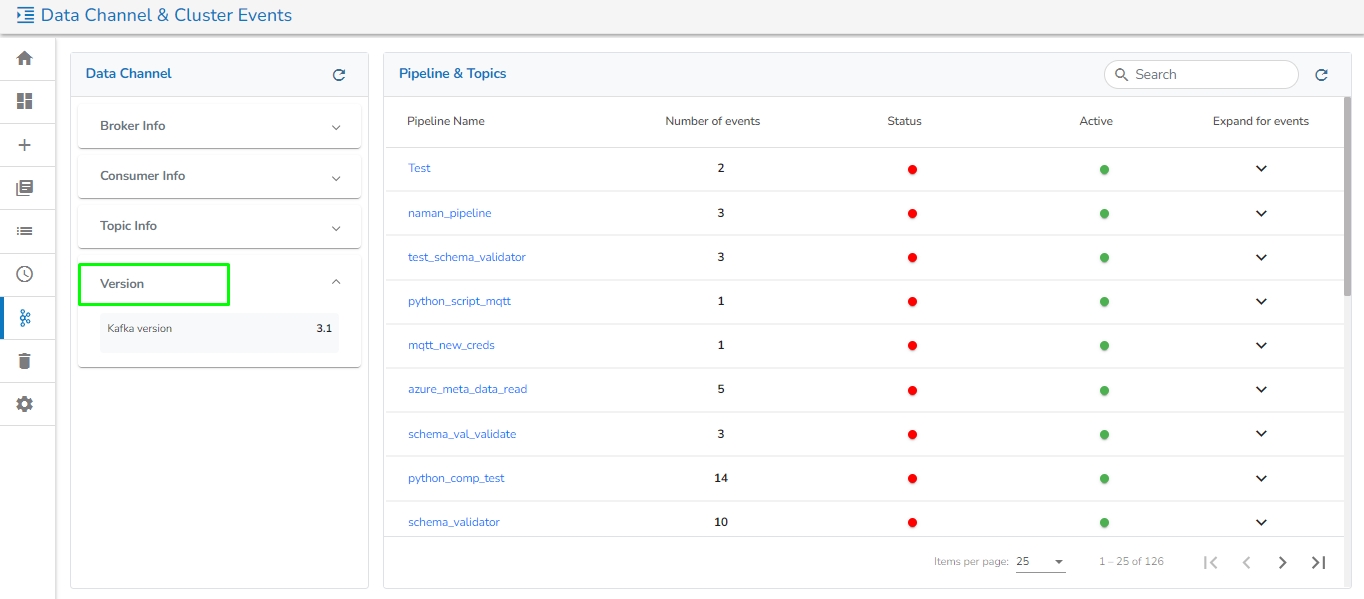
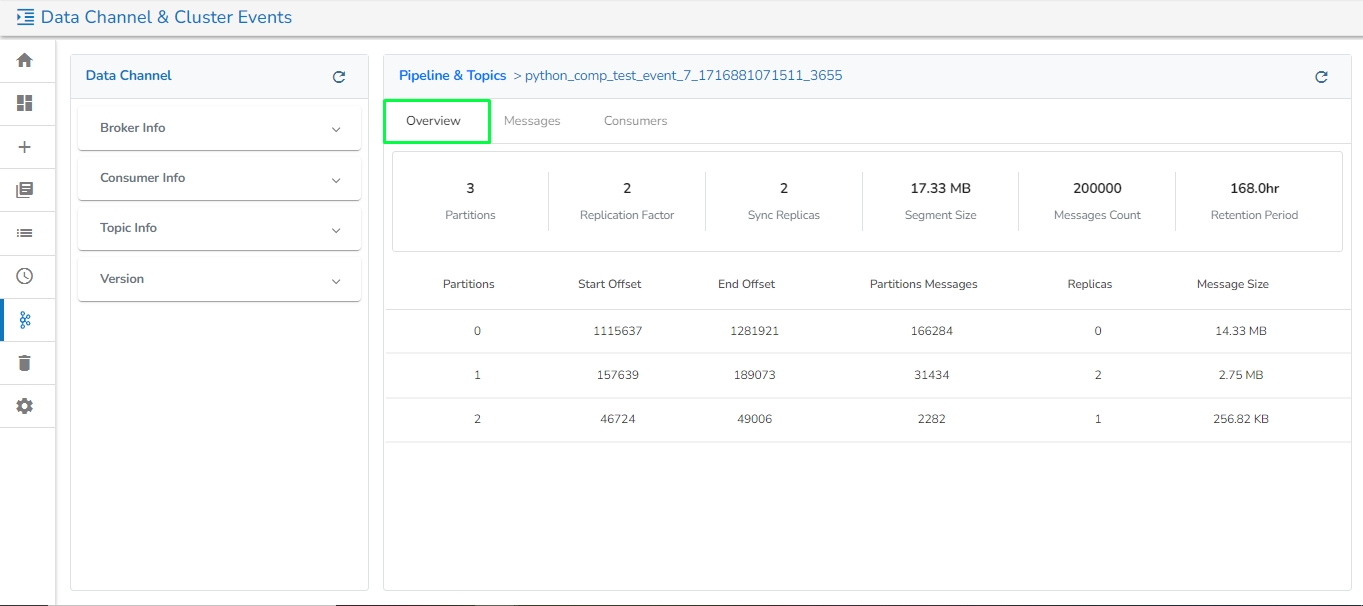
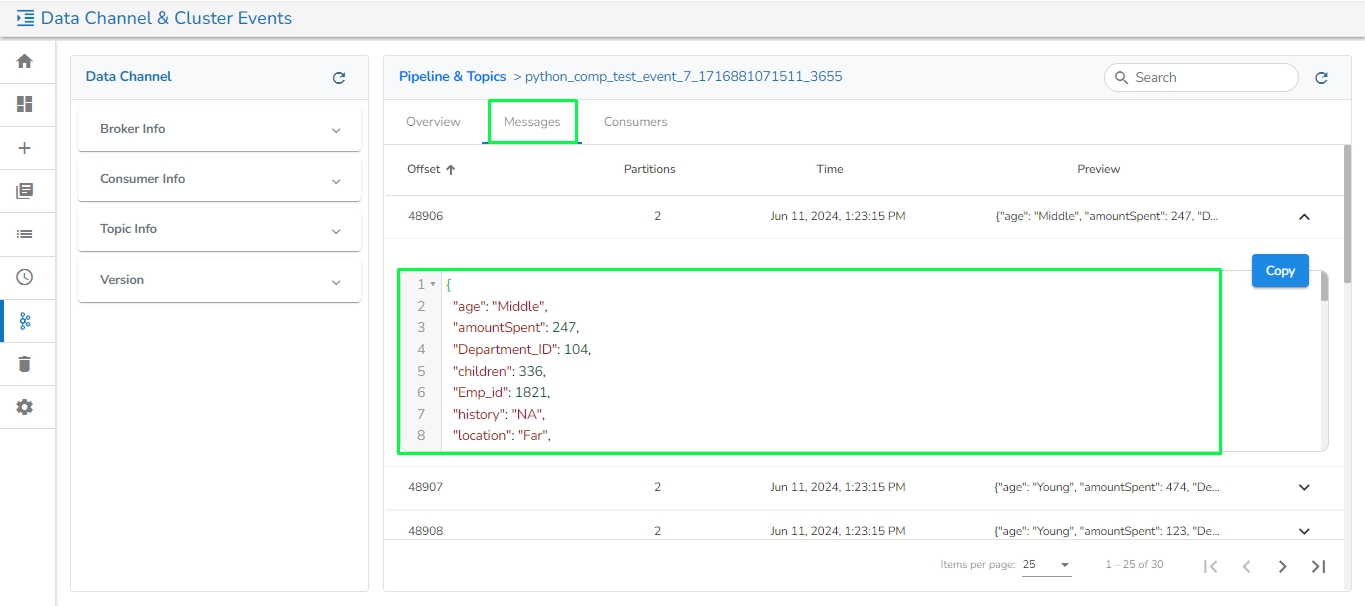

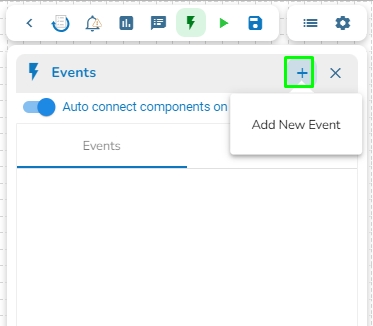
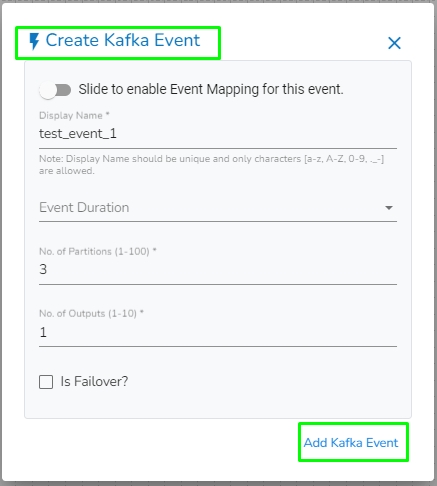

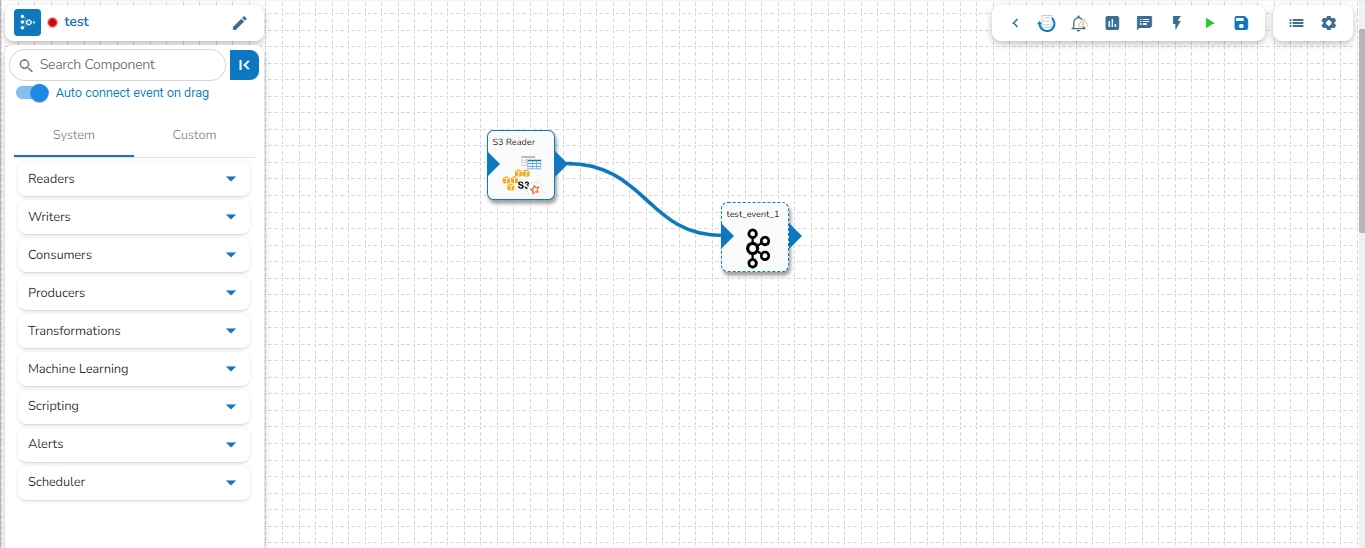
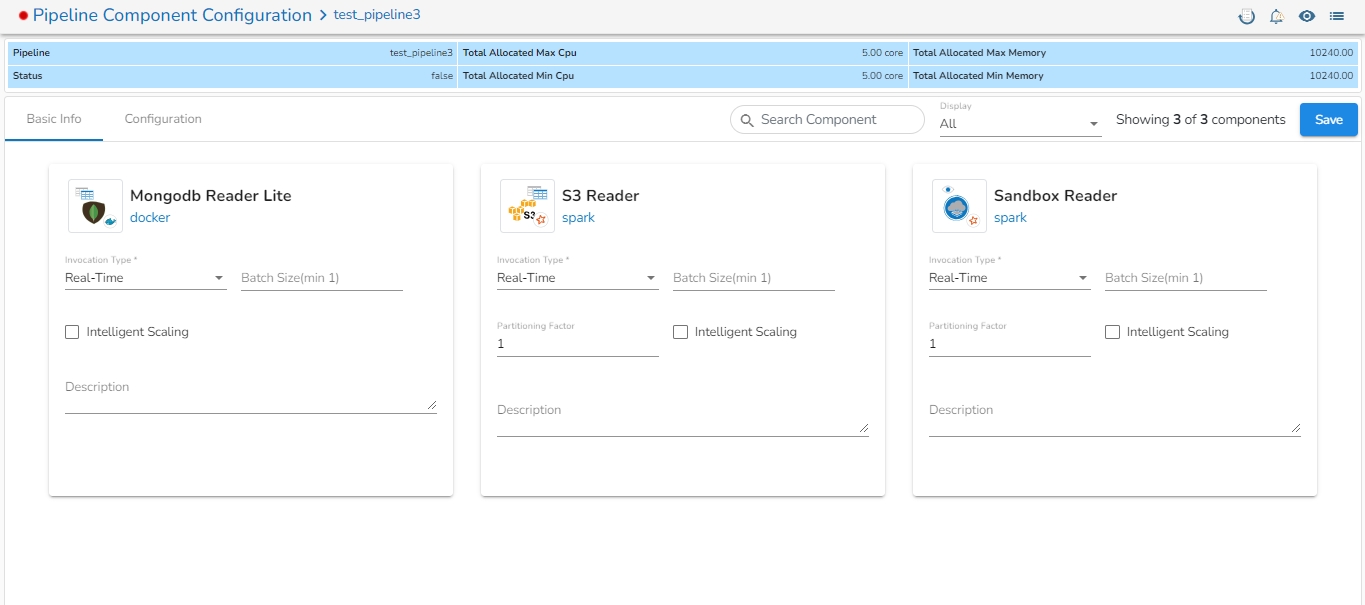
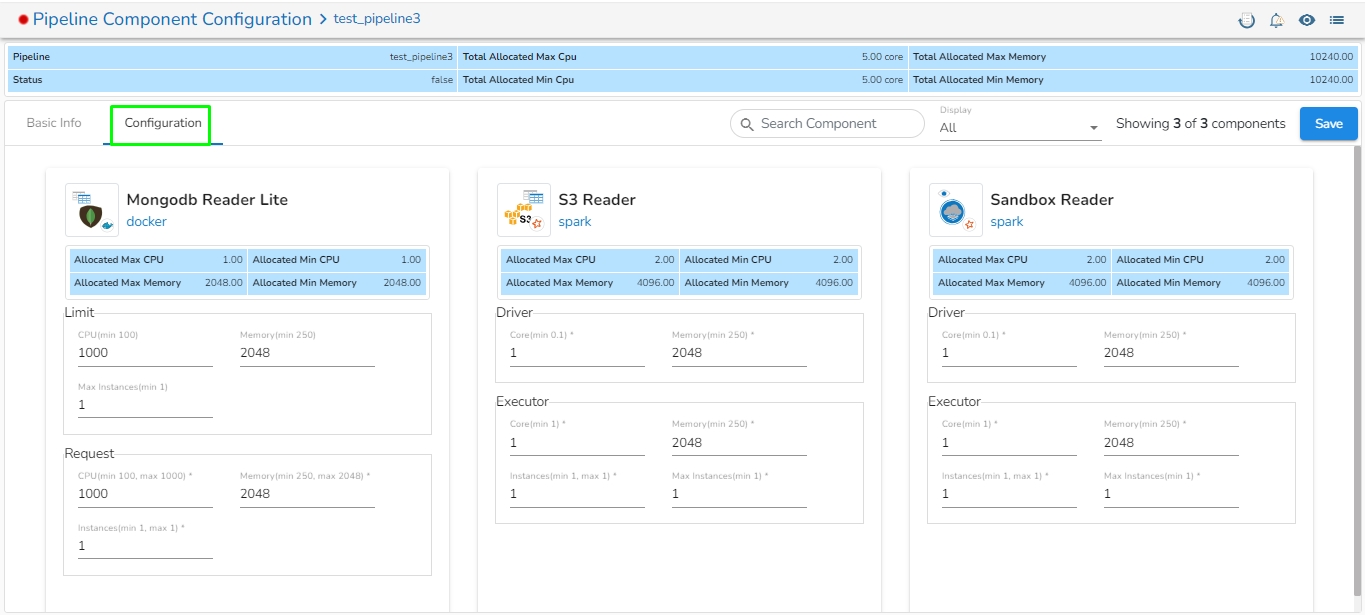


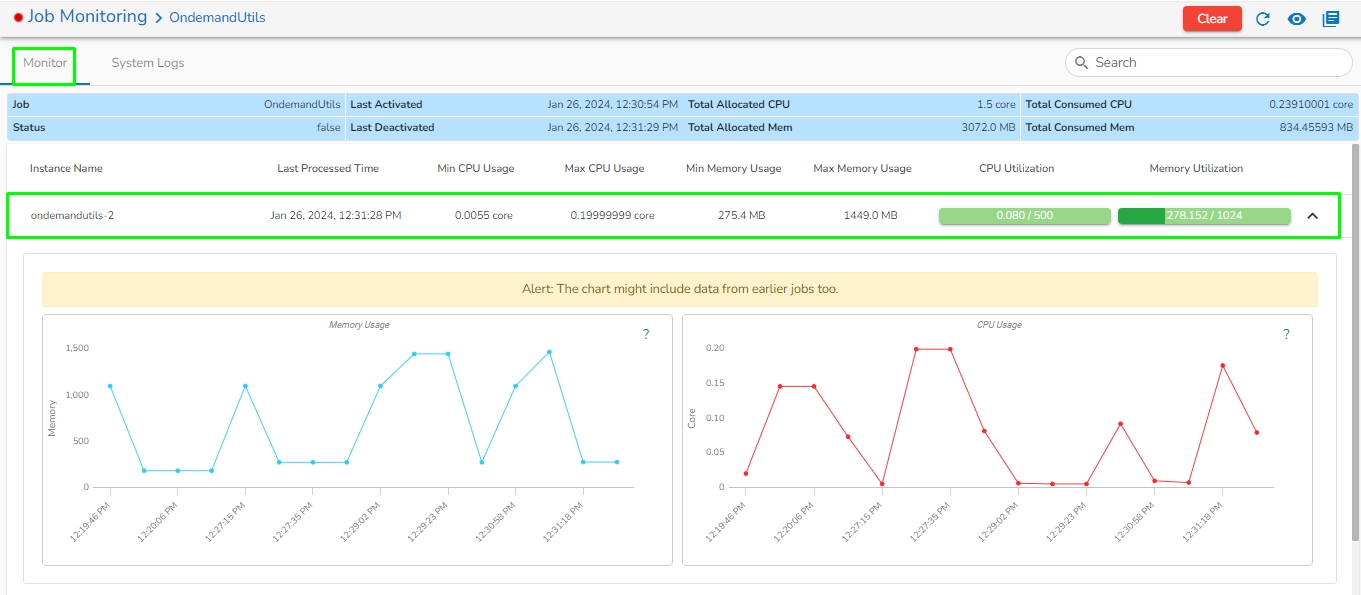
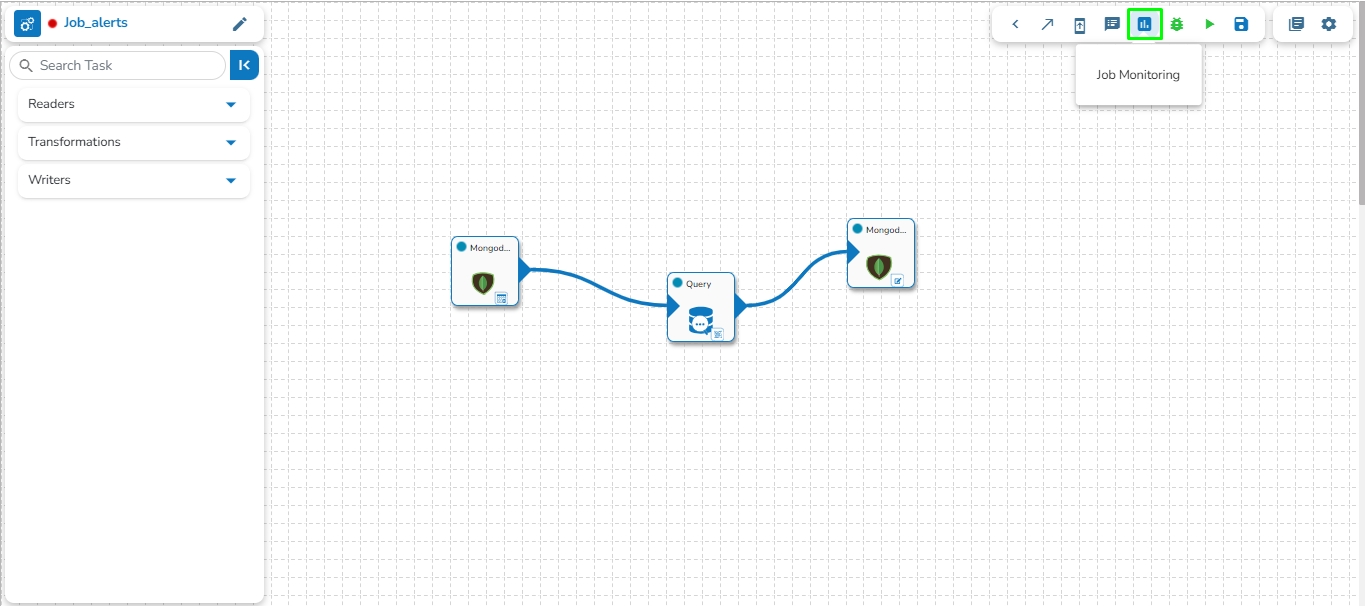
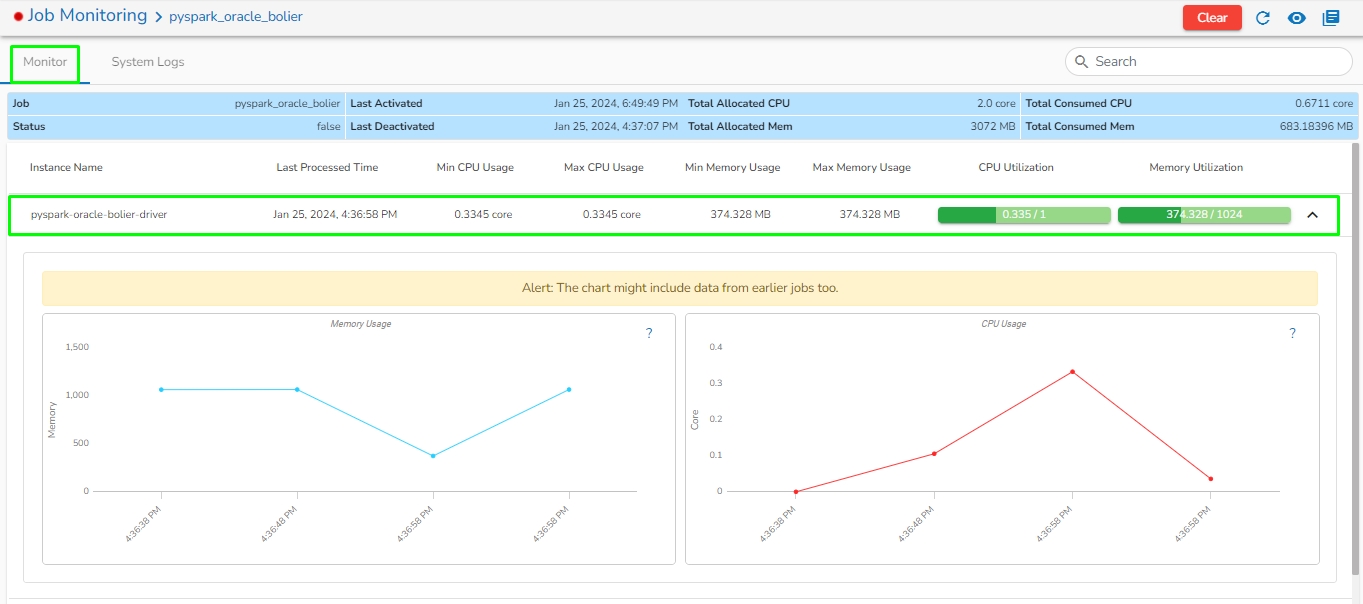

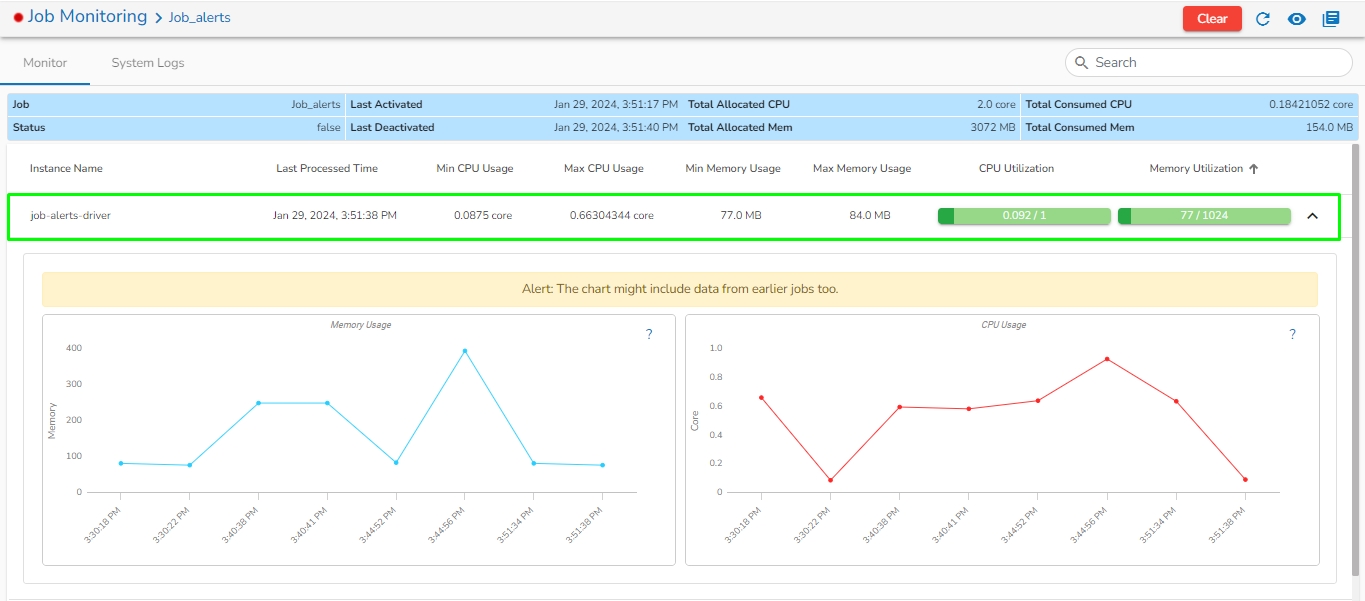
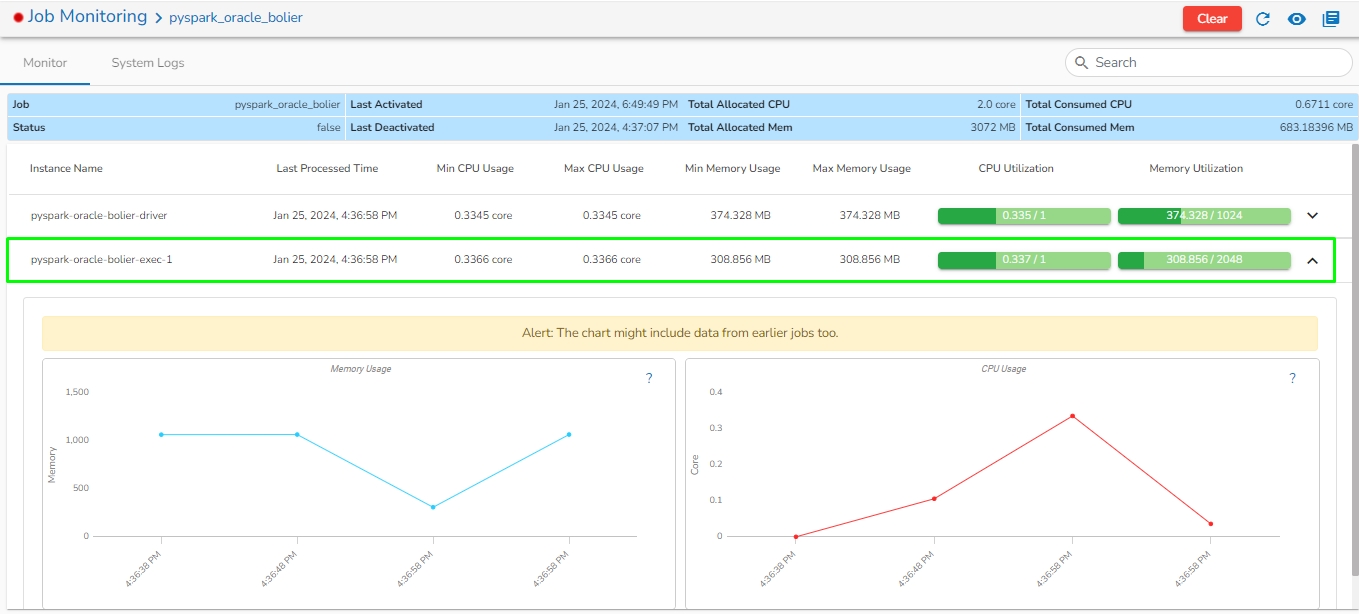
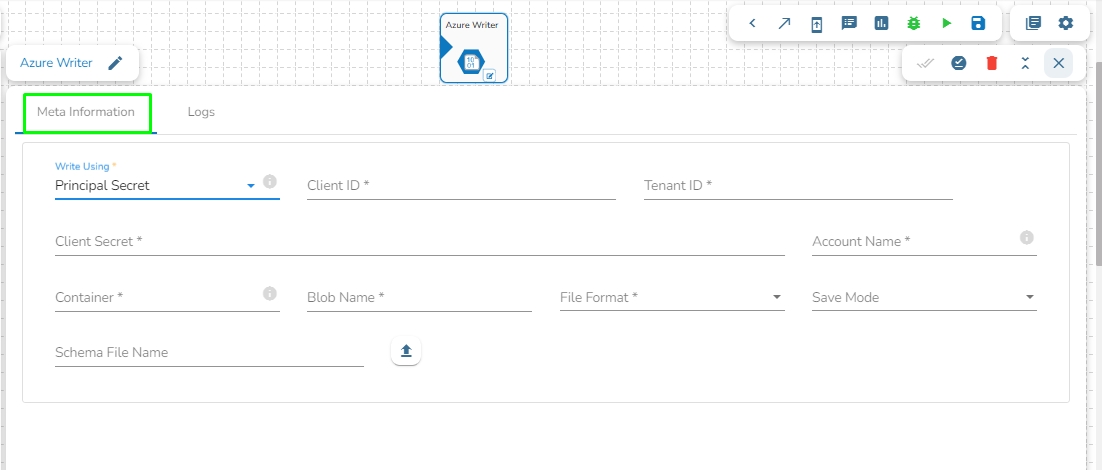
All the saved Jobs by a logged-in user get listed by using this option.
Azure Metadata Reader is designed to read and access metadata associated with Azure resources. Azure Metadata Readers typically authenticate with Azure using Azure Active Directory credentials or other authentication mechanisms supported by Azure.
All component configurations are classified broadly into the following sections:
Meta Information
select * from inputDf where Gender = 'Male';Topic 1 name: job_13464363406493_0
Topic 2 name: job_13464363406493_1
Topic 3 name: job_13464363406493_2import logging
from pymongo import MongoClient
def data(job_payload,conn_str,database,collection):
"""
Insert data into MongoDB based on the provided job_payload.
Parameters:
job_payload (dict): The payload provided when creating the job or sent from an API call.
conn_str (str): Connection string for MongoDB.
database (str): Database name in MongoDB.
collection (str): Collection name in MongoDB.
"""
logging.info(job_payload)
client = MongoClient(conn_str)
db = client[database]
collection = db[collection]
collection.insert_one(job_payload)
logging.info(f"Data {job_payload} inserted successfully")[{"emp_id": 0, "department": "IT", "salary": 71357, "working_mode": "Hybrid"},
{"emp_id": 1, "department": "Operations", "salary": 33411, "working_mode": "onsite"},
{"emp_id": 2, "department": "Sales", "salary": 49754, "working_mode": "Hybrid"},
{"emp_id": 3, "department": "Sales", "salary": 91636, "working_mode": "Hybrid"},
{"emp_id": 4, "department": "Operations", "salary": 96750, "working_mode": "onsite"},
{"emp_id": 5, "department": "Sales", "salary": 38198, "working_mode": "Hybrid"},
{"emp_id": 6, "department": "IT", "salary": 94163, "working_mode": "Hybrid"},
{"emp_id": 7, "department": "IT", "salary": 45017, "working_mode": "Hybrid"},
{"emp_id": 8, "department": "HR", "salary": 71126, "working_mode": "Hybrid"},
{"emp_id": 9, "department": "Operations", "salary": 31708, "working_mode": "Hybrid"},
{"emp_id": 10, "department": "Sales", "salary": 86318, "working_mode": "onsite"},
{"emp_id": 11, "department": "IT", "salary": 57910, "working_mode": "Hybrid"}][
{"output": "jobs/ApportionedIdentifiers.csv"},
{"output": "jobs/accounnts.csv"},
{"output": "jobs/gluue.csv"},
{"output": "jobs/census_2011.csv"}
]//Sample Spark SQL Query:
Select * from inputDf where department='sales';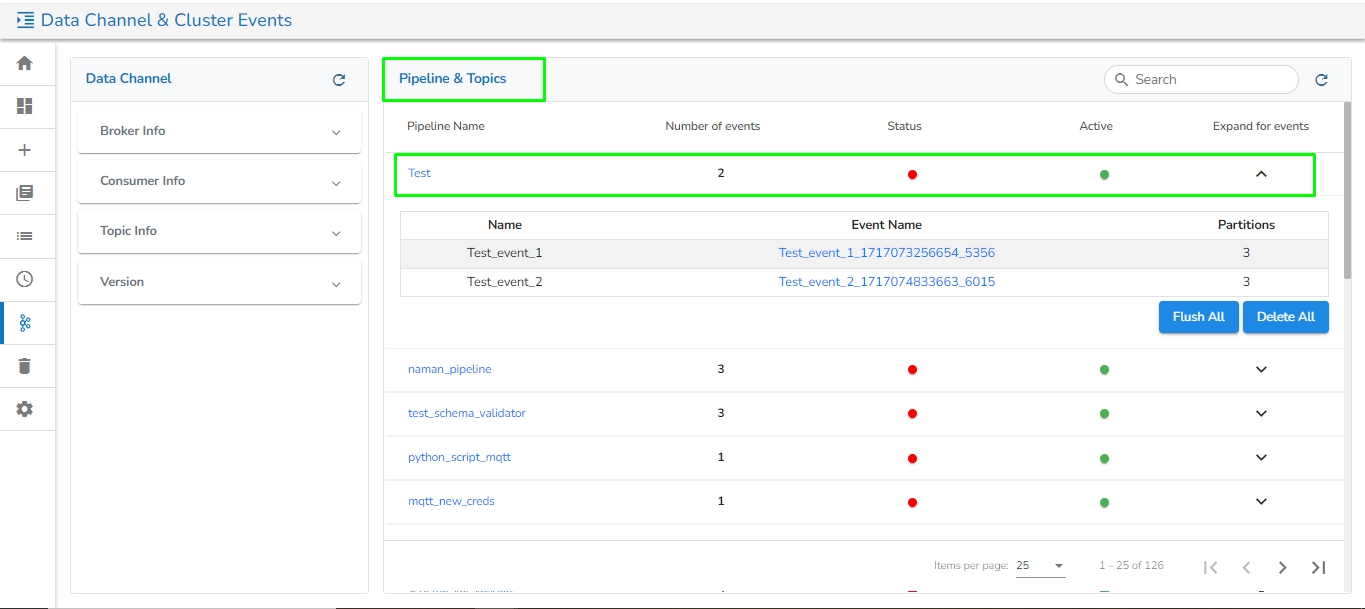
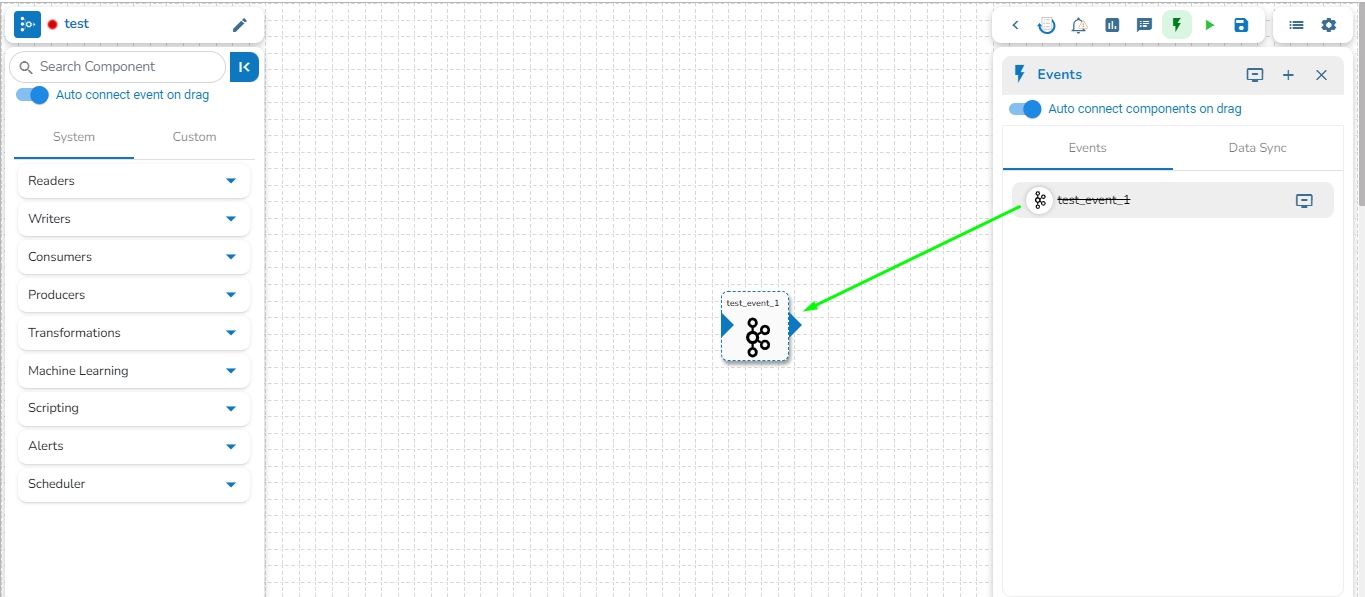


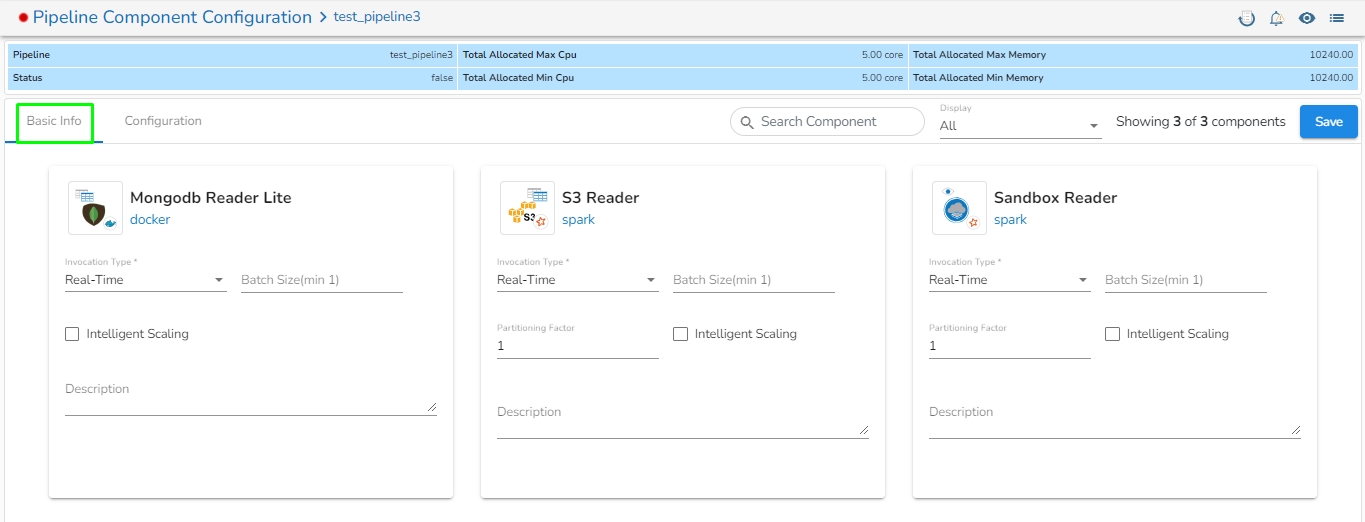
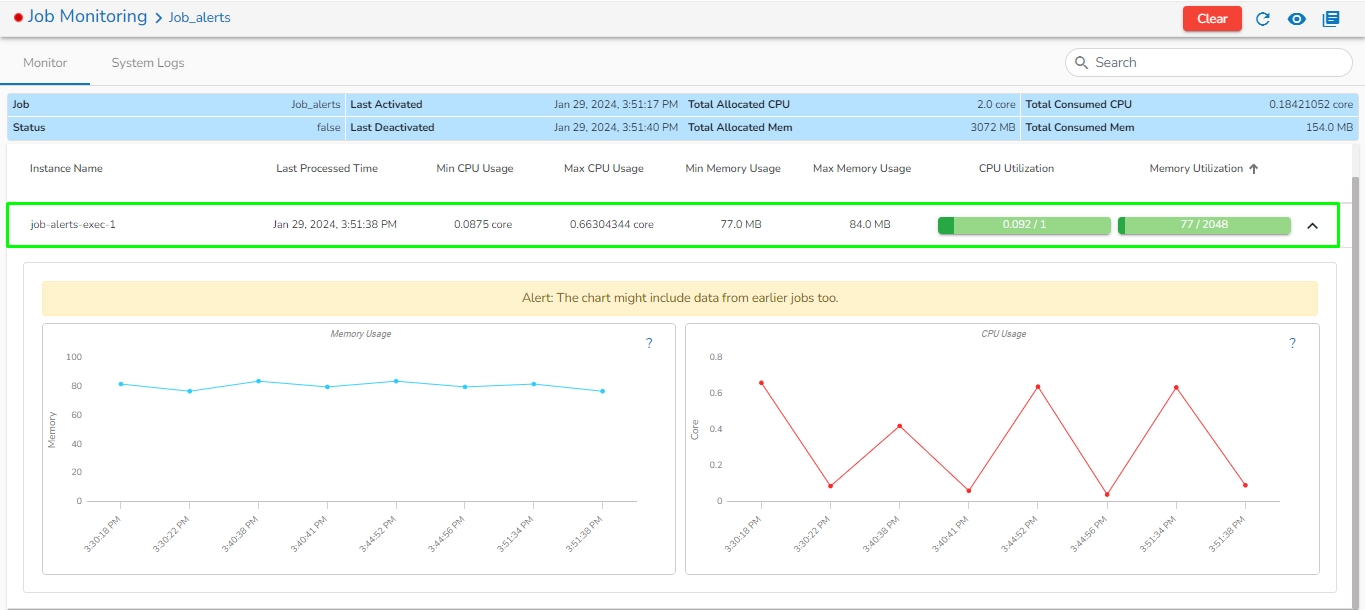


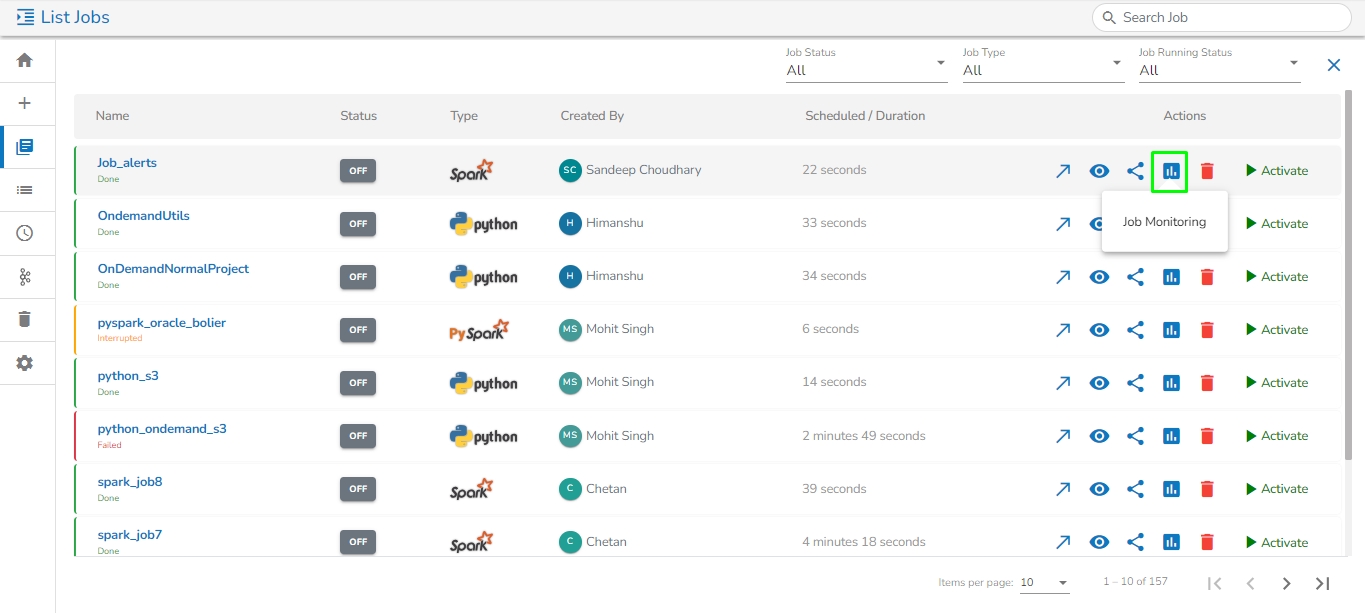


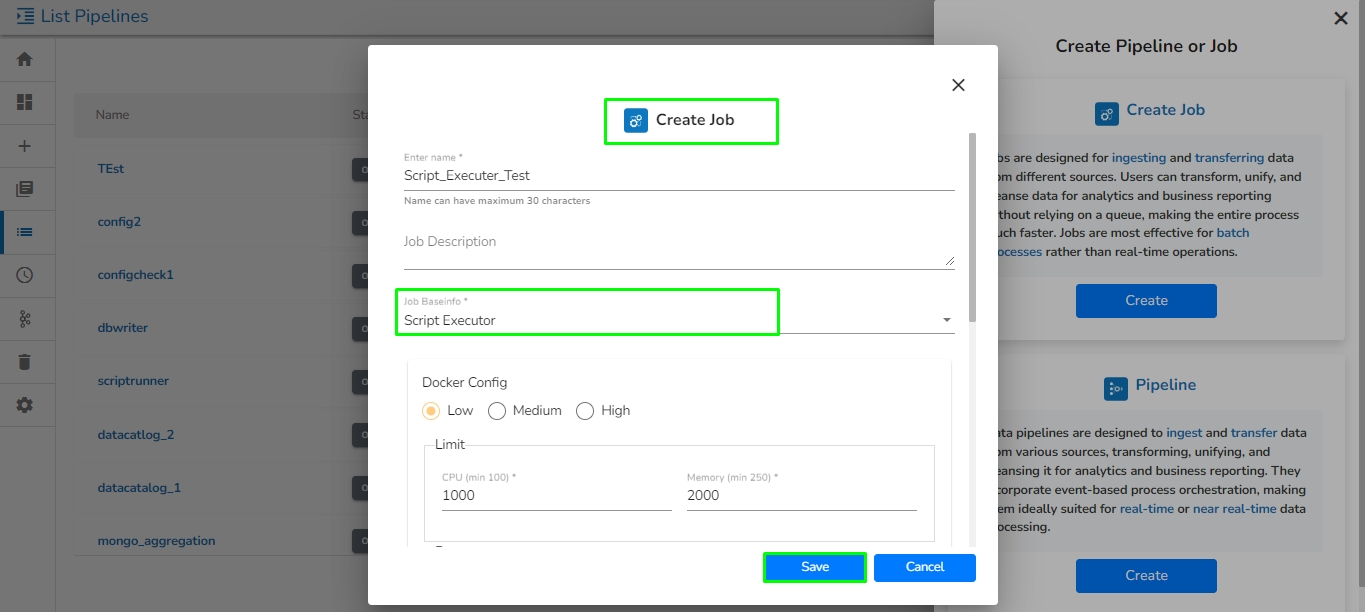
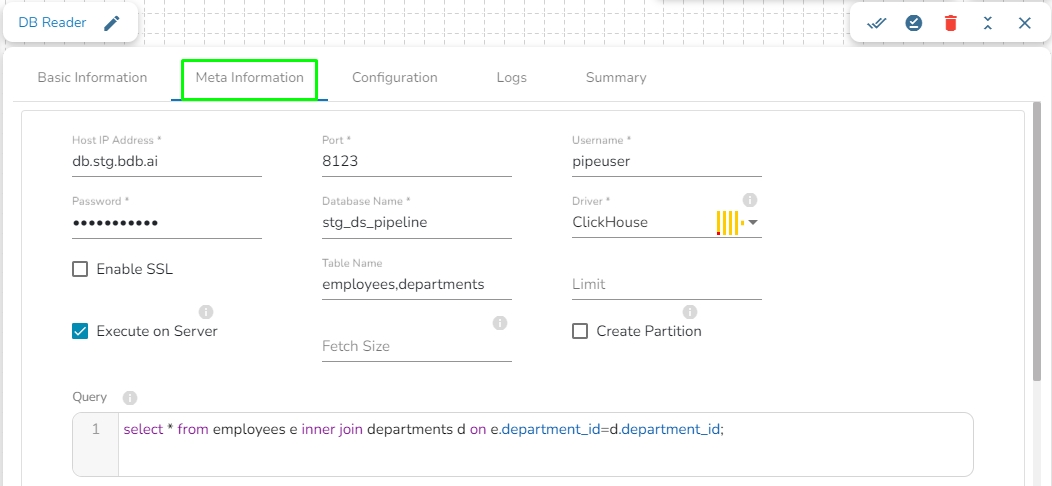
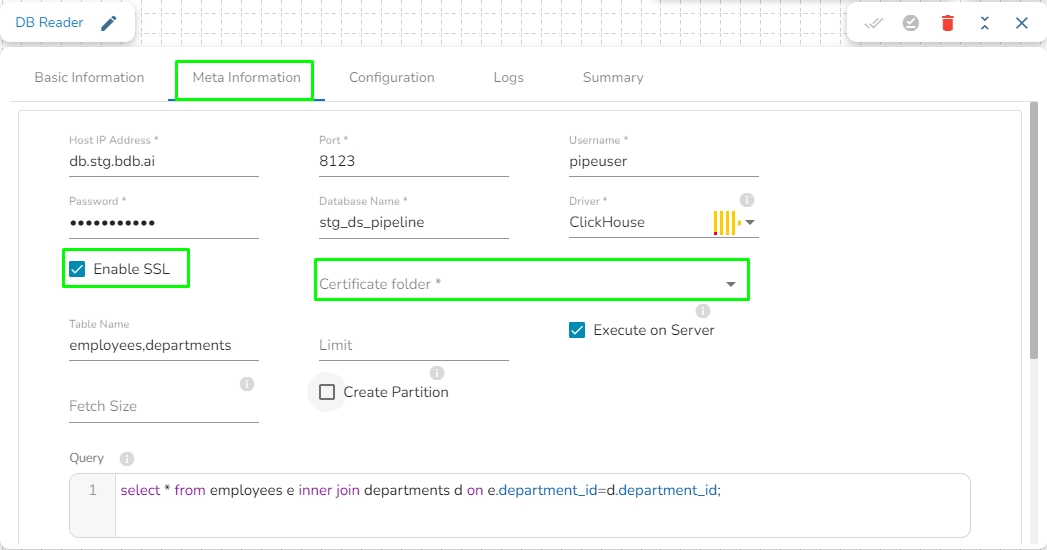


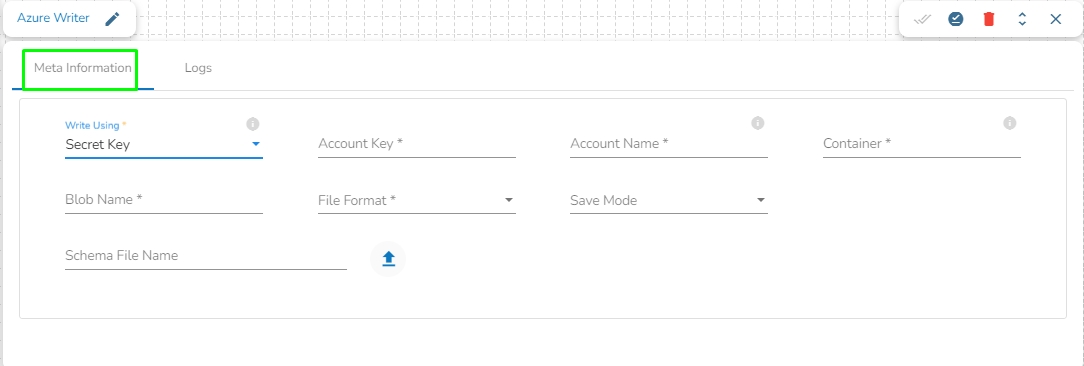

Row Tags: Provide the row tags from the XML files.
Join Row Tags: Enable this option to join multiple row tags.
False: When push down is set to False, predicate filters are not pushed down to the ORC storage layer. Instead, filtering is performed after the data has been read into memory by the processing engine. This may result in more data being read and potentially slower query performance compared to when push down is enabled.
Check Data Matches Schema: It checks the uploaded schema with expected output data.
Copy and Use SAS Token: Copy the generated SAS token. Use this token to securely access your Blob Storage resources in your code.
Generate New Client Secret (Principal Secret):
Under "Client secrets," click on "New client secret."
Enter a description, select the expiry duration, and click "Add" to generate the new client secret.
Copy the generated client secret immediately as it will be hidden afterward.
Upload: This option allows the user to upload a data file in CSV, JSON, or EXCEL format. The column names will be automatically fetched from the uploaded data file and filled out in the Name, Alias, and Column Type fields.
Download Data: This option will download the data filled in the Column Filter field in JSON format.
Delete Data: This option will clear all the information filled in the Column Filter field.
XML
Upload: This option allows the user to upload a data file in CSV, JSON, or EXCEL format. The column names will be automatically fetched from the uploaded data file and filled out in the Name, Alias, and Column Type fields.
Download Data: This option will download the data filled in the Column Filter field in JSON format.
Delete Data: This option will clear all the information filled in the Column Filter field.
Snappy: This compression type is select by default. A fast compression and decompression algorithm developed by Google, optimized for speed rather than maximum compression ratio.
Compression Level: This field appears if Deflate compression is selected. It provides a drop-down menu with levels ranging from 0 to 9, indicating the compression intensity.
Failover Event: Select a failover Event from the drop-down menu.
Batch Size (min 10): Provide the maximum number of records to be processed in one execution cycle (Min limit for this field is 10).
Username (*): Provide a username.
Password (*): Provide a valid password to access the MongoDB.
Database Name (*): Provide the name of the database where you wish to write data.
Collection Name (*): Provide the name of the collection.
Fetch size: Specifies the number of documents to return in each batch of the response from the MongoDB collection. For ex: If 1000 is given in the fetch size field. Then it will read the 1000 data at one execution and it will process it further.
Additional Parameters: Provide details of the additional parameters.
Enable SSL: Check this box to enable SSL for this components. MongoDB connection credentials will be different if this option is enabled.
The user needs to upload the following files on the certificate upload page:
Certificate file (.pem format)]
Key file (.key format)
Certificate Folder: This option will appear when the Enable SSL field is checked-in. The user has to select the certificate folder from drop down which contains the files which has been uploaded to the admin settings for connecting MongoDB with SSL. Please refer the below given images for the reference.
Connection String (*): Provide a connection string (It appears only with the Connection String connection type).
Query: Provide a relevant query service. We can write the Mongo queries in the following manner:
Click on the List Jobs option.
The List Jobs page opens displaying the created jobs.
Select a Job from the displayed list, and click on it.
This will open a panel containing three tabs:
The Job Details panel displays key metadata: the creator, last updater, last activation timestamp, and last deactivation timestamp. This information helps users track changes and manage their workflows effectively.
Tasks: Indicates the number of tasks used in the job.
Created: Indicates the user's name who created the job (with the date and time stamp).
Updated: Indicates the user's name who updated the job (with the date and time stamp).
Last Activated: Indicates the user's name who last activated the job (with the date and time stamp).
Last Deactivated: Indicates the user's name who last deactivated the job (with the date and time stamp).
Cron Expression: A string representing a schedule specifying when the job should run.
Trigger Interval: The interval at which the job is triggered (e.g., every 5 minutes).
Next Trigger: Date and time of the next scheduled trigger for the job.
Description: Description of the job provided by the user.
Total Allocated Min CPU: Total Minimum allocated CPU (in Cores)
Total Allocated Min Memory: Total Minimum allocated Memory (MB)
Total Allocated Max CPU: Total Maximum allocated CPU (in Cores)
Total Allocated Max Memory: Total Maximum allocated Memory (MB)
Total Allocated CPU: Total allocated CPU cores.
Total Allocated Memory: Total allocated memory in megabytes (MB).
Provides relevant information about the selected job's past runs, including success or failure status.
A Clear option is available to clear the job history.
Click on the Clear button from the History tab.
It will clear all the job run history and logs from the History tab and Sandbox location.
A Refresh icon is provided for refreshing the displayed job history.
In the List Jobs page, the user can view and download the pod logs for all instances by clicking on the View System Logs option in the History tab.
Once the user clicks on the View System Logs option, a drawer panel will open from the right side of the window. The user can select the instance for which the System logs have to be downloaded from the Select Hostname drop-down option.
Clear: It will clear all the job run history from the History tab.
Navigate to the History section for a Job.
Click the Clear option.
The Pin and Unpin feature allows users to prioritize and easily access specific jobs within a list. This functionality is beneficial for managing tasks, projects, or workflows efficiently. This feature is available on each job card on the List Jobs page.
Navigate to the List Jobs page.
Select the jobs that you wish to pin.
Click the Pin icon for the selected Job.
The job gets pinned to the list for easy access and appears at the top of the job list if it is the first pinned job.
You can use the pin icon to pin multiple jobs on the list.
Click the Unpin icon for a pinned job.
The selected job gets unpinned from the list.
A Job gets some actions to be applied under the Actions section on the List Jobs page.
Push Job
Enables to Push a Job to the VCS.
View
Redirects the user to the page.
Share
Allows the user to share the selected job with other user(s) or usergroup(s).
Job Monitoring
The user can search for a specific Job by using the Search Bar on the Job List.
By typing a name in the Search Bar all the existing jobs containing that word will be listed. E.g., By typing san all the existing Jobs with the word san in it get listed as displayed in the following image:
The Job List has been provided with a header bar containing the categories of the available jobs. The user can also customize the Job List by choosing available filter options in the header.
The Job List gets modified based on the selected category option from the header.
The Recent Runs status indication option provides an at-a-glance view of the five most recent job executions, allowing users to track performance in real-time. Get status display for each listed job—whether successful, failed, or in progress—is displayed, enabling users to assess system health quickly. By highlighting any issues immediately, this feature allows for proactive troubleshooting and faster response times, helping ensure seamless workflows and minimizing downtime.
The Recent Run categorizes the recently run Jobs into the following statuses:
Succeeded: The job was completed successfully without any errors.
Interrupted: The job was stopped before completion, either by a user action or an external factor.
Failed: The job encountered an error that prevented it from completing successfully.
Running: The job is currently in progress.
The Job Run statuses are displayed with different color codes.
Succeeded: Green
Failed: Red
Interrupted: Yellow
Running: Blue
No Run: Grey
Navigate to the List Jobs page.
The Recent Runs section will be visible for all the listed jobs indicating the statuses of the five recent most runs.
You may hover on a status icon to get more details under the tooltip.
Users can get a tooltip with additional details on the Job run status by hovering over the status icon in the Recent Run section.
Status: The status of the job run (Succeeded, Interrupted, Failed, Running).
Started At: The time when the job run was started.
Stopped At: This indicates when the job was stopped.
Completed At: The time when the job run was completed.
Read Using: There are three authentication methods available to connect with Azure in the Azure Blob Reader Component:
Shared Access Signature
Secret Key
Principal Secret
Provide the following details:
Shared Access Signature: This is a URI that grants restricted access rights to Azure Storage resources.
Account Name: Provide the Azure account name.
Container: Provide the container name from where the file is located and which has to be read.
Path type: There are options available under it:
Null: If Null is selected as the Path Type, the component will read the metadata of all the blobs from the given container. The user does not need to fill the Blob Name field in this option.
Directory Path: Enter the directory path to read the metadata of files located in the specified directory. For example: employee/joining_year=2010/department=BI/designation=Analyst/.
Blob Name: Specify the blob name to read the metadata from that particular blob.
Provide the following details:
Account Key: It is be used to authorize access to data in your storage account via Shared Key authorization.
Account Name: Provide the Azure account name.
Container: Provide the container name from where the file is located and which has to be read.
Path type: There are options available under it:
Null: If Null is selected as the Path Type, the component will read the metadata of all the blobs from the given container. The user does not need to fill the Blob Name field in this option.
Directory Path: Enter the directory to read the metadata of files located in the specified directory. For example: employee/joining_year=2010/department=BI/designation=Analyst/.
Blob Name: Specify the blob name to read the metadata from that particular blob.
Provide the following details:
Client ID: The client ID is the unique Application (client) ID assigned to your app by Azure AD when the app was registered.
Tenant ID: It is a globally unique identifier (GUID) that is different than your organization name or domain.
Client Secret: The client secret is the password of the service principal.
Account Name: Provide the Azure account name.
Container: Provide the container name from where the file is located and which has to be read.
Path type: There are options available under it:
Null: If Null is selected as the Path Type, the component will read the metadata of all the blobs from the given container. The user does not need to fill the Blob Name field in this option.
Directory Path: Enter the directory to read the metadata of files located in the specified directory. For example: employee/joining_year=2010/department=BI/designation=Analyst/.
Once the component runs successfully, it will send the following metadata to the output event:
Container: Name of the container where the blob is present.
Blob: Name of the blob present in the specified path.
blobLastModifiedDateAndTime: Date and time when the blob was last modified.
blobLength: Size of the blob.
Helps to search component across Pipelines through the Object Browser panel.
Allows to push & pull the pipeline to VCS or GIT.
Opens the Pipeline in Full screen
/
Opens or closes the log panel
/
Opens or closes Event panel
/
Activates or deactivates the Pipeline
Updates the Pipeline
Redirects to the Failure Analysis page
Redirects to the Pipeline Monitoring page
Deletes the Pipeline and moves it to Trash folder.
Redirects to the Pipeline List page.
Redirects to the Settings page.
Redirects to Pipeline Component Configuration page.
Redirects user to failure alert history window.
Format the pipeline components in arranged manner.
Zoom in the pipeline workspace.
Zoom out the pipeline workspace.


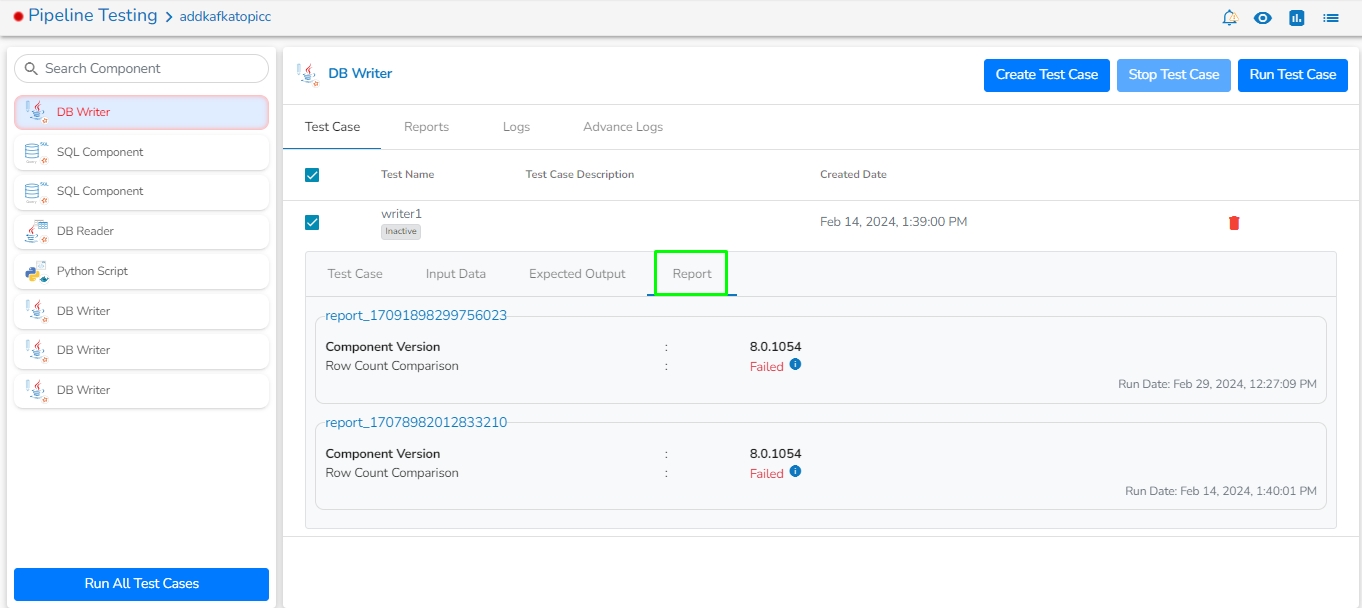
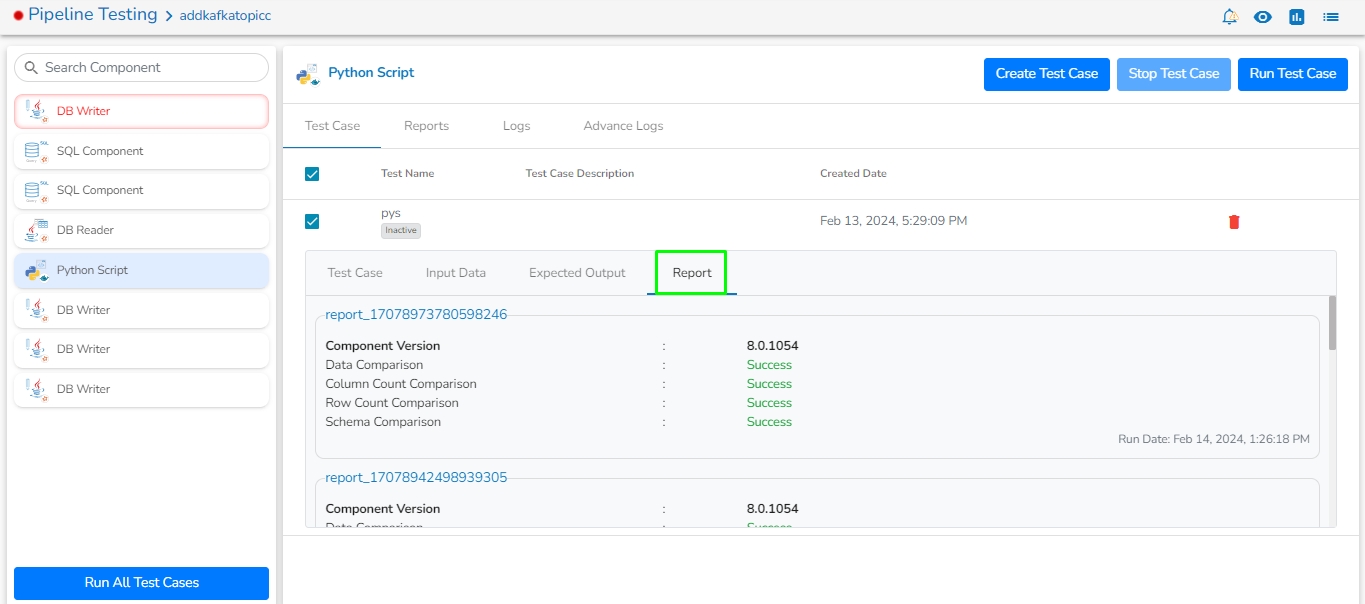
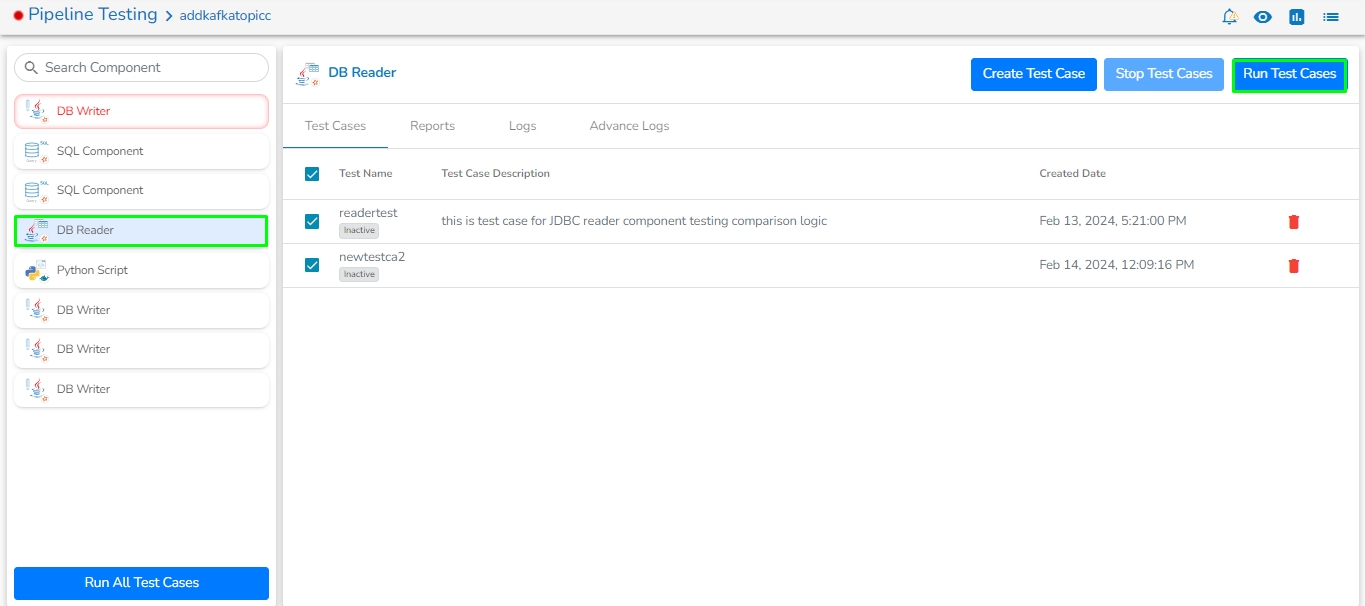
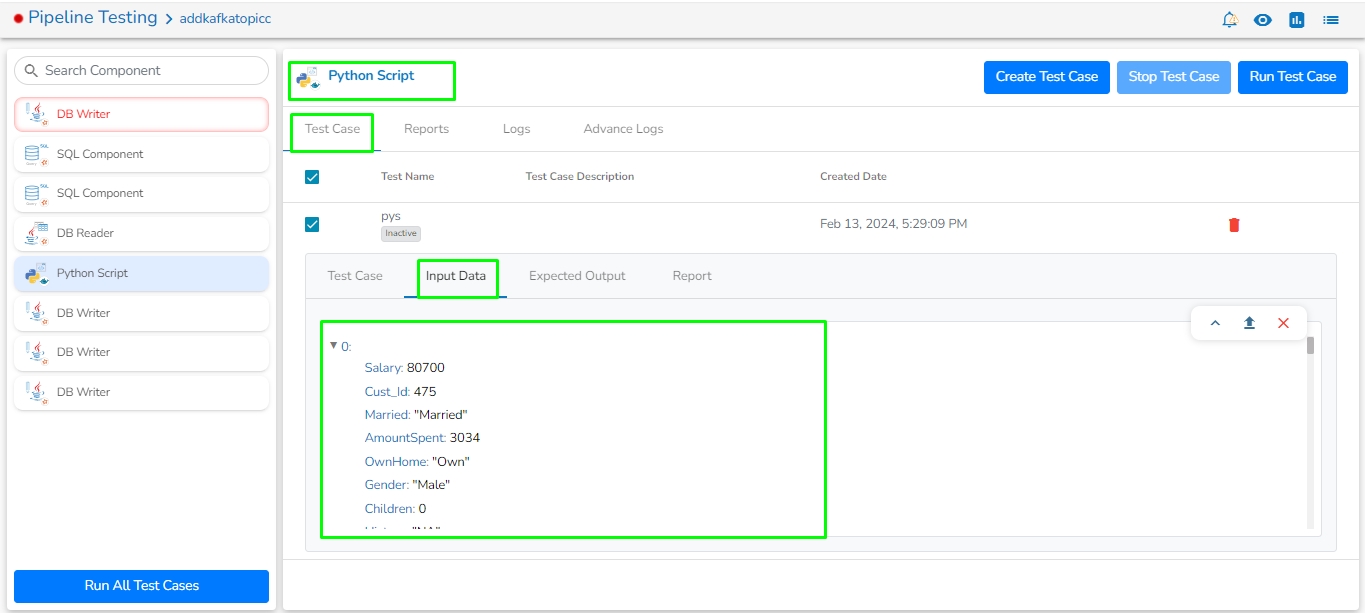
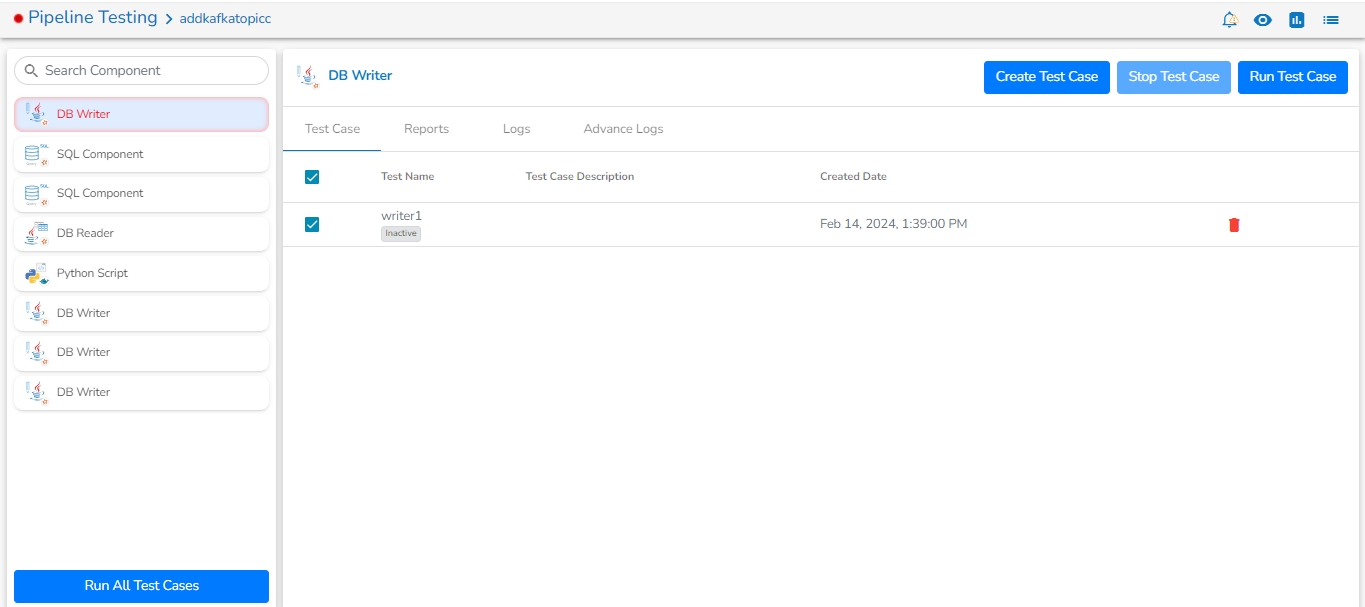
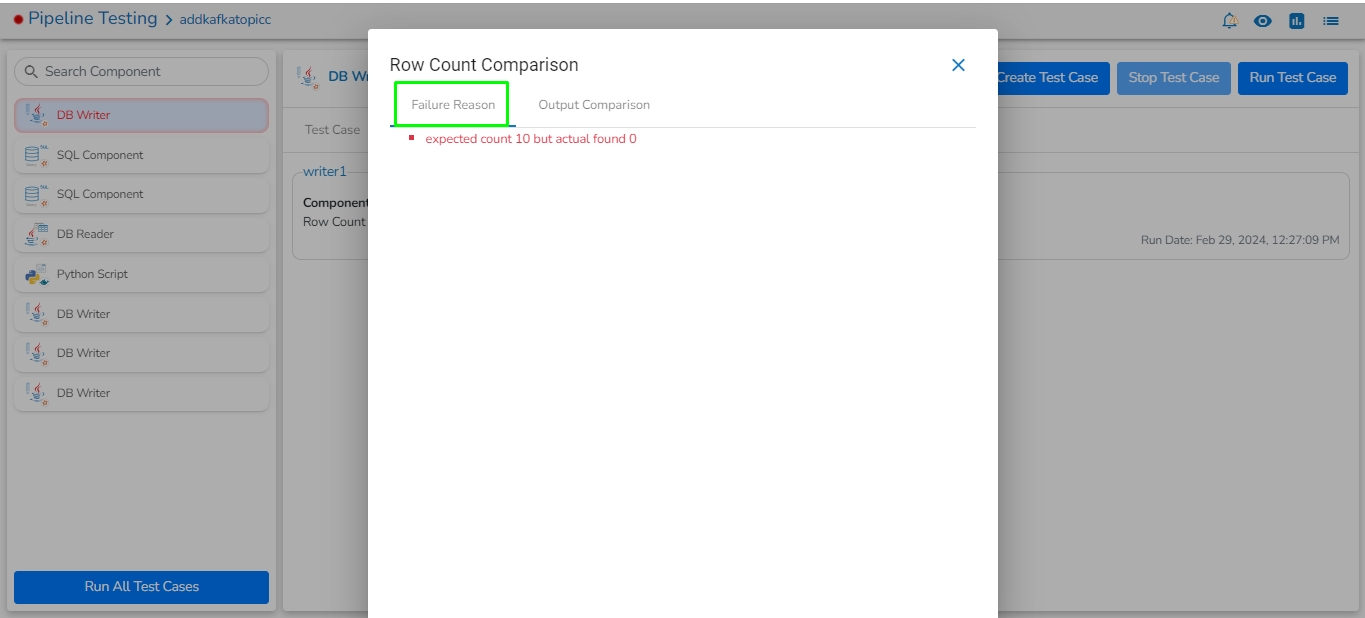
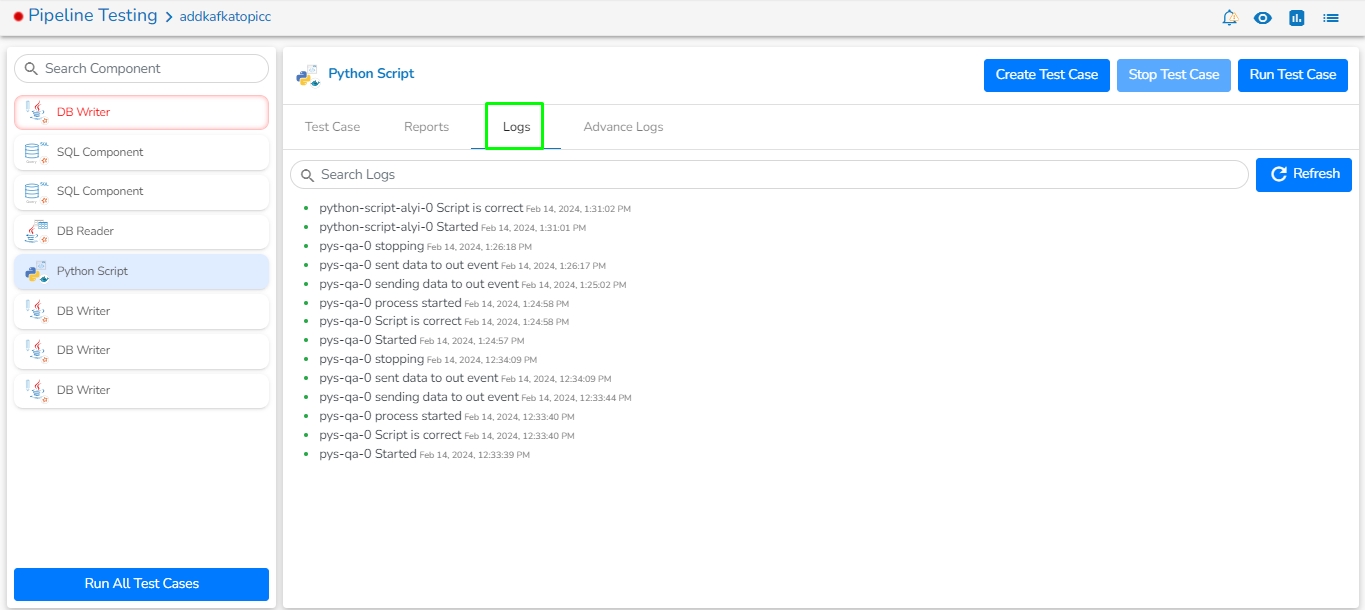
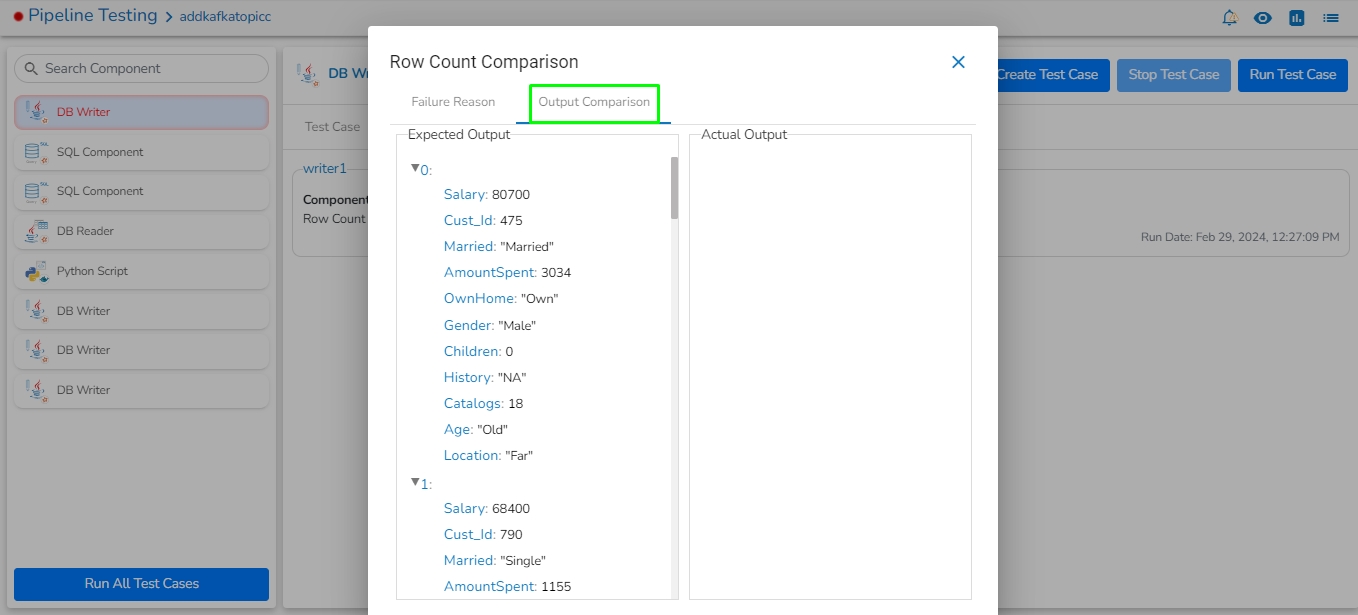
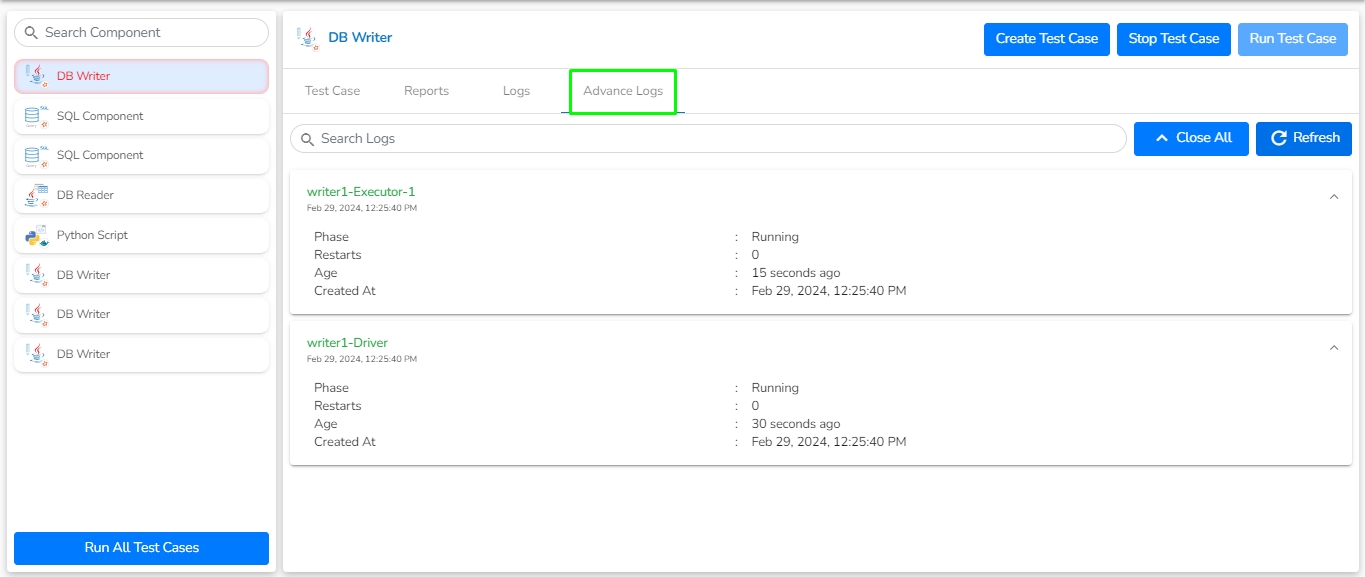
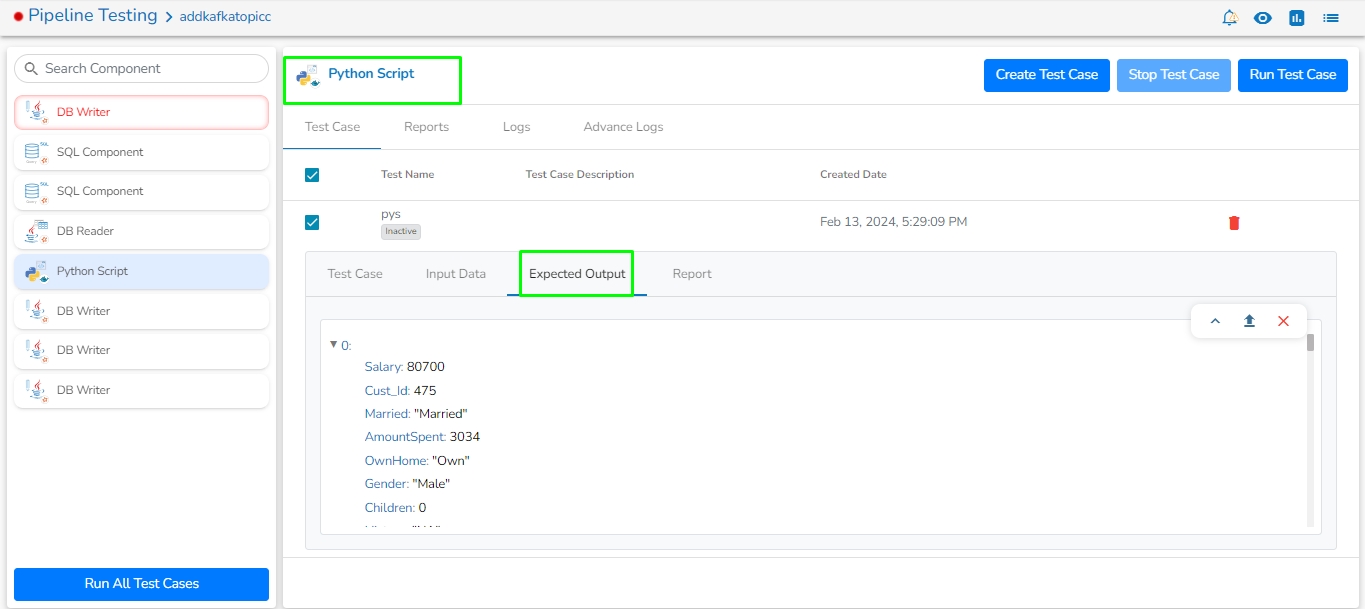
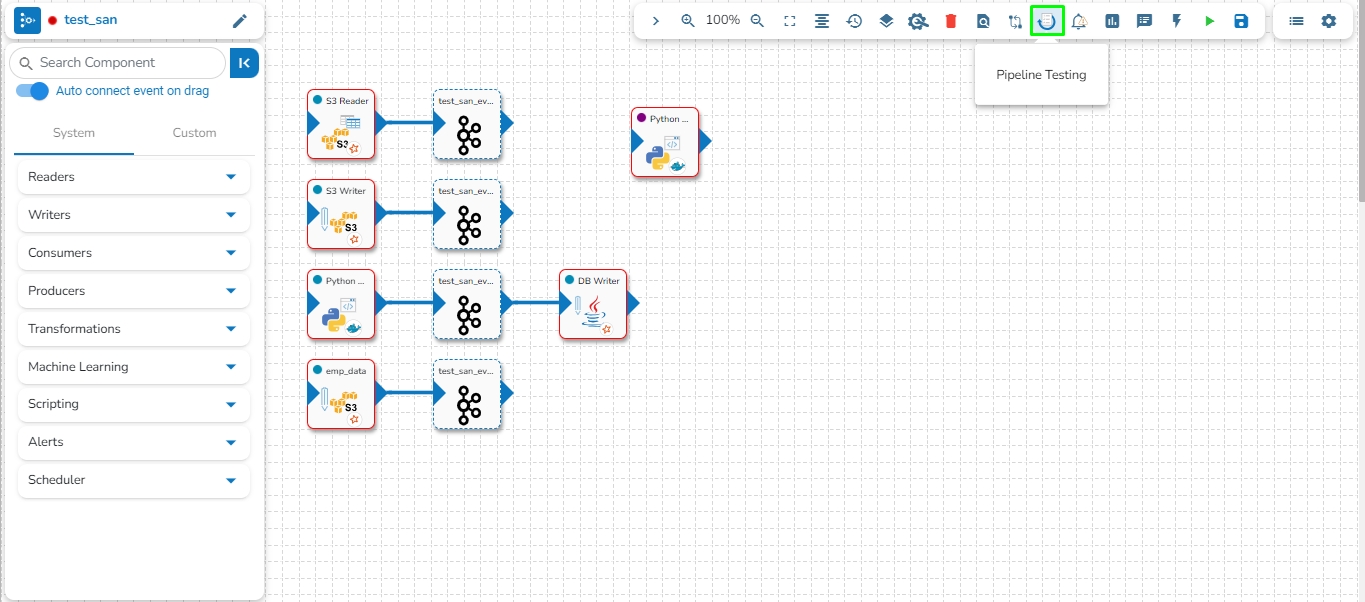
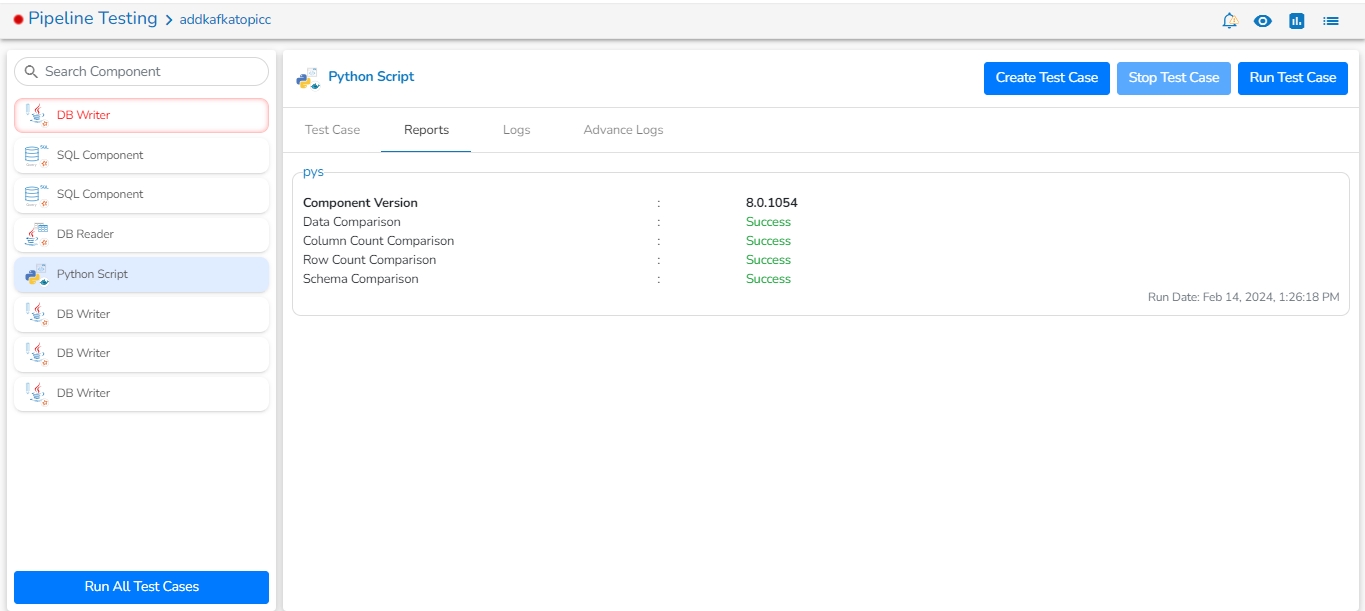
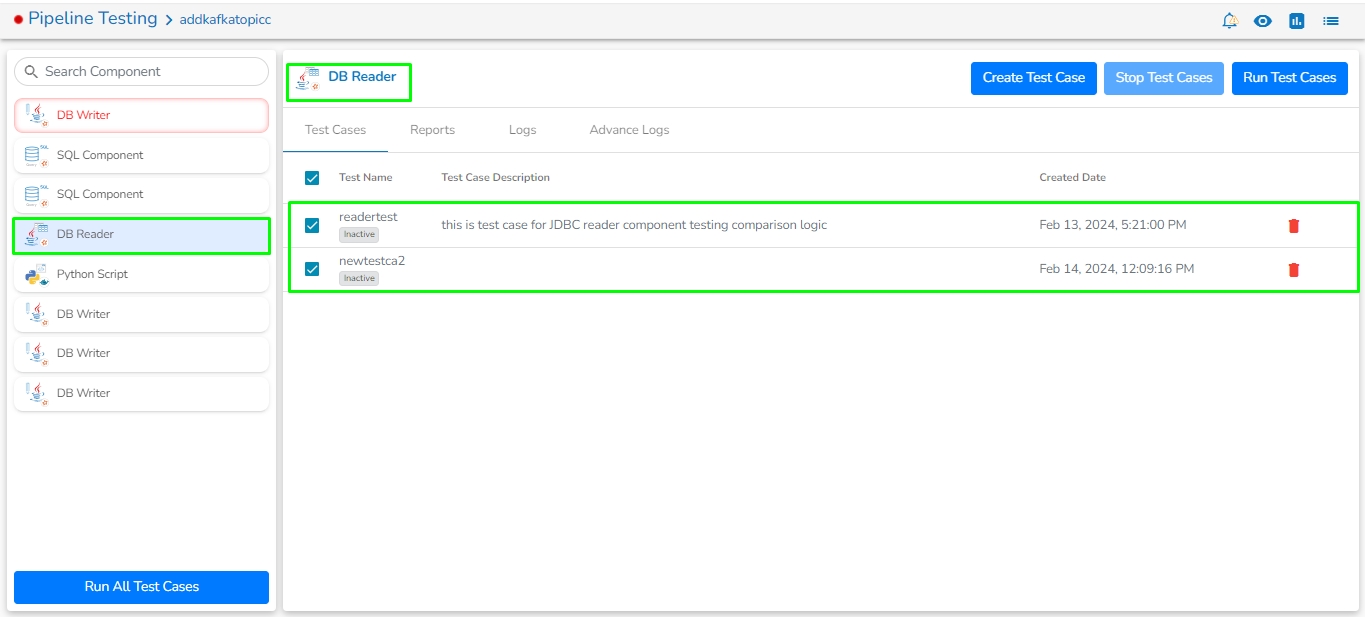


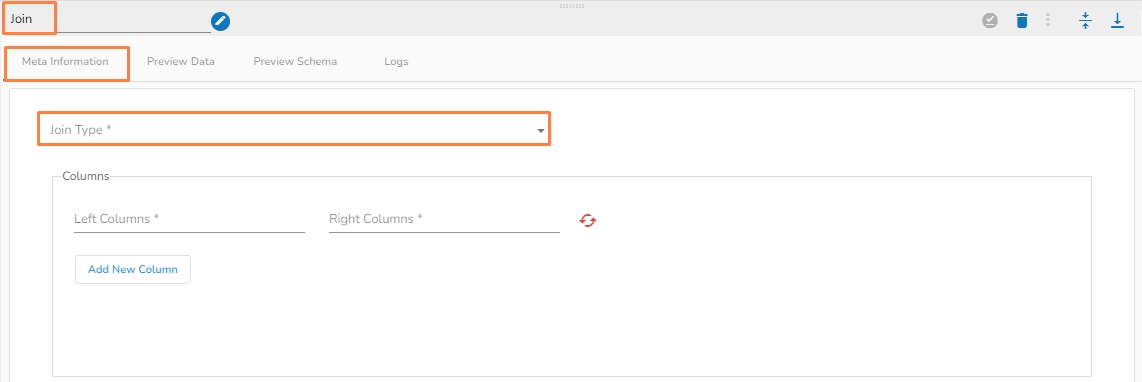


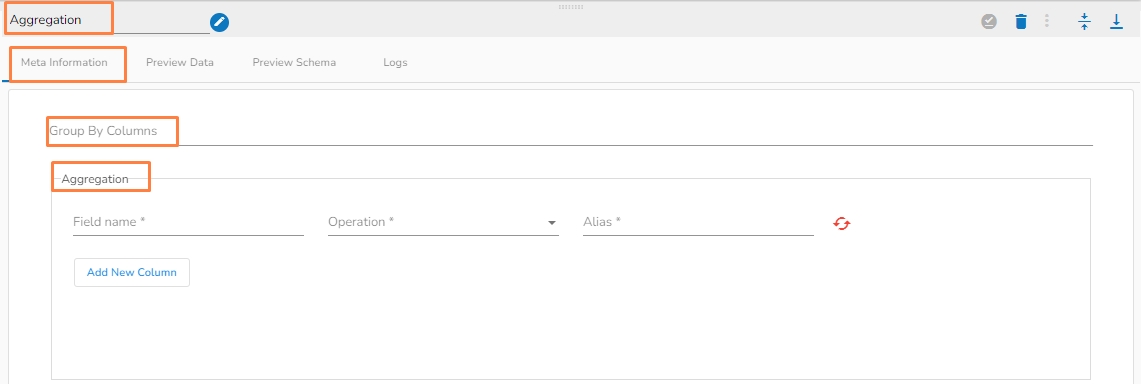

This Page explains How we can monitor the Pipelines.
The user can monitor a pipeline together with all the components associated with the same by using the Pipeline Monitoring icon. The user gets information about Pipeline components, Status, Types, Last Activated (Date and Time), Last Deactivated (Date and Time), Total Allocated and Consumed CPU%, Total allocated and consumed memory, Number of Records, and Component logs all displayed on the same page.
Go through the below-given video to get a basic idea on the pipeline monitoring functionality.
Navigate to the Pipeline List page.
Click the Monitor icon.
Or
Navigate to the Pipeline Workflow Editor page.
Click the Pipeline Monitoring icon on the Header panel.
The Pipeline Monitoring page opens displaying the details of the selected pipeline.
The Pipeline Monitoring page displays the following information for the selected Job:
Pipeline: Name of the pipeline.
Once the user clicks on any instance, the page will expand to show the graphical representation of CPU usage, Memory usage and Records Per Process Execution over the given interval of time. For reference, please see the images given below:
The Monitor tab opens by default on the monitoring page.
If there are multiple instances for a single component, click on the drop-down icon.
Details for each instance will be displayed.
Monitoring page for Docker component in Real-Time
Monitoring page for Docker component in Batch:
Monitoring page for Spark Component:
Monitoring page for Spark Component - Driver:
Monitoring page for Spark Component- Executer:
If memory allocated to the component is less than required, then it will be displayed in red color.
Open the Data Metrics tab from the pipeline monitoring page.
It shows the Produced, Consumed, and Failed records for each component in the pipeline over the given interval of time range in the form of bar charts where each bar contains the data of the given time interval (by default 30 mins).
Color terminology on the data metrics page:
Blue: Indicates the number of records successfully produced to the out event by the component.
The user can see the data metrics for all the components by enabling the Show all components on the Data Metrics page. Please refer the below given image for the reference.
Filter: The user can apply their custom filter using the Filter tab on the Data Metrics page.
Time Range & Interval:
Enter the Start date & End date for filtering the data.
Custom interval: Enter the time in minutes. Each bar in the bar chart on the data metrics page will contain data for this custom interval.
Clear: It will clear all the monitoring and data metrics logs for all the components in the pipeline.
Users can visualize the loaded data in the form of charts by clicking on the green color icon.
Please go through the given walk-through for the reference.
Once the user clicks on the green color icon, the following page will be opened:
Produced v/s Consumed
This chart will display the number of records produced to the out event compared to the number of records taken from the previous event over the given time window.
Min v/s Max v/s Avg Elapsed Time
This chart displays the minimum, maximum, and average time taken (in milliseconds) to process a record over the given time window.
Min Elapsed Time: The minimum time taken (in milliseconds) to process a record and send it to the out event.
Max Elapsed Time: The maximum time taken (in milliseconds) to process a record and send it to the out event.
Average Elapsed Time: The average time taken (in milliseconds) to process a record and send it to the out event.
Failed Records
This chart will display the number of failed records during processing over the given time window for the selected component.
Consumed v/s Failed Records
This chart will display the ratio of records failed during processing by the component to the total number of records consumed by the component over the given time window.
The user can also analyze the failure for the selected component from the Data Metrics page by clicking on the Analyze Failure option. Please see the below given image for reference.
Clicking on the Analyze Failure option will redirect the user to the page.
In this tab, the user can see the pod logs of every component in the pipeline. The user can access this tab from the monitoring page.
The user can find the following options on the System Logs tab:
Selected Pod: The user can select the Pod for which they want to see the logs.
Date Filter: The user can apply the date filter to see the logs accordingly.
Refresh Logs: The user can refresh the logs for the selected pod.
Download Logs: The user can download the logs for the selected pod.

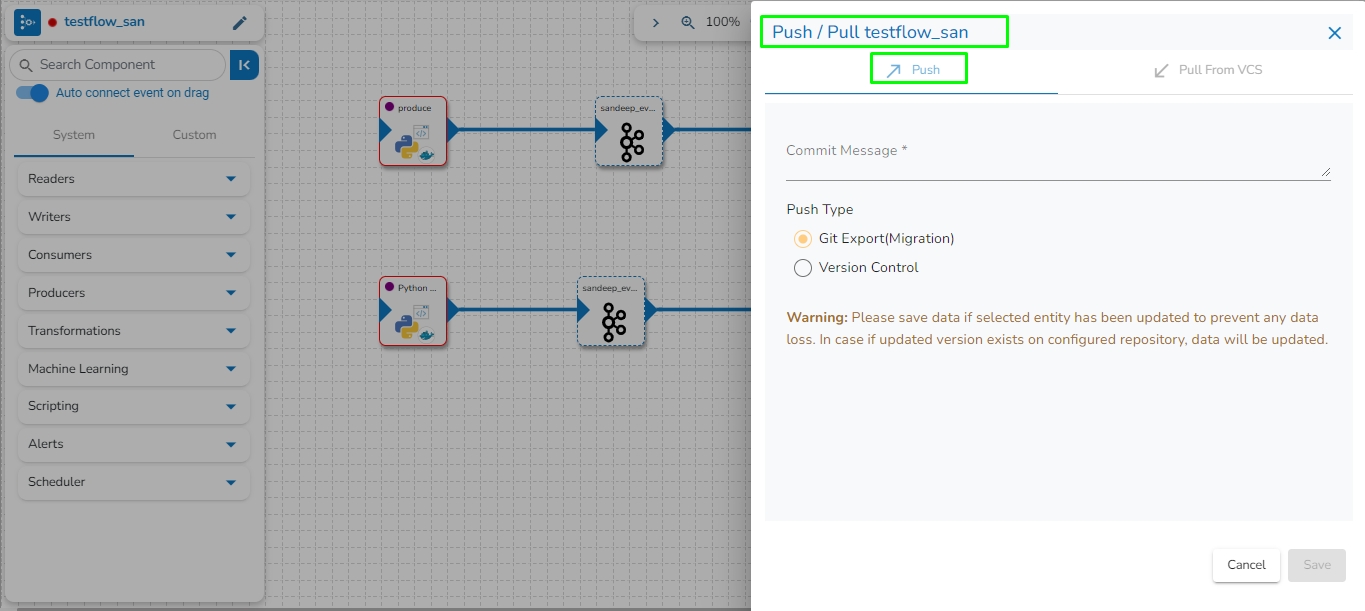


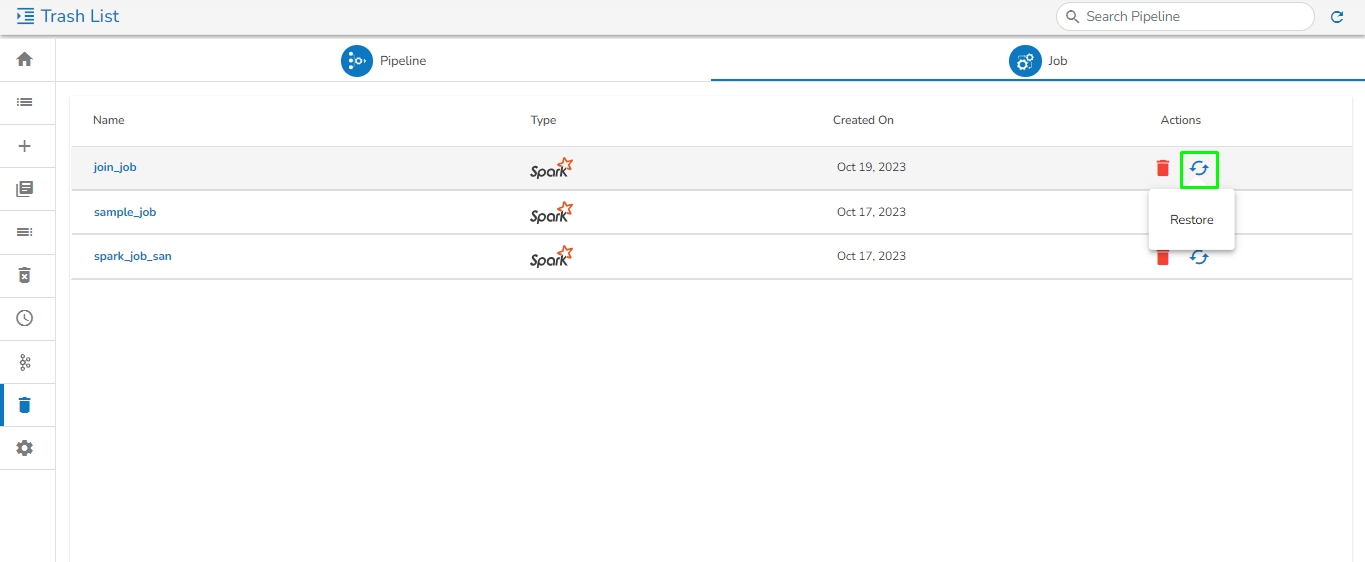
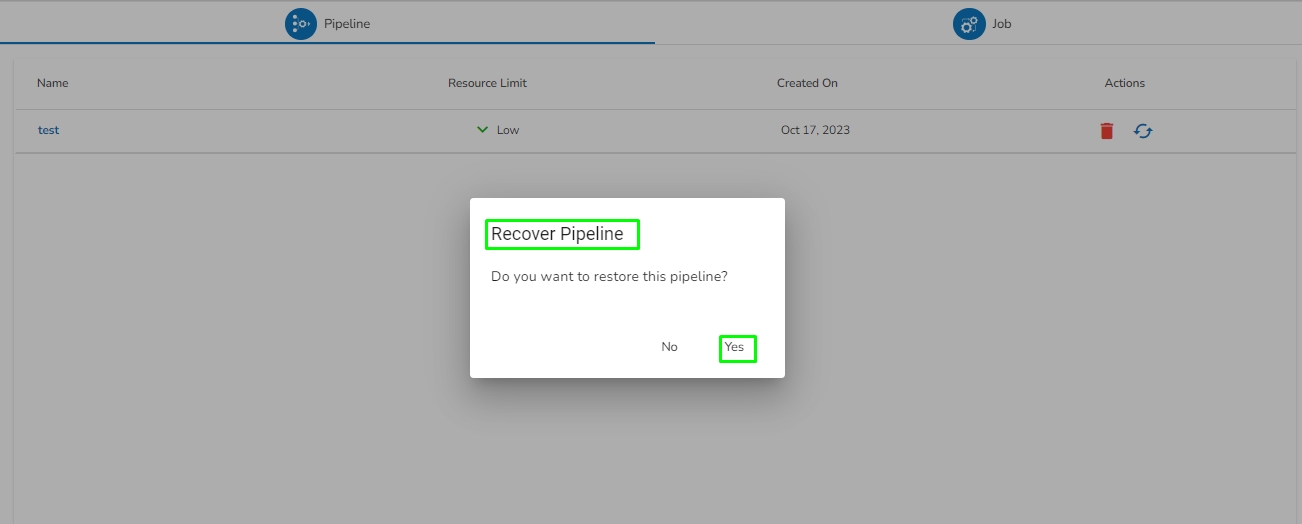
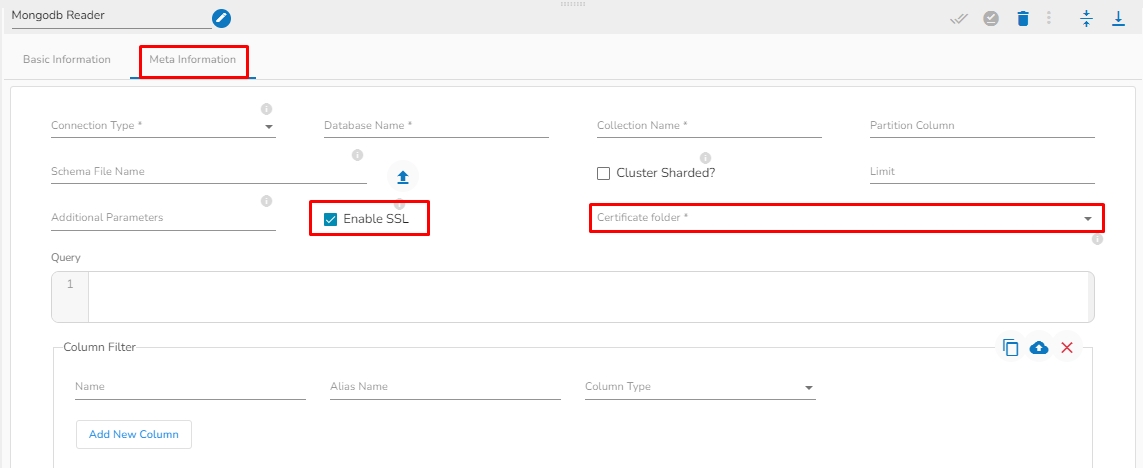
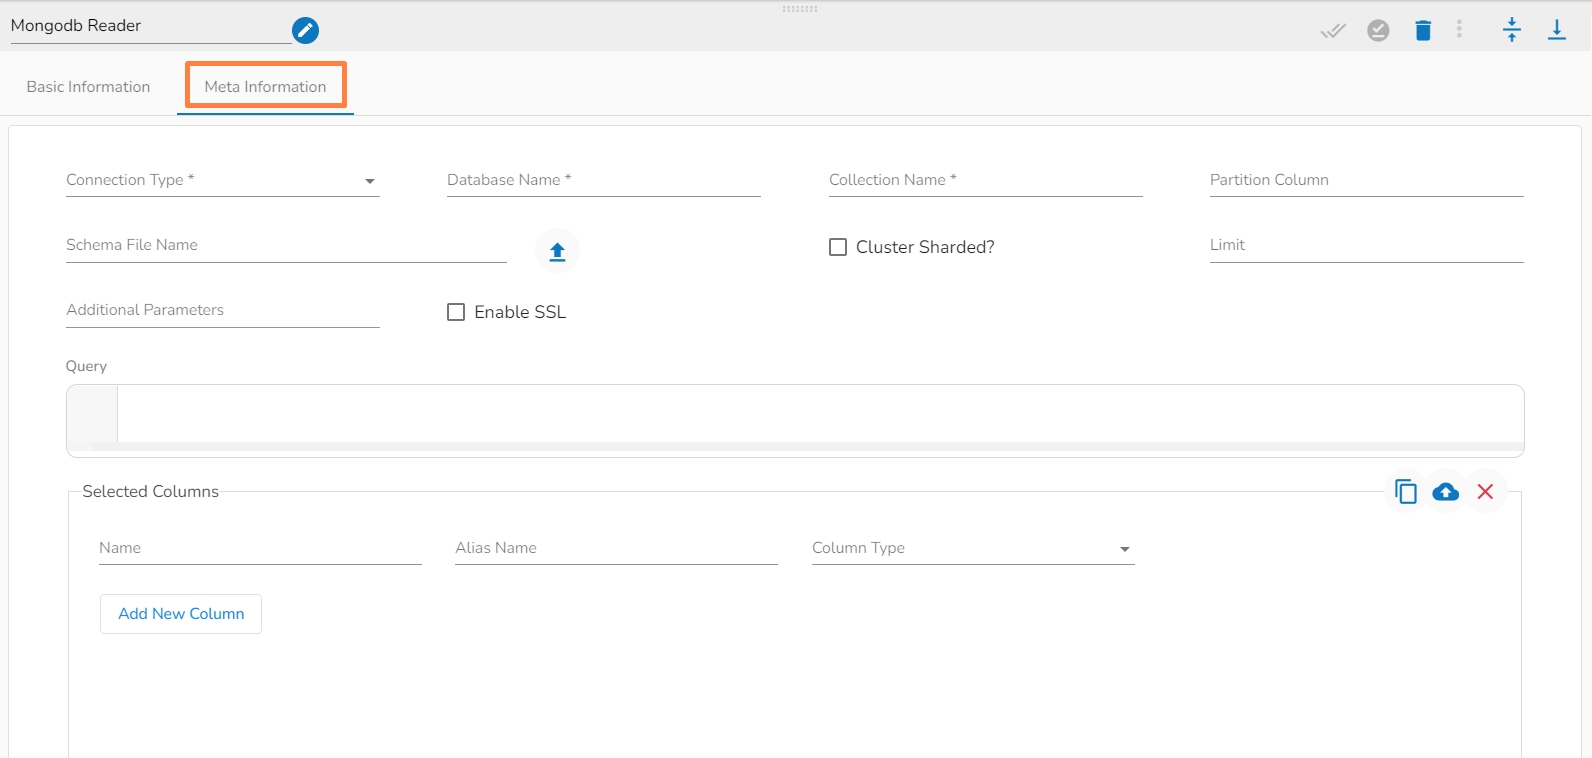
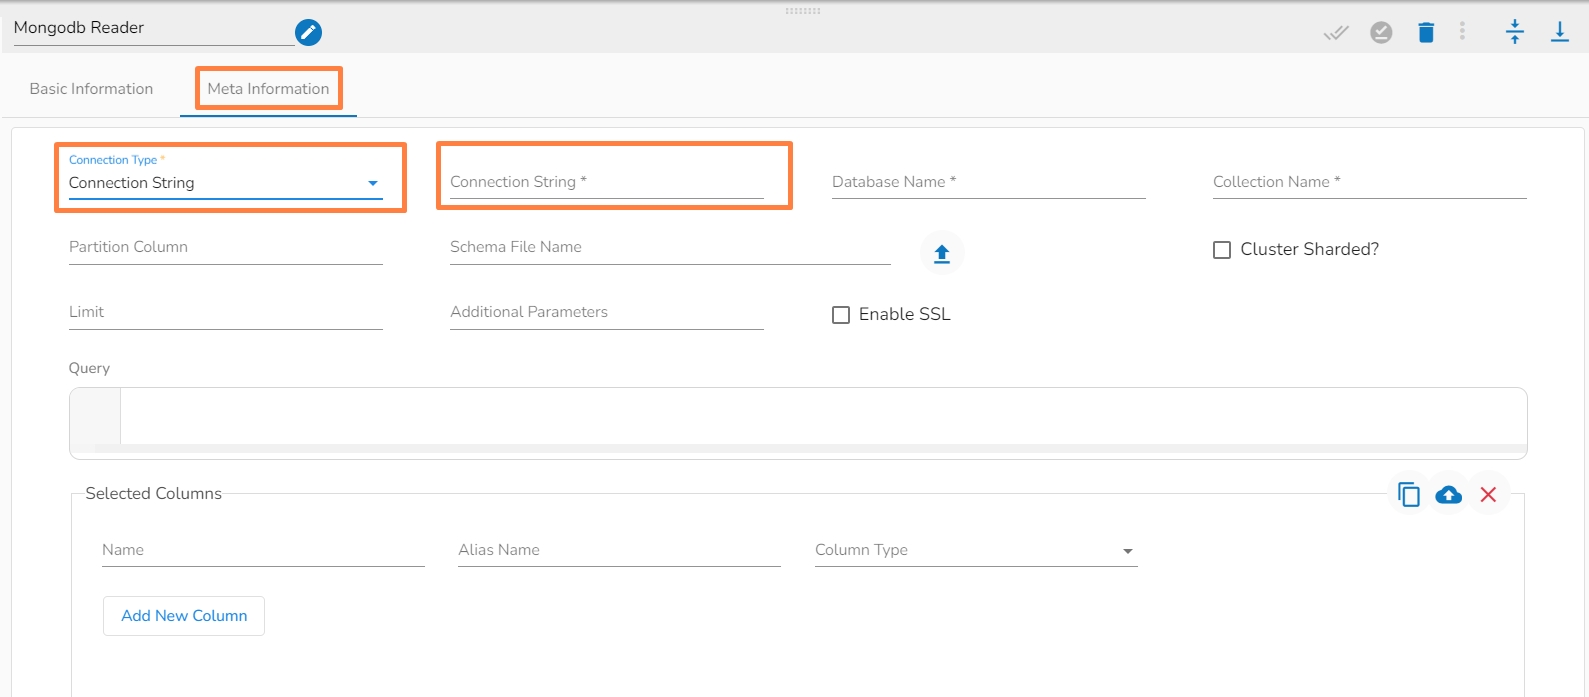
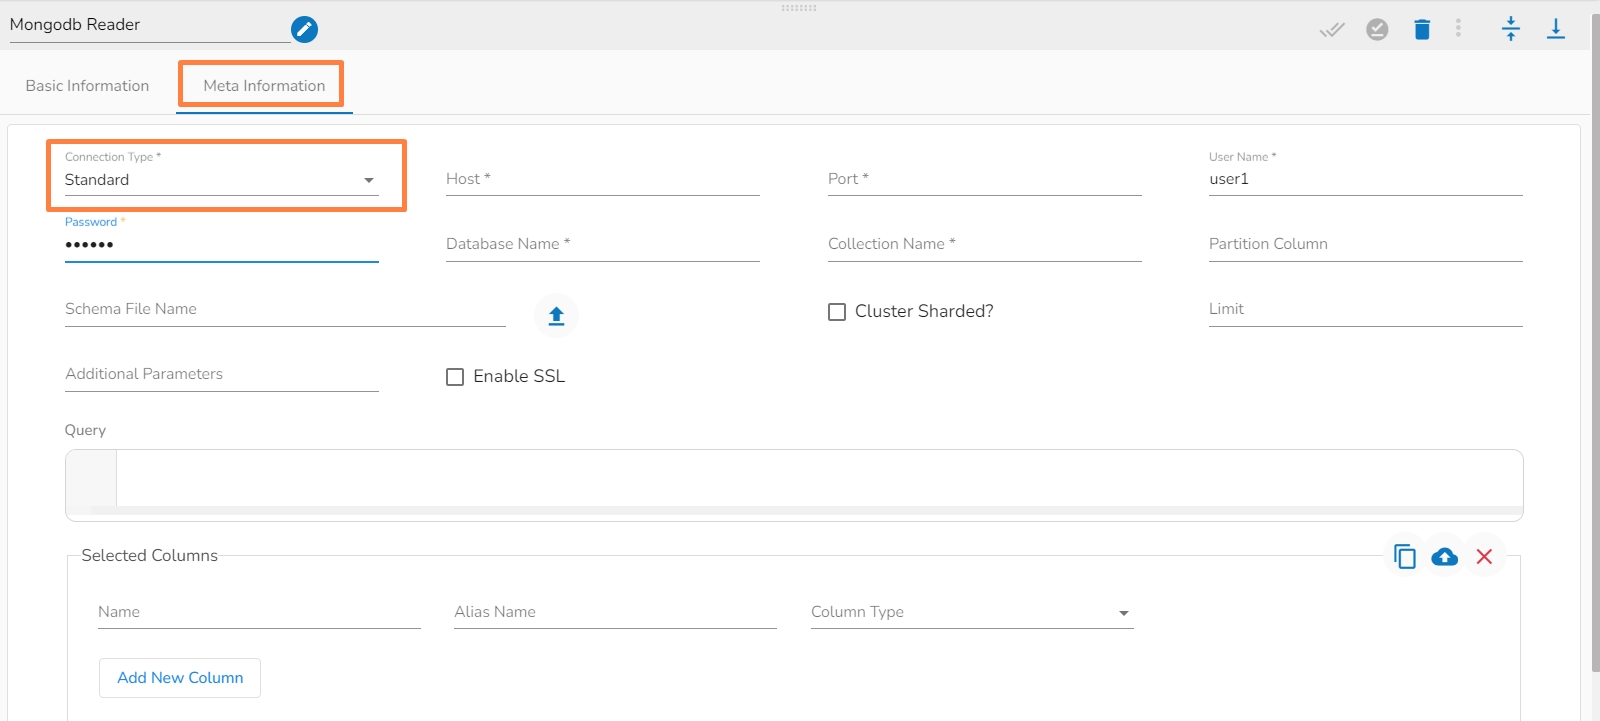
The Job Editor Page provides the user with all the necessary options and components to add a task and eventually create a Job workflow.
Once the Job gets saved in the Job list, the user can add a Task to the canvas. The user can drag the required tasks to the canvas and configure it to create a Job workflow or dataflow.
The Job Editor appears displaying the Task Pallet containing various components mentioned as Tasks.
bi_testing.d1.find({ "$or": [ { "AmountSpent": "10255" } , { "Age": "Old" } ] })// Some codedb.collection_name.aggregate([{'$match': {'Goal1Adjective': 'High'}}])
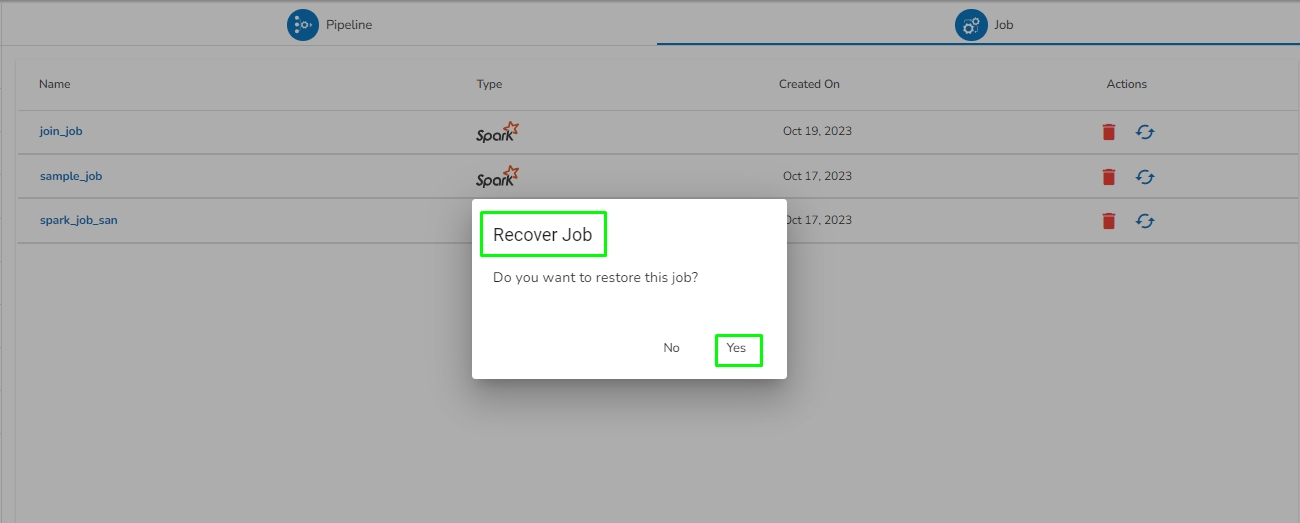
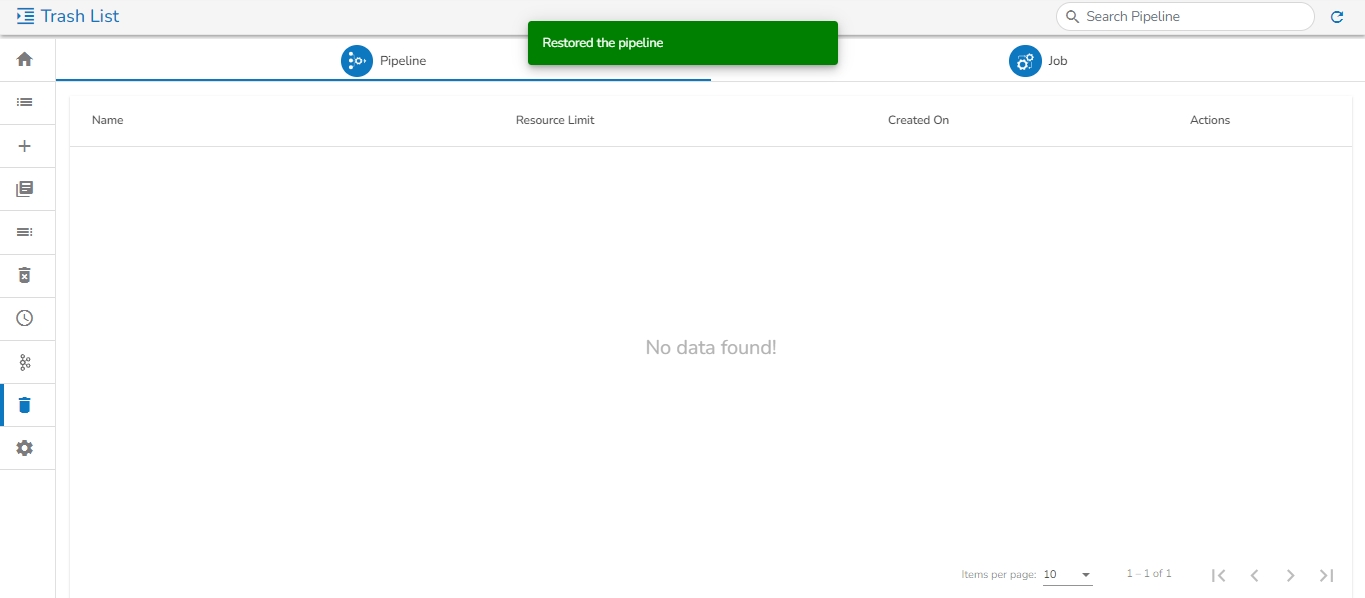
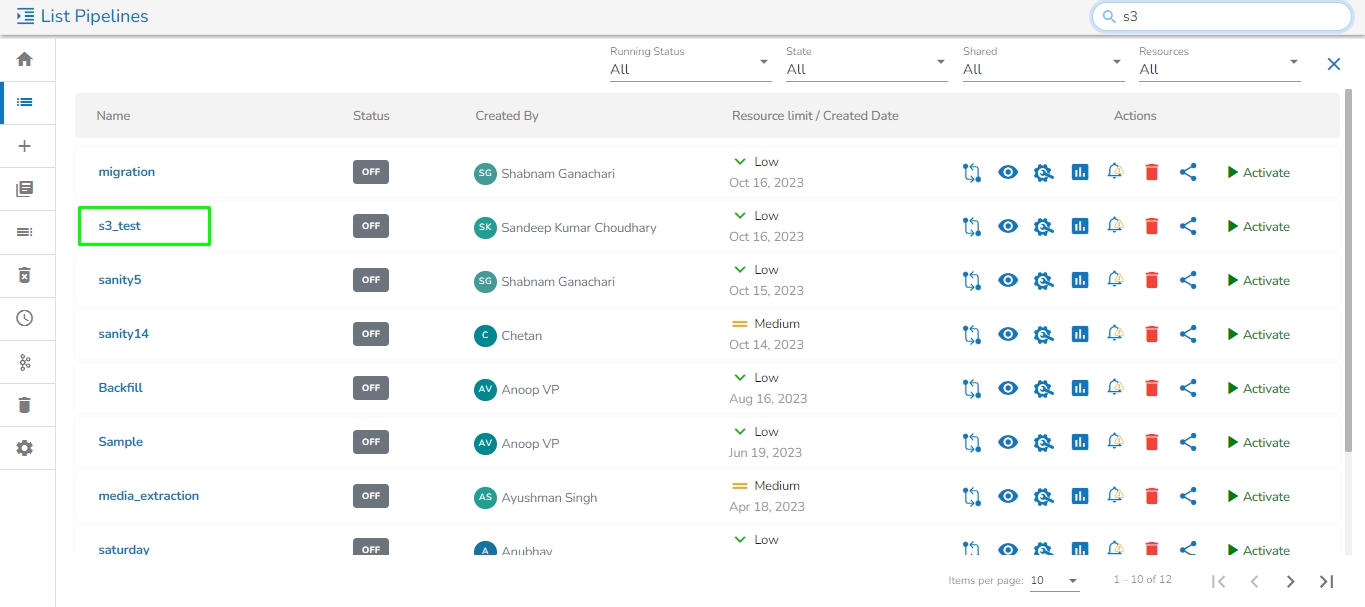
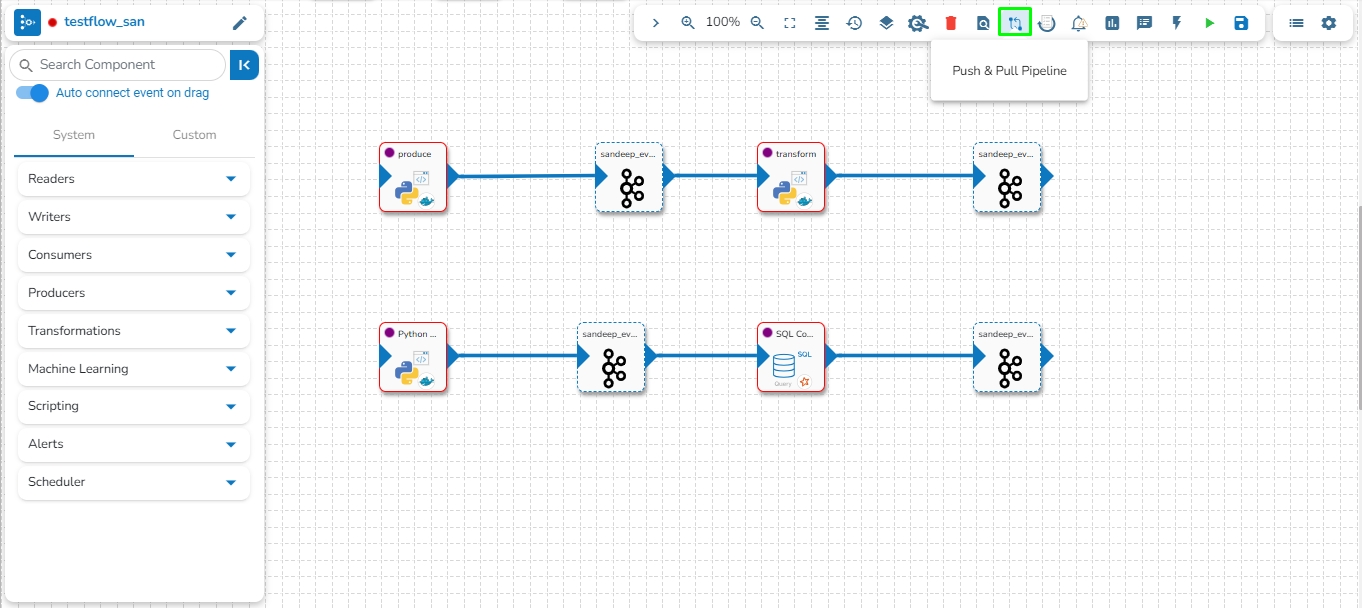
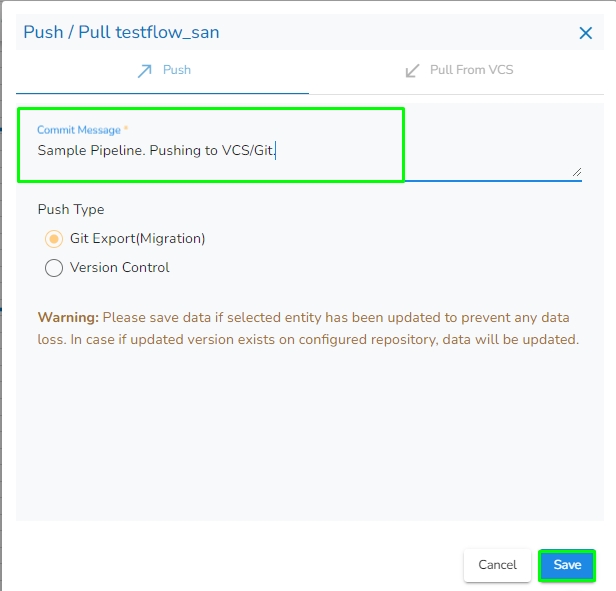
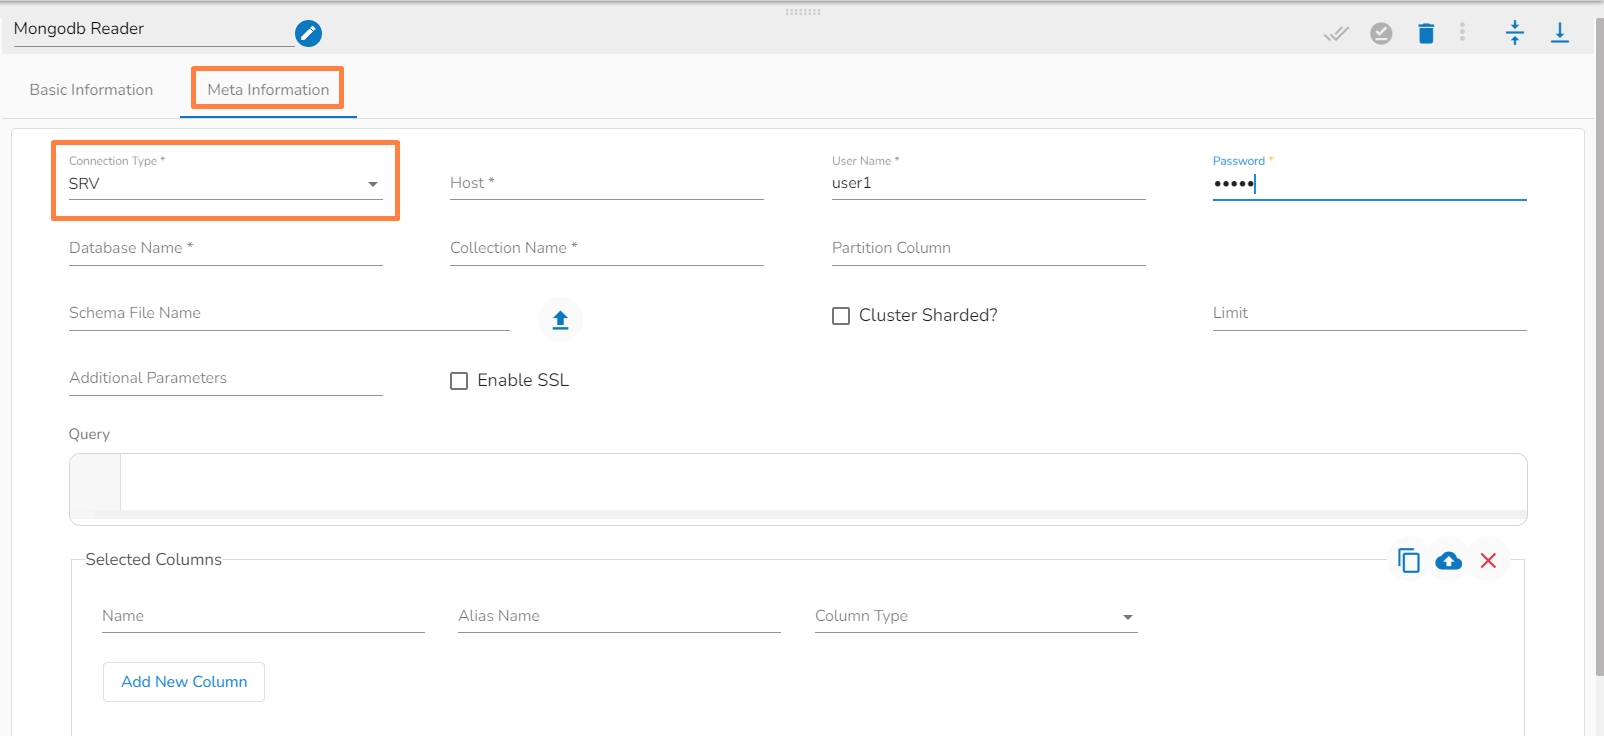
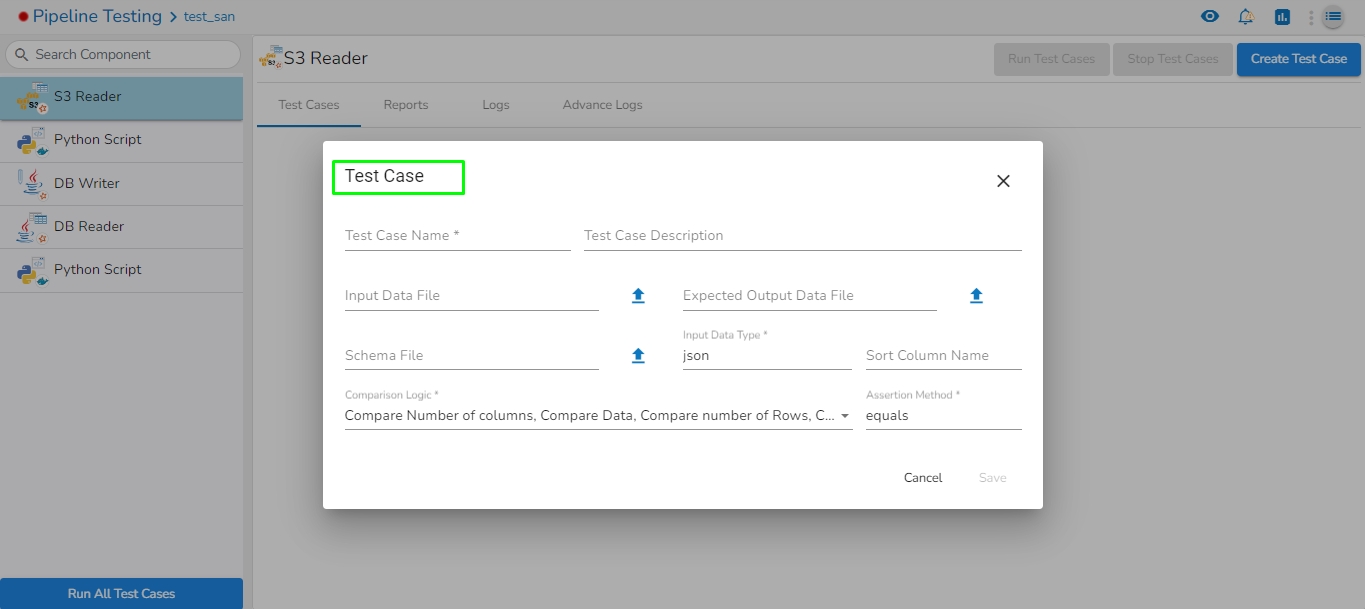
Click the Yes option to apply the clear history.
The job history gets deleted.
You may open the History tab for the same job. It will be deleted.
Redirects user to the Job monitoring page.
Edit
This enables the user to edit any information about the job. This option will be disabled when the job is active.
Delete
Allows the user to delete the job. The deleted job will be moved to Trash.


Copy and Use SAS Token: Copy the generated SAS token. Use this token to securely access your Blob Storage resources in your code.
Generate New Client Secret (Principal Secret):
Under "Client secrets," click on "New client secret."
Enter a description, select the expiry duration, and click "Add" to generate the new client secret.
Copy the generated client secret immediately as it will be hidden afterward.
Blob Name: Specify the blob name to read the metadata from that particular blob.
Status: Running status of the Job. 'True' indicates the Job is active, while 'False' indicates inactivity.
Last Activated: Date and time when the job was last activated.
Last Deactivated: Date and time when the pipeline was last deactivated.
Total Allocated CPU: Total allocated CPU in cores.
Total Allocated Memory: Total allocated memory in MB.
Total Consumed CPU: Total consumed CPU by the pipeline in cores.
Total Consumed Memory: Total consumed memory by the pipeline in MB.
Component Name: Name of the component which is used in pipeline.
Running: The running status of the component, displayed as 'UP' if the component is running, otherwise 'OFF'.
Type: Invocation type of component. It may be either Real Time or Batch.
Instances: Number of instances used in the component.
Last Processed Size: Size of the batch (in MB) that was last processed.
Last Processed Count: Number of Processed records in last batch.
Total Number of Records: Total number of records processed by the component.
Last Processed Time: Last processed time of the instance.
Host Name: Name of the instance of the selected component.
Min CPU Usage: Minimum CPU usage in cores by the instance.
Max CPU Usage: Maximum CPU usage in cores by the instance.
Min Memory Usage: Minimum memory usage in MB by the instance.
Max Memory Usage: Maximum memory usage in MB by the instance.
CPU Utilization: Total CPU utilization in cores by the instance.
Memory Utilization: Total memory utilization in MB by the instance.
There will be three tabs in the monitoring page.
Monitor: In this tab, it will display information such as the resources allocated, minimum/maximum resource consumption, instances provisioned, the number of records processed by each component, and their running status.
Data Metrics: Data Metrics will show the number of consumed records, processed records, failed records, and the corresponding failed percentage over a selected time window
System Logs: In this tab, the user can see the pod logs of every component in the pipeline.
Green: Indicates the number of records consumed from the previous connected Kafka event by the component.
Red: Indicates the number of records failed by the component while processing it.
Once hovering over a specific bar in the bar chart on the data metrics page, the following information will be displayed:
Start: Window start time.
End: Window end time.
Processed: Number of processed records.
Produced: Number of records generated after processing.
Consumed: Number of records consumed from the previous event.
Failed: Number of records that failed during processing.
Failed Percentage: Percentage of failed records, calculated as the ratio between Failed and Processed data.
The user can also filter the data from the last 5 minutes to the last 2 days directly from the filter tab.
The Task Pallet is situated on the left side of the User Interface. It has a Task tab listing the various tasks.
The tasks are displayed in the below-given image:
Navigate to the Job List page.
It will list all the jobs and display the Job type if it is Spark Job or PySpark Job in the type column.
Select a Job from the displayed list.
Click the View icon for the Job.
The Job Editor opens for the selected Job.
Drag and drop the new required task, make changes in the existing task’s meta information, or change the task configuration as the requirement. (E.g., the DB Reader is dragged to the workspace in the below-given image):
Click on the dragged task icon.
The task-specific fields open asking the meta-information about the dragged component.
Open the Meta Information tab and configure the required information for the dragged component.
Click the given icon to validate the connection.
Click the Save Task in Storage icon.
A notification message appears.
Click the Activate Job icon to activate the job(It appears only after the newly created job gets successfully updated).
A dialog window opens to confirm the action of job activation.
Click the YES option to activate the job.
A success message appears confirming the activation of the job.
Once the job is activated, the user can see their job details while running the job by clicking on the View icon; the edit option for the job will be replaced by the View icon when the job is activated.
The Status for the Job gets changed on the job List page when they are running in the Development mode or it is activated.
Users can get a sample of the task data under the Preview Data tab provided for the tasks in the Job Workflows.
Navigate to the Job Editor page for a selected job.
Open a task from where you want to preview records.
Click the Preview Data tab to view the content.
Users can drag and drop column separators to adjust columns' width, allowing personalized data view.
This feature helps accommodate various data lengths and user preferences.
The event data is displayed in a structured table format.
The table supports sorting and filtering to enhance data usability. The previewed data can be filtered based on the Latest, Beginning, and Timestamp options.
The Timestamp filter option redirects the user to select a timestamp from the Time Range window. The user can select a start and end date or choose from the available time ranges to apply and get a data preview.
The Toggle Log Panel displays the Logs and Advanced Logs tabs for the Job Workflows.
Navigate to the Job Editor page.
Click the Toggle Log Panel icon on the header.
A panel Toggles displaying the collective logs of the job under the Logs tab.
Select the Job Status tab to display the pod status of the complete Job.
Navigate to the Job Editor page.
The Job Version update button will display a red dot indicating that new updates are available for the selected job.
The Confirm dialog box appears.
Click the YES option.
A notification message appears stating that the version is upgraded.
After the job is upgraded, the Upgrade Job Version button gets disabled. It will display that the job is up to date and no updates are available.
Job Version details
Displays the latest versions for the Jobs upgrade.
Displays Jobs logs and Job Status tab under Log panel.
Redirects to the Job Monitoring page
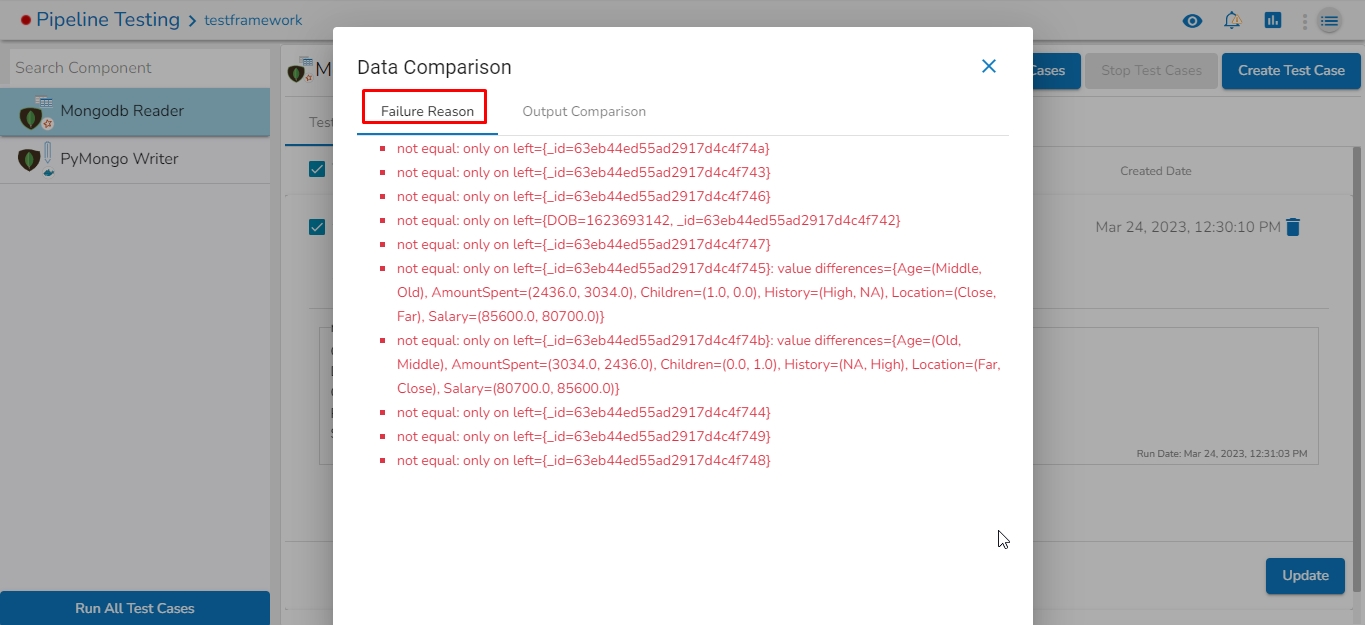
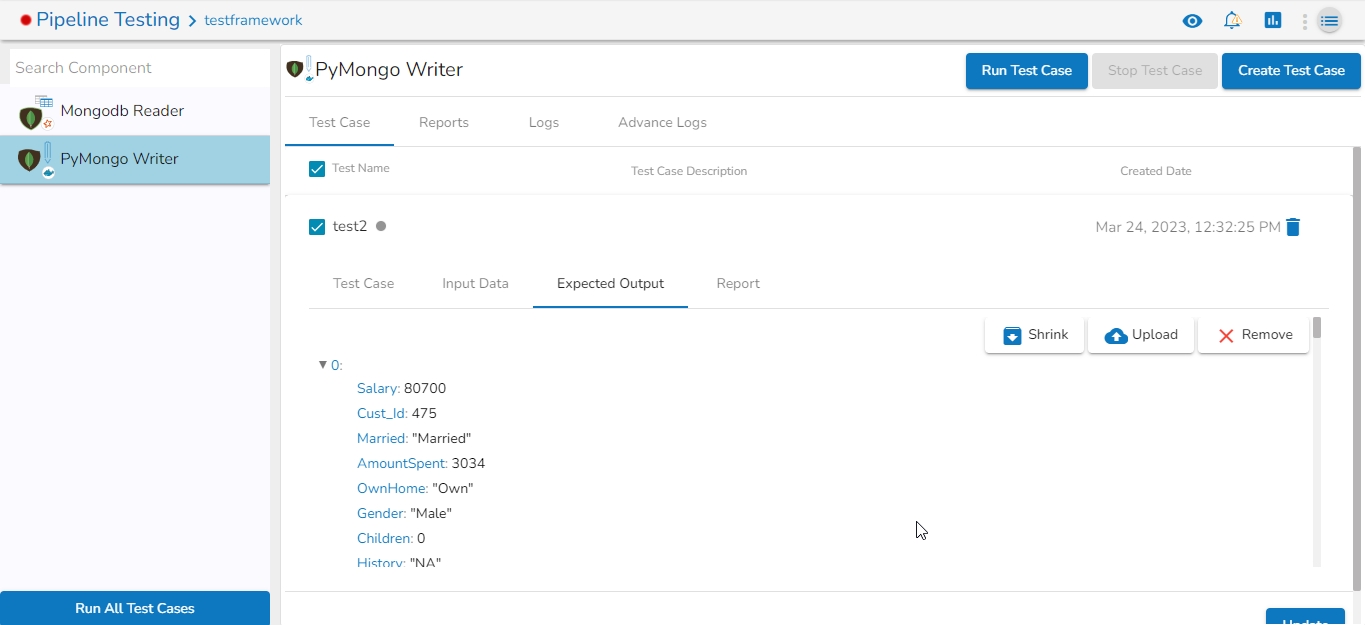
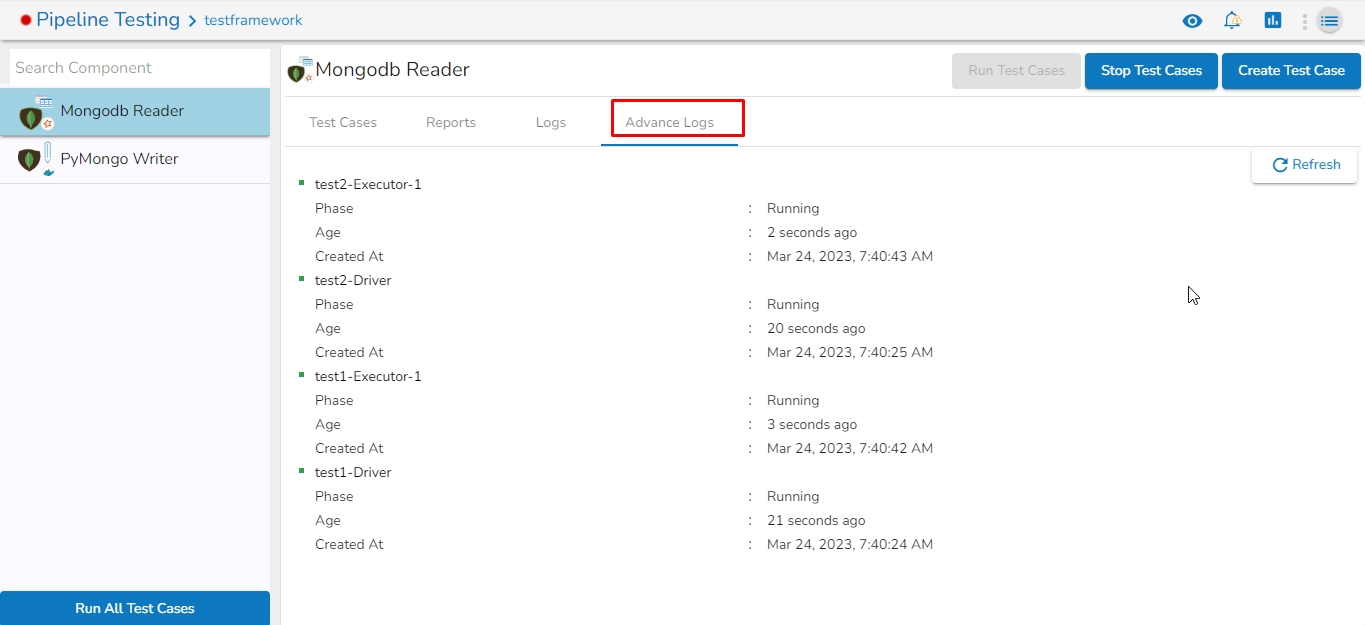


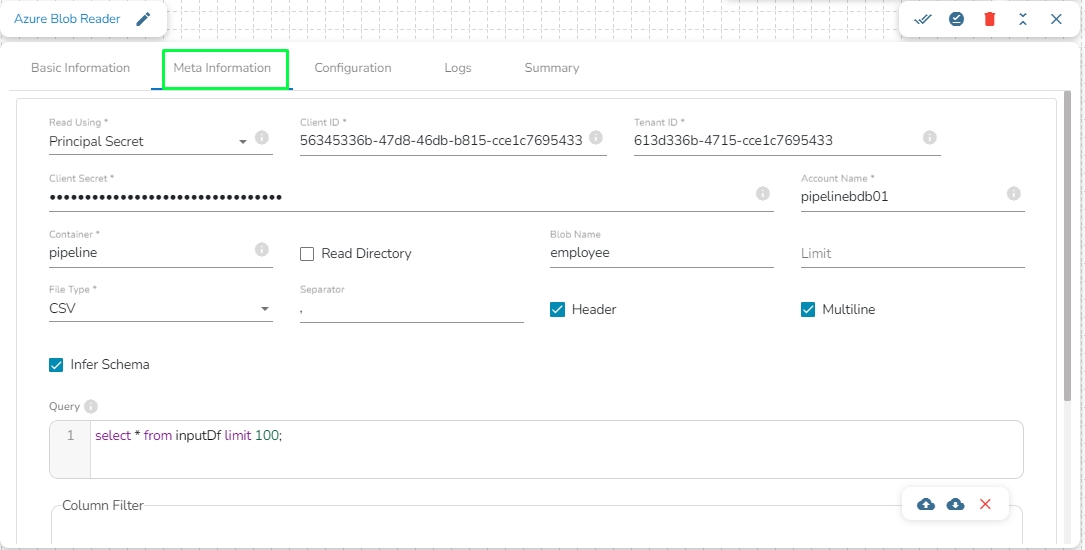


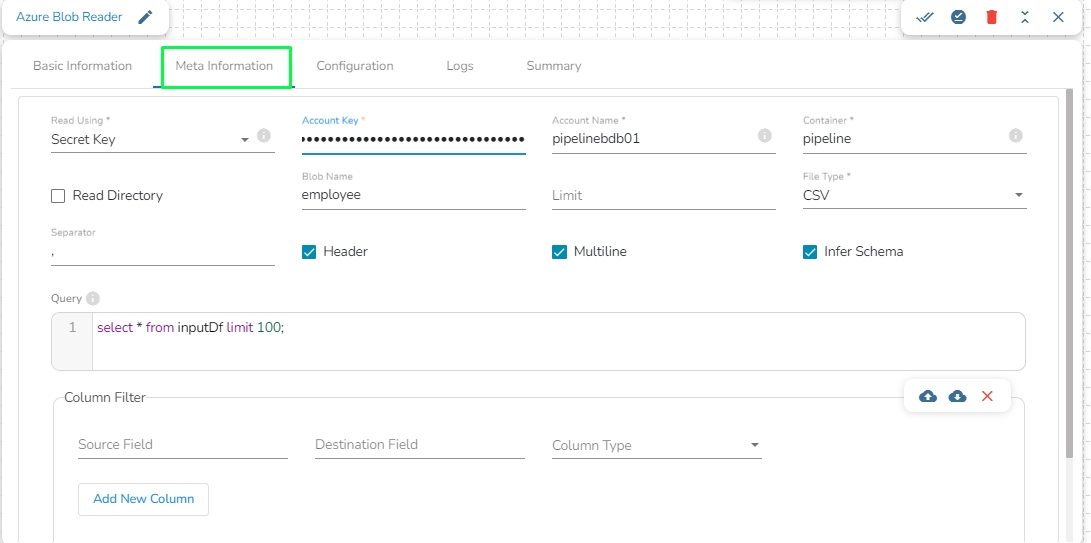
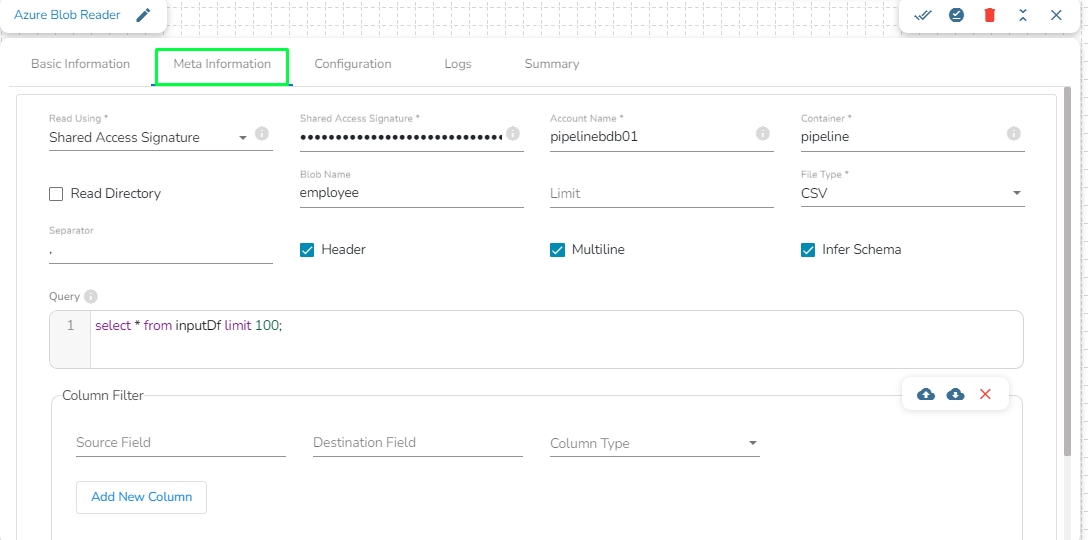


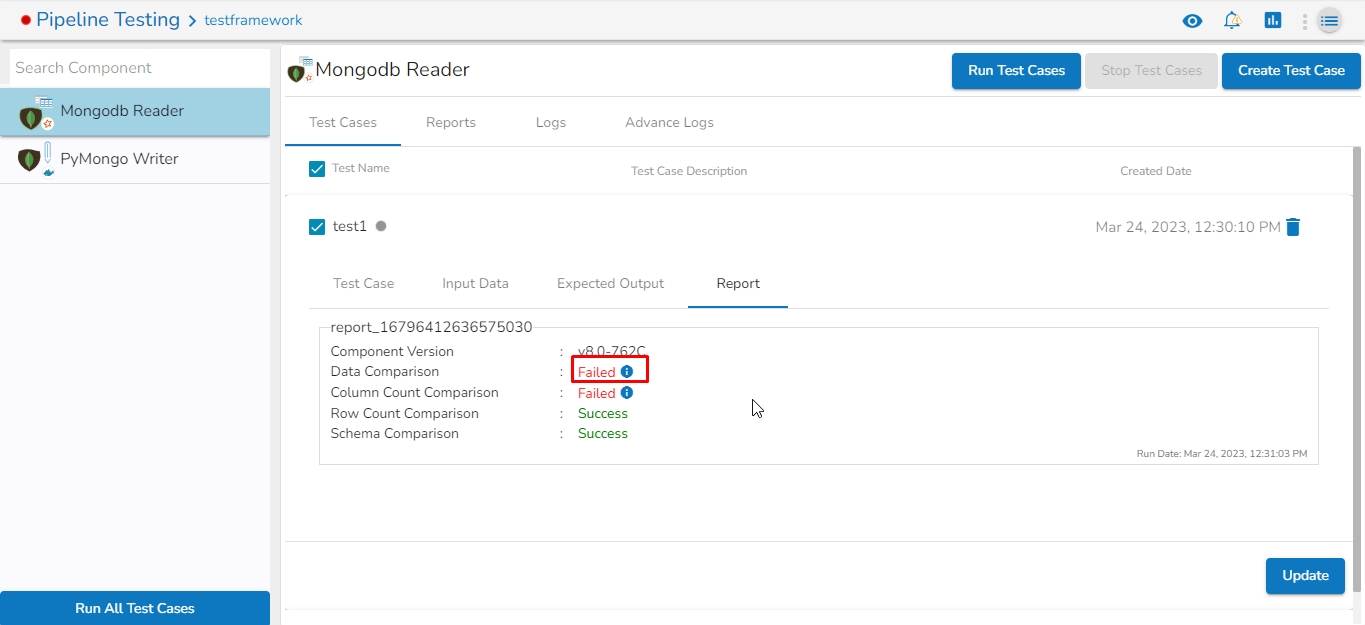
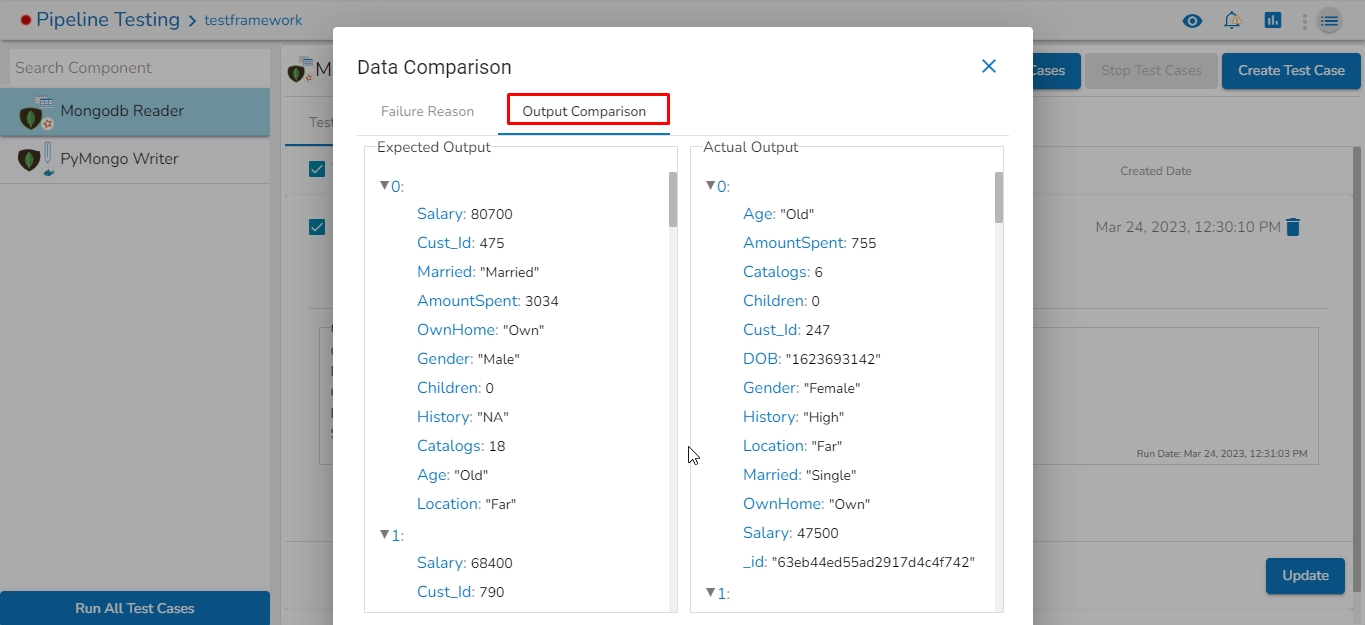
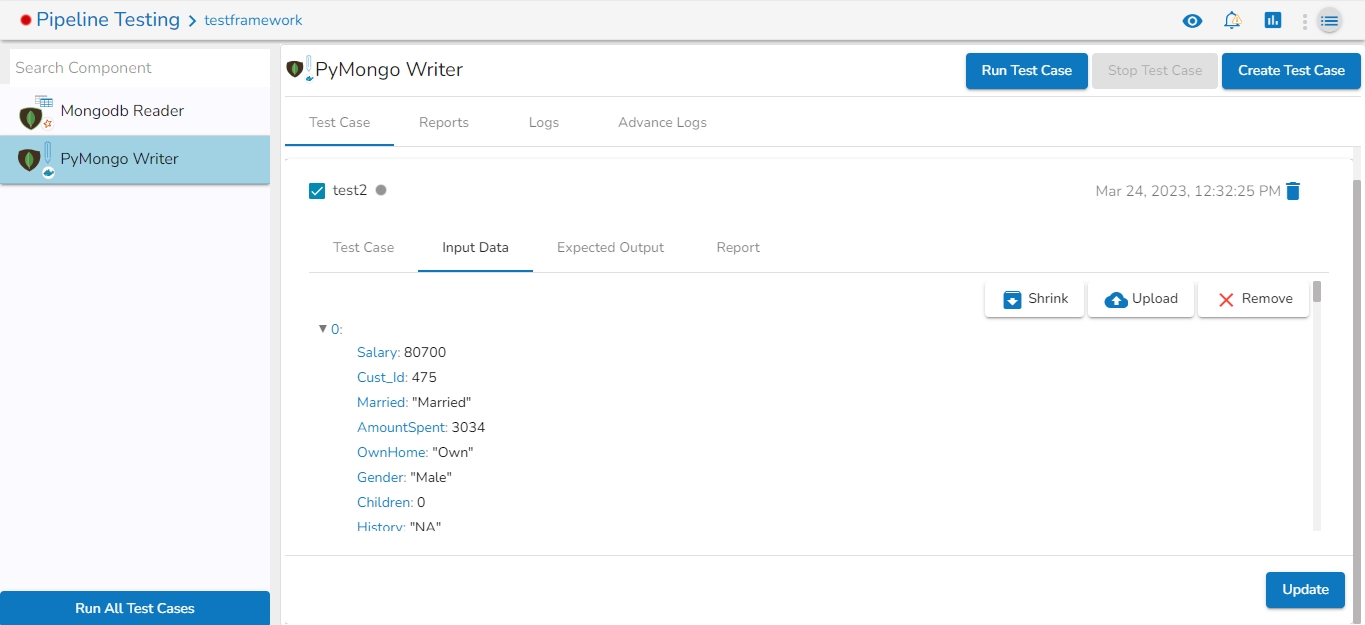
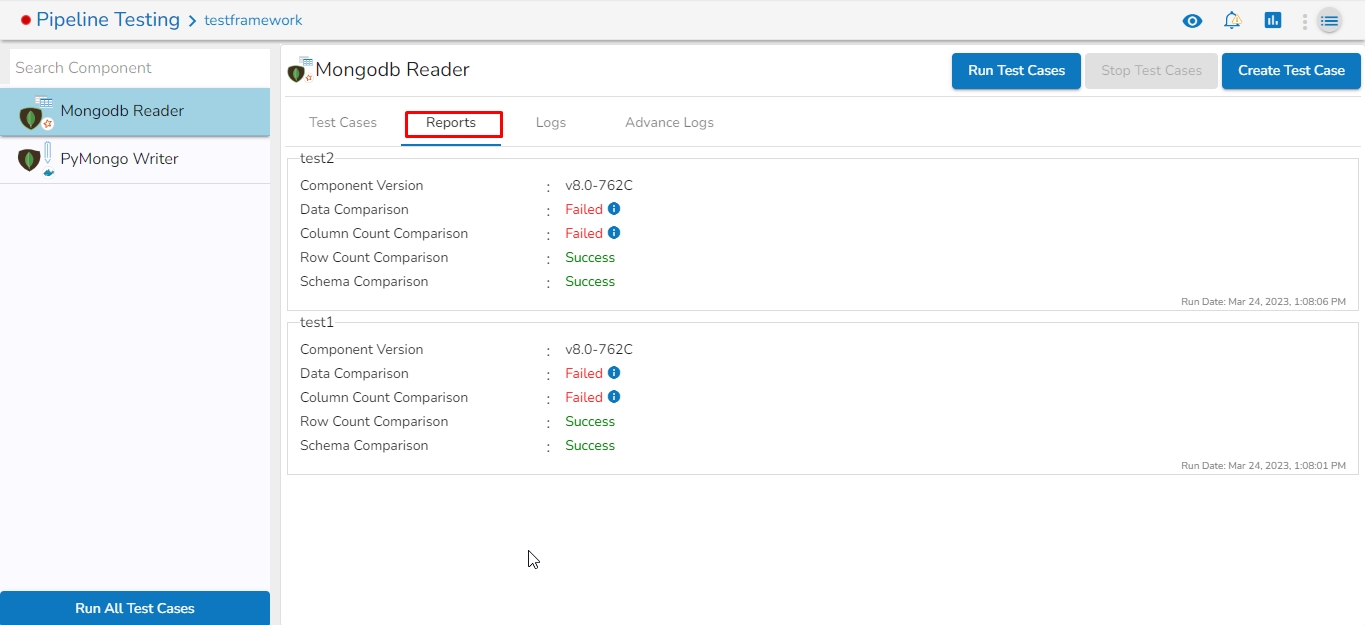
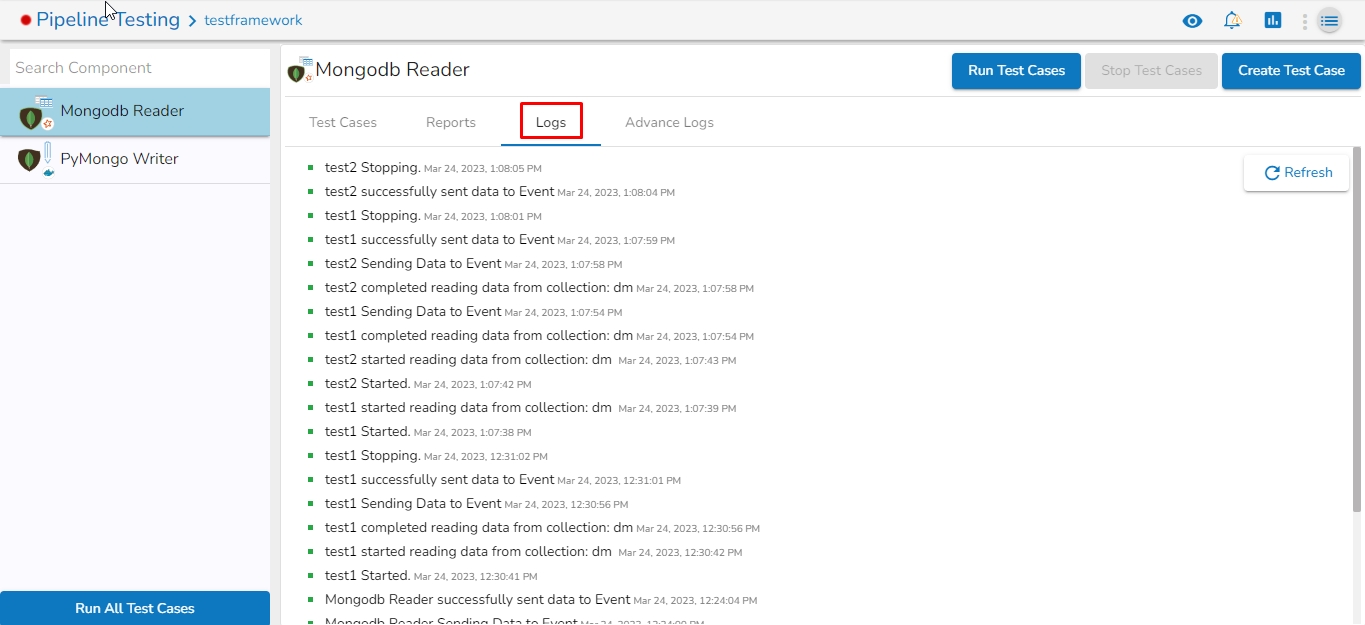

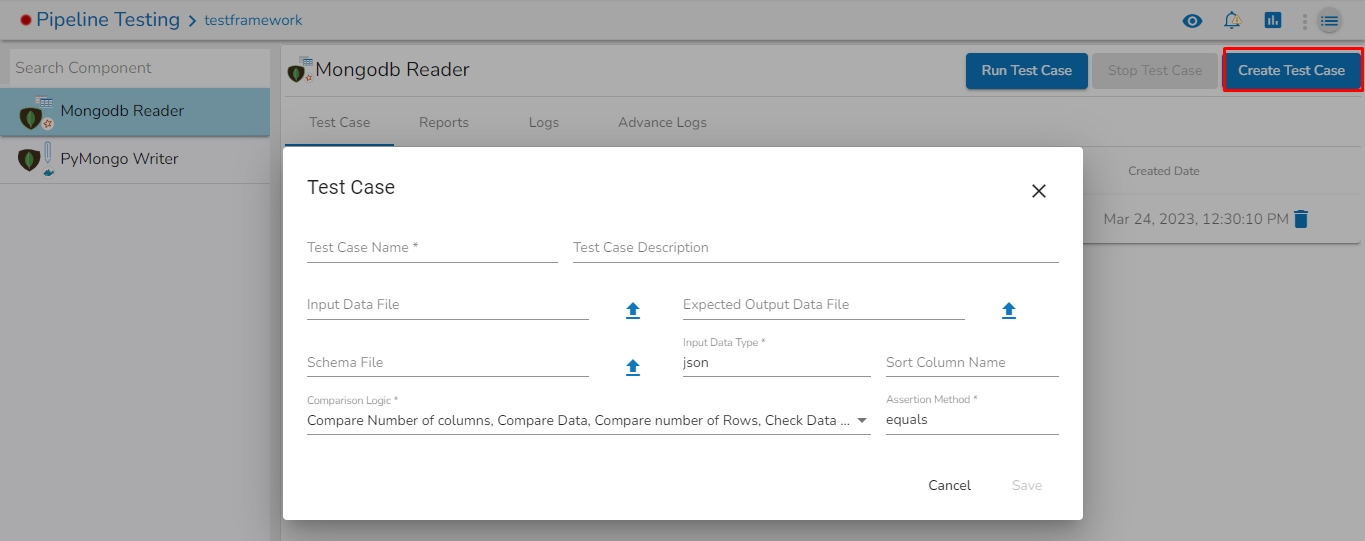
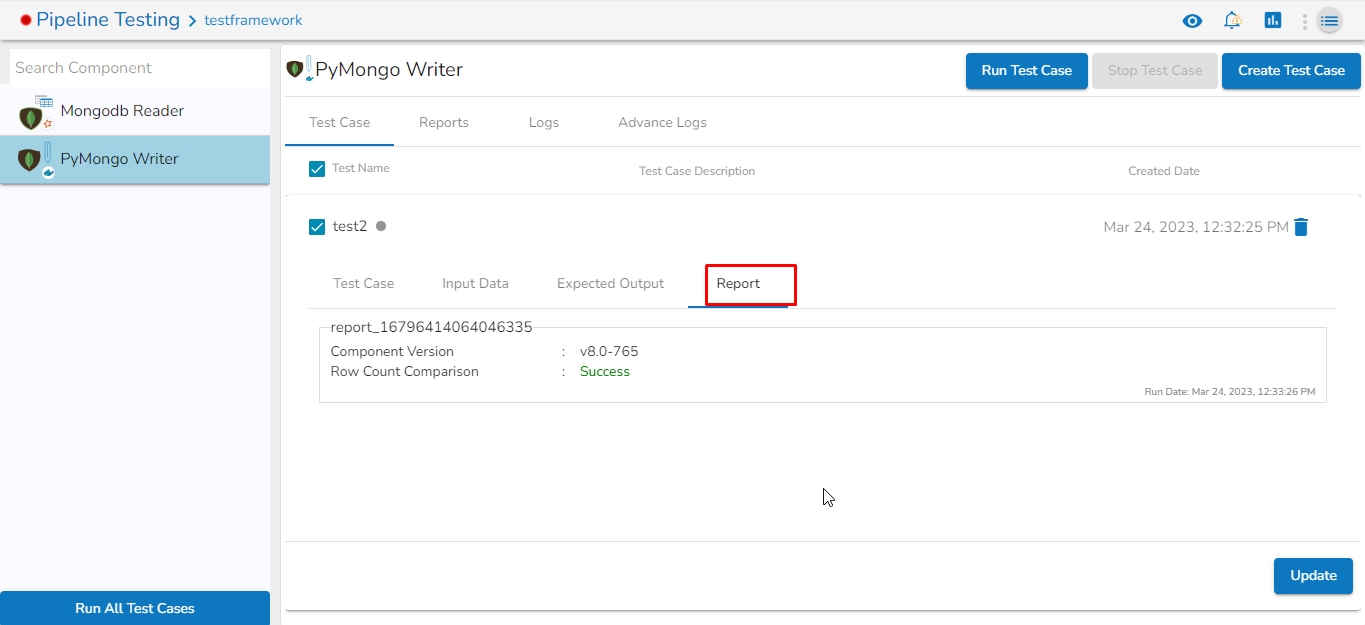

Development Mode
Runs the job in development mode.
Activate Job
Activates the current Job.
Update Job
Updates the current Job.
Edit Job
To edit the job name/ configurations.
Delete Job
Deletes the current Job.
Push Job
Push the selected job to GIT.
Redirects to the List Job page.
Redirects to the Settings page.
Opens the Job in Full screen
Format the Job tasks in arranged manner.
Zoom in the Job workspace.
Zoom out the Job workspace.


This page is for the Advanced configuration of the Data Pipeline. The following list of the configurations get displayed on the Settings Page:
Logger
Default Configuration
System Component Status
Data Sync
Job BaseInfo
List Components
This gives the info and config details of the Kafka topic that is set for logging.
This page enables users to view or set the default resource configuration in Low, Medium, and High resource allocation types for pipelines and jobs.
To access the Default Configuration, click on the settings option on the pipeline homepage and select it from the settings page.
There will be two tabs on this page:
Pipeline: The Pipeline tab opens by default.
Job: Navigate to this tab to view or set the default configuration for Jobs.
This tab shows the default configuration set for Spark and Docker Jobs in different resource allocation types (Low, Medium, High).
Users can change this default configuration as per their requirement, and the same default resource configuration will be applied to newly created jobs.
The System Component Status page under the Settings option gives us monitoring capability on the health of the System Components.
System logs are essential for monitoring and troubleshooting systems pods. They provide a record of system events, errors, and user activities. Here’s an overview of key concepts and types of system logs, along with best practices for managing them.
Navigate to the Logger Details page by clicking the Settings icon from the left menu bar.
Click on the System Component Status Tab. The user will navigate to the System Pod Details page.
Click on any one System Pod. The System Logs
System logs are files that record events and messages from the operating system, applications, and other components.
Search Bar: Users can search the relevant log entries in the search bar.
Time Range Filter: This filter allows users to specify a time frame to view system pod logs. This feature is essential for isolating issues, monitoring performance, or auditing activities over specific periods.
Filter Options: Users get two ways to specify the time range.
Predefined Ranges: Select from the displayed options that include commonly used options like last minutes, last hour, or last days, etc. E.g., the Last 24 hours is selected as a Time Range in the following image.
Select a time range.
It will be displayed as the selected time range.
Click the Apply Time Range option.
The logs within the selected time range will be displayed. Logs may be displayed in a list format, showing timestamps, log levels, and relevant messages.
Data Sync in Settings is given to globally configure the Data Sync feature. This way the user can enable a DB connection and use the same connection in the pipeline workflow without using any extra resources.
Go to the Settings page.
Click the Data Sync option.
The Data Sync page opens.
Please Note:
Please use TCP Port If you are using ClickHouse as a Driver in Data Sync.
A success notification message appears on the top stating that Data Sync Setting Creating Successfully.
Enable the action button to activate the Data Sync connection.
Go to the Settings page.
Click the Data Sync option.
The DB Sync Settings page opens.
Click the
The Edit Settings dialog box opens.
Edit the connection details if required.
Click the Update option.
Go to the Settings page.
Click the Data Sync option.
The Data Sync Settings page opens.
The Disconnect Setting confirmation dialog box appears.
Click the DISCONNECT option.
A success notification message appears on the top when DB Sync gets disconnected.
All the Pipelines containing the DB Sync Event component get listed under the Pipeline using the DB Sync section.
The user can see the following information:
Name: Name of the pipeline where Data Sync is used.
The Pipeline module supports the following types of jobs:
These jobs are configured in the Job BaseInfo page under the Settings menu.
To create a new Job BaseInfo, click on the Create Job BaseInfo option, as shown in the image below:
Once clicked, it will redirect to the page for creating a new Job BaseInfo and the user will be asked to fill in details in the following Tabs:
Basic Information Tab:
Name: Provide a Name for the Job BaseInfo.
Deployment type: Select the Deployment type from the drop-down.
Image Name: Enter the Image name for the Job BaseInfo.
Version:
Ports Tab:
Port Name: Enter the Port name.
Port Number: Enter the Port number.
Delete: The user can delete the port details by clicking on this option.
Add Port:
Spark component information:
Main class: Enter the Main class for creating the Job BaseInfo.
Main application file: Enter the main application file.
Runtime Environment Type: Select from the drop-down. There are three options available: Scala, Python, and R.
Once the Job BaseInfo is created, the user can redirect to the List Job BaseInfo page by clicking on the List Job BaseInfo icon as shown in the below image:
List Job BaseInfo Page:
This Page will show the list of all created Job BaseInfo as shown in the below image:
The Name column represents the Name of the Job BaseInfo.
The Status column will display the status of the Job BaseInfo.
The Version column displays the version of the Job BaseInfo.
All the components being used in the pipeline are listed on this page.
There is a provision to create a component. At the top right corner, we have a Create Component icon. Clicking on this takes you to a different page where you can configure your component.
Check out the steps in the below-shared walk-through to configure the custom component.
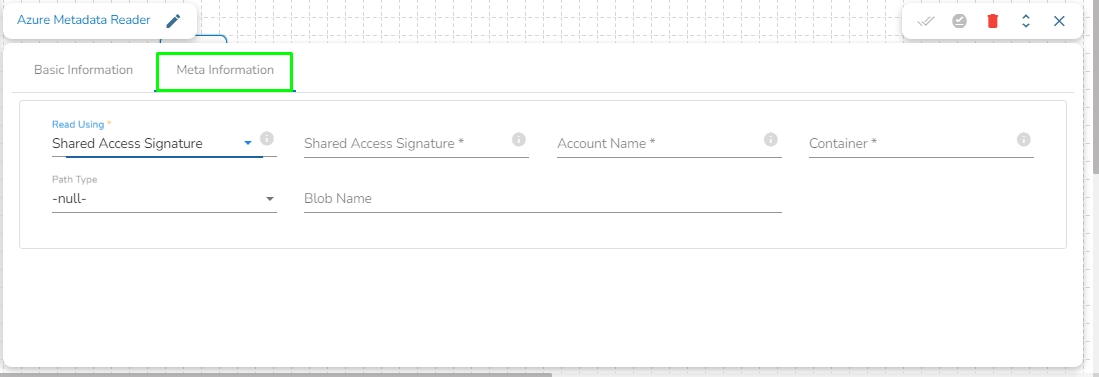
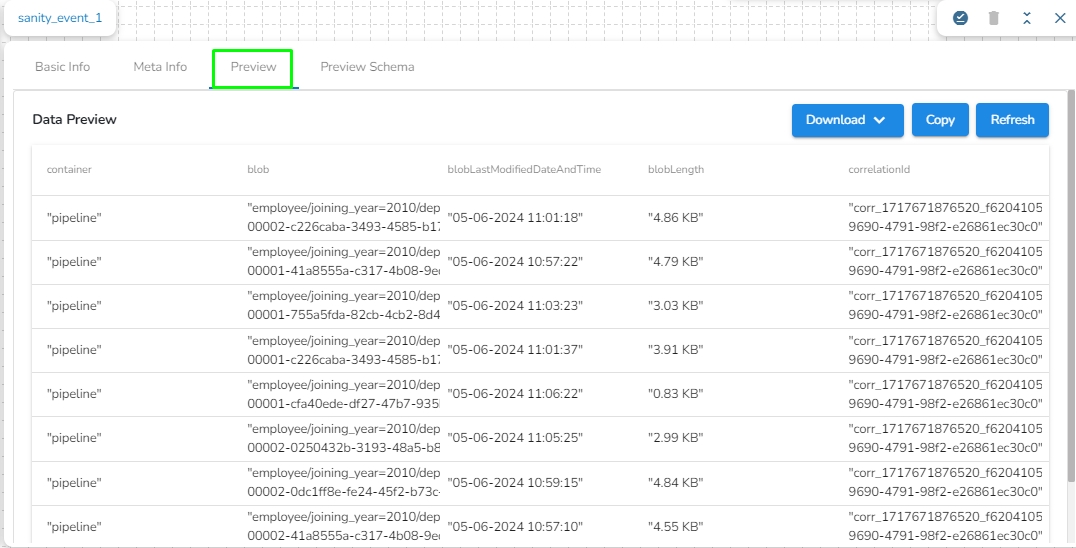
A Kafka event refers to a single piece of data or message that is exchanged between producers and consumers in a Kafka messaging system. Kafka events are also known as records or messages. They typically consist of a key, a value, and metadata such as the topic and partition. Producers publish events to Kafka topics, and consumers subscribe to these topics to consume events. Kafka events are often used for real-time data streaming, messaging, and event-driven architectures.


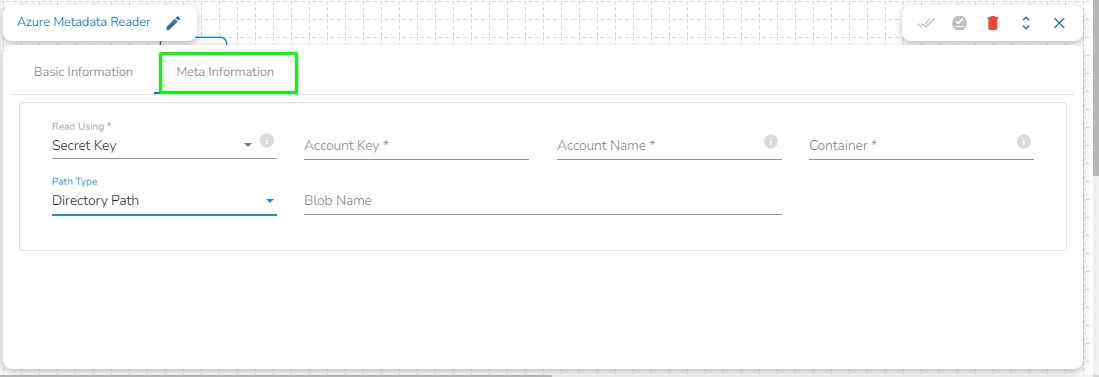
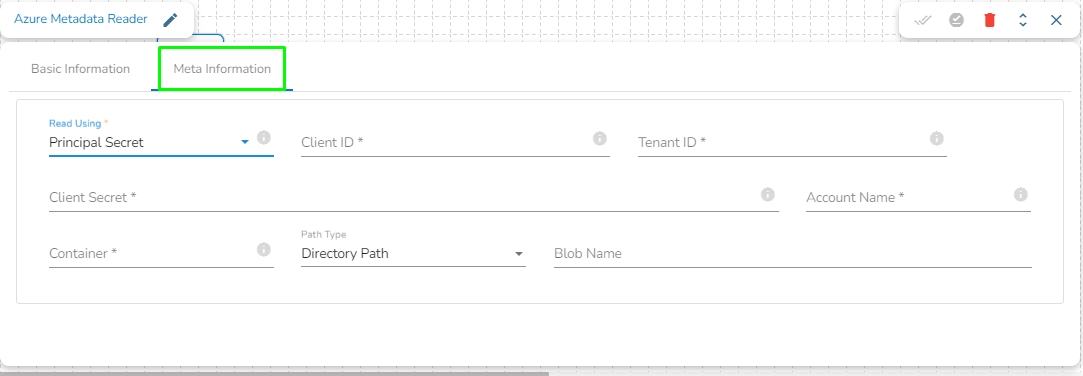
Users can change this default configuration as per their requirement, and the same default resource configuration will be applied to newly added components when used in the pipeline.
Custom Range: Users can specify a start and end date/time to filter logs using the Calendar.
Log Formats: Logs can be in plain text format.
Log Levels: Logs are often categorized by severity (e.g., DEBUG, INFO, WARN, ERROR, CRITICAL).
MySQL
MSSQL
Oracle
ClickHouse
Snowflake
Redshift
The Create Data Sync Connection dialog box appears.
Specify all the required connection details.
Click the Save option.
Actions: The user can view the pipeline where Data Sync is used.
isExposed: This option will be automatically filled as True once the deployment type is selected
Job type: Select the job type from the drop-down.


Navigate to the Pipeline Editor page.
Click on the Event Panel option in the pipeline toolbar and Click on Add New Event icon.
The New Event window opens.
Provide a name for the new Event.
Select Event Duration: Select an option from the below-given options.
Short (4 hours)
Medium (8 hours)
Half Day (12 hours)
No. of Partitions: Enter a value between 1 to 100. The default number of partitions is 3.
No. of Outputs: Define the number of outputs using this field.
Is Failover: Enable this option to create the event as the Failover Event. If a Failover Event is created, it must be mapped with a component to retrieve failed data from that component.
Click the "Add Event" option.
The Event will be created successfully, and the newly created Event is added to the Kafka Events tab in the Events panel.
Once the Kafka Event is created, the user can drag it to the pipeline workspace and connect it to any component.
On hovering over the event in the pipeline workspace, the user can see the following information for that event.
Event Name
Duration
Number of Partitions
The user can edit the following information of the Kafka Event after dragging it to the pipeline workspace:
Display Name
No. of Outputs
Is Failover
A Failover Event is designed to capture data that a component in the pipeline fails to process. In cases where a connected event's data cannot be processed successfully by a component, the failed data is sent to the Failover Event.
Follow these steps to map a Failover Event with the component in the pipeline:
Create a Failover Event following the provided steps.
Drag the Failover Event to the pipeline workspace.
Navigate to the Basic Information tab of the desired component where the Failover Event should be mapped.
From the drop-down, select the Failover Event.
Save the component configuration.
The Failover Event is now successfully mapped. If the component encounters processing failures with data from its preceding event, the failed data will be directed to the Failover Event.
The Failover Event holds the following keys along with the failed data:
Cause: Cause of failure.
eventTime: Date and Time at which the data gets failed.
When hovering over the Failover Event, the associated component in the pipeline will be highlighted. Refer to the image below for visual reference.
Please see the below-given video on how to map a Failover Event.
This feature automatically connects the Kafka/Data Sync Event to the component when dragged from the events panel. In order to use this feature, users need to ensure that the Auto connect components on drag option is enabled from the Events panel.
Please see the below-given illustrations on auto connecting a Kafka and Data Sync Event to a pipeline component.
This feature allows user to directly connect a Kafka/Data Sync event to a component by right clicking on the component in the pipeline.
Follow these steps to directly connect a Kafka/Data Sync event to a component in the pipeline:
Right-click on the component in the pipeline.
Select the Add Kafka Event or Add Sync Event option.
The Create Kafka Event or Create Sync Event dialog box will open.
Enter the required details.
Click on the Add Kafka Event or Create Sync Event option.
The newly created Kafka/Data Sync Event will be directly connected to the component.
Please see the below-given illustrations on how to add a Kafka and Data Sync Event to a pipeline workflow.
This feature enables users to map a Kafka Event with another Kafka event. In this scenario, the mapped event will have the same data as its source event.
Please see the below-given illustrations on how to create mapped Kafka Event.
Follow these steps to create a mapped event in the pipeline:
Choose the Kafka event from the pipeline as the source event for which mapped events need to be created.
Open the events panel from the pipeline toolbar and select the "Add New Event" option.
In the Create Kafka Event dialog box, enable the option at the top to enable mapping for this event.
Enter the Source Event Name in the Event name and click on the search icon to select the name of the source event from the suggestions.
The Event Duration and No. of Partitions will be automatically filled in the same as the source event. Users can modify the No. of Outputs between 1 to 10 for the mapped event.
Click on the Map Kafka Event option to create the Mapped Event.
Please go through the below-given steps to check the meta information and download the data from the Kafka topic once the data has been sent to the Kafka event by the producer. The user can download the data from the Kafka event in CSV, Excel, and JSON format. The user will find the following tabs in the Kafka topic:
This tab displays information such as Display Name, Event Name, No. of Partitions, No. of Outputs, Event Duration, etc.
Navigate to the meta information tab to view details such as the Number Of Records in the Kafka topic, Approximate Data Size, Number of Partitions, Approximate Partition Size (in MB), Start and End Offset of partition, and Total Records in each partition.
Navigate to the Preview tab for a pipeline workflow using an Event component. Preferably select a pipeline workflow that has been activated to get data.
It will display the Data Preview.
Data Type icons are provided in each column header to indicate the data type. The icons help users quickly understand the contained data type in each column. The following icons are added:
String
Number
Date
DateTime
Float
Boolean
Users can drag and drop column separators to adjust column widths, allowing for a personalized view of the data.
This feature helps accommodate various data lengths and user preferences.
The event data is displayed in a structured table format.
The table supports sorting and filtering to enhance data usability. The previewed data can be filtered based on the Latest, Beginning, and Timestamp options.
The Timestamp filter option redirects the user to select a timestamp from the Time Range window. The user can either select a start and end date or choose from the available time ranges to apply and get a data preview.
Check out the illustration on sorting and filtering the Event Data Preview for a Pipeline workflow.
This tab holds the Spark schema of the data. Users can download the Spark schema of the data by clicking on the download option.
Kafka Events can be flushed to delete all present records. Flushing an Event retains the offsets of the topic by setting the start-offset value to the end-offset. Events can be flushed by using the Flush Event button beside the respective Event in the Event panel, and all Events can be flushed at once by using the Flush All button. This button is also present at the top of the Event panel.
Check out the given illustration on how to Auto connect a Kafka Event to a pipeline component.
Drag any component to the pipeline workspace.
Configure all the parameters/fields of the dragged component.
Drag the Event from the Events Panel. Once the Kafka event is dragged from the Events panel, it will automatically connect with the nearest component in the pipeline workspace. Please find the below given walk through for the reference.
Click the Update Pipeline icon to save the pipeline workflow.
Data Sync Event in the Data Pipeline module is used to write the required data directly to the any of the databases without using the Kafka Event and writer components in the pipeline. Please refer the below image for reference:
It can be seen in the above image that Data Event will directly write the data read from the MongoDB reader component to the table of the configured Database in the Data Sync without using a Kafka Event in-between.
It doesn't need Kafka event to read the data. It can be connected with any component to read the data and it writes it to the tables of respective databases.
Pipeline complexity is reduced because Kafka event and writer is not needed to use in the pipeline.
Since, writers are not used, the resource consumption are low.
Once Data sync are configured, multiple Data Sync events can be created for the same configuration and the data can be written to multiple tables.
Pre-requisite: Before Creating the Data Sync Event, the user has to configure the Data Sync section under the Settings page.
DB Sync Event enables direct write to the DB that helps in reducing the usage of additional compute resources like Writers in the Pipeline Workflow.
Check out the given video on how to create a Data Sync component and connect it with a Pipeline component.
Navigate to the Pipeline Editor page.
Click the Toggle Event Panelicon from the header.
The Events Panel appears, and the Toggle Event Panel icon gets changed as, suggesting that the event panel is displayed.
Click on the DB Sync tab.
Click on the Add New Data Sync (+) icon from the Toggle Event Panel.
The Create Data Sync window opens.
Provide a display name for the new Data Sync.
Select the Driver
Put a checkmark in the Is Failover option to create a failover Data Sync. In this case, it is not enabled.
Click the Save option.
Drag and drop Data Sync Event to the workflow editor.
Click on the dragged Data Sync component.
The Basic Information tab appears with the following fields:
Display Name: Display name of the Data Sync
Event Name: Event name of the Data Sync
Table name: Specify table name.
Driver: This field will be pre-selected.
Save Mode: Select save mode from the drop-down: Append or Upsert.
Composite Key: This field is optional. This field will only appear when upsert is selected as the Save Mode.
Click on the Save Data Sync icon to save the Data Sync information.
Once the Data Sync Event is dragged from the Events panel, it will automatically connect with the nearest component in the pipeline workflow.
Update and activate the pipeline.
Open the Logs tab to view whether the data gets written to a specified table.
Click the Event Panelicon from the Pipeline Editor page.
The Events Panel appears on the right side of the Pipeline Workflow Editor page.
Click on the Data Sync tab.
Click on the Add New Data Sync (+) icon from the Toggle Event Panel.
The Create Data Sync dialog box opens.
Provide the Display Name and
Enable the Is Failover option.
Click the Save option.
The failover Data Sync will be created successfully.
Drag & drop the failover data sync to the pipeline workflow editor.
Click on the failover Data Sync and fill in the following field:
Table name: Enter the table name where the failed data has to be written.
Primary key: Enter the column name to be made as the primary key in the table. This field is optional.
Save mode: Select a save mode from the given choices. Select either Append or Upsert.
The failover Data Sync Event gets configured, and now the user can map it with any component in the pipeline workflow.
The image displays that the failover Data Sync Event is mapped with the SQL Component.
If the component fails, it will write all the data to the given table of the configured DB in the Failover Data Sync.
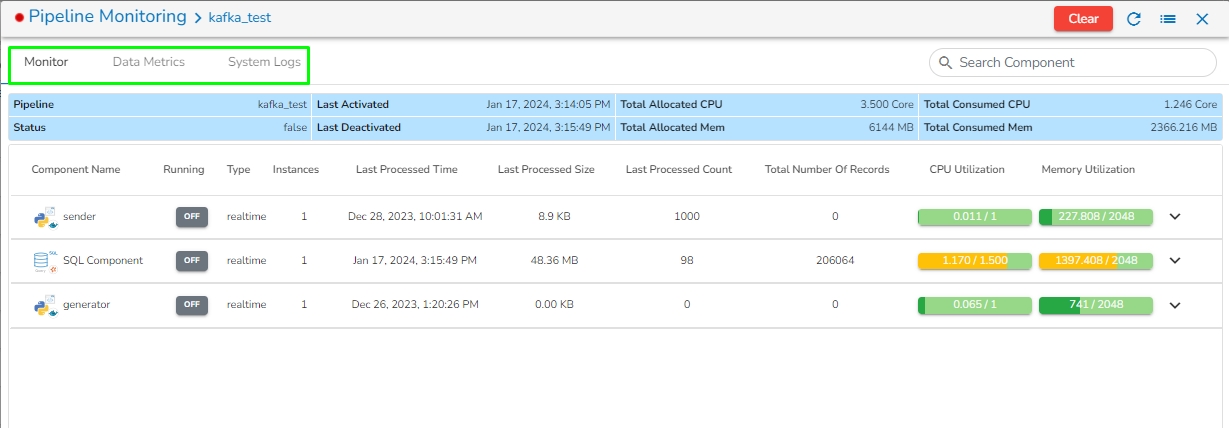
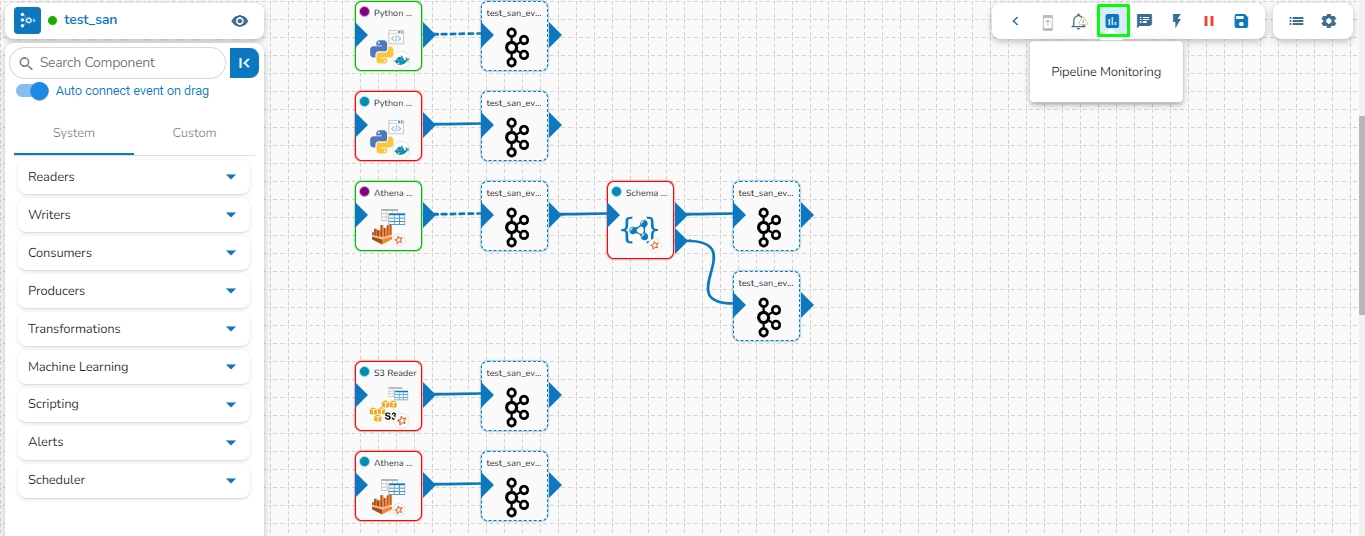
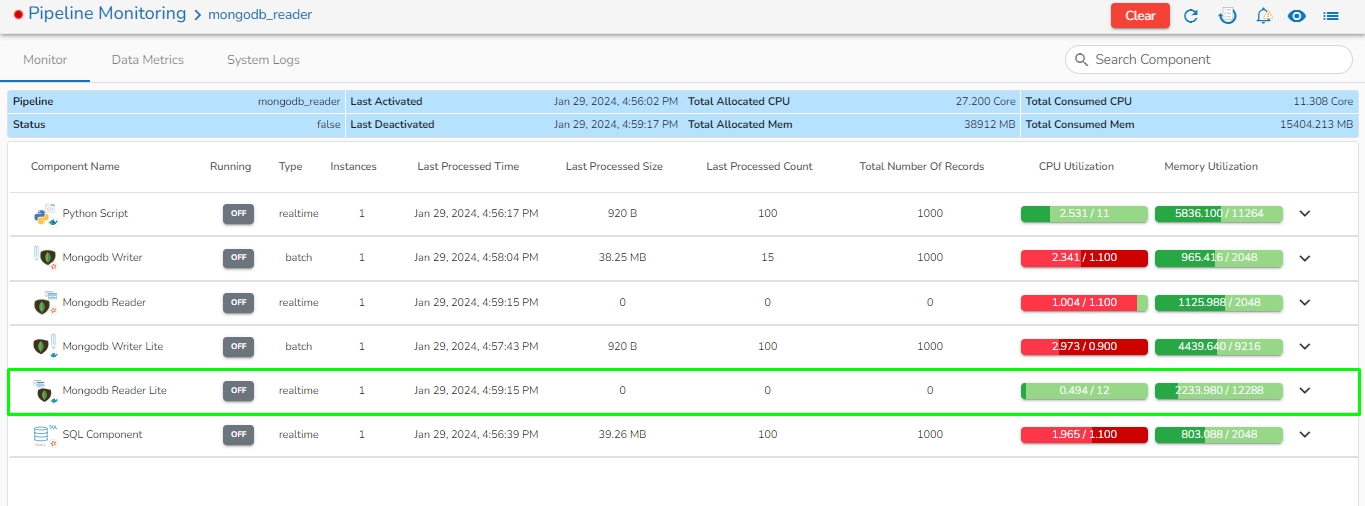
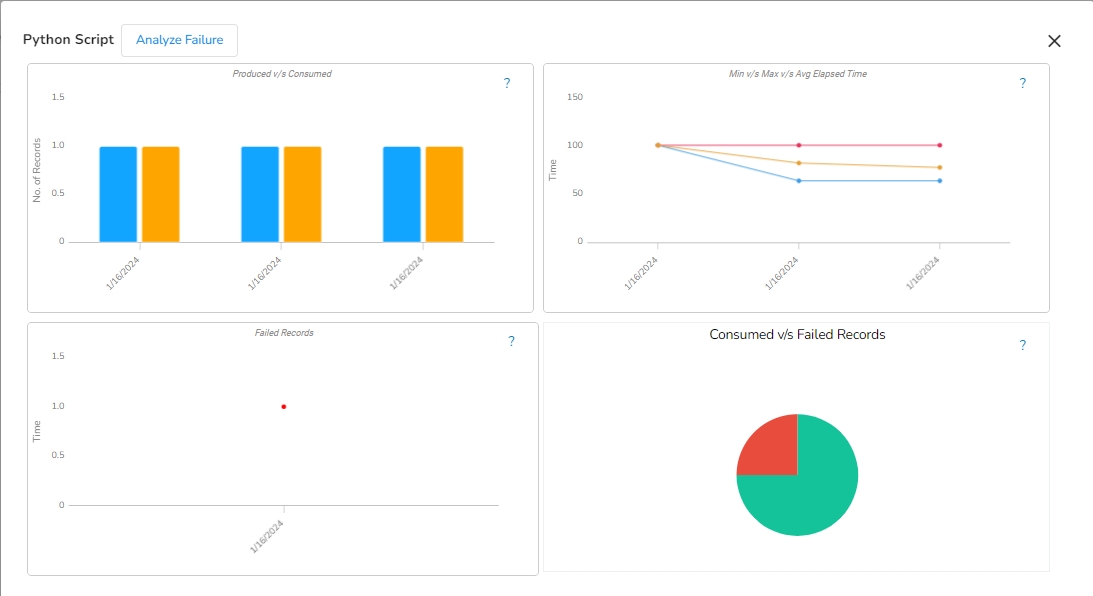
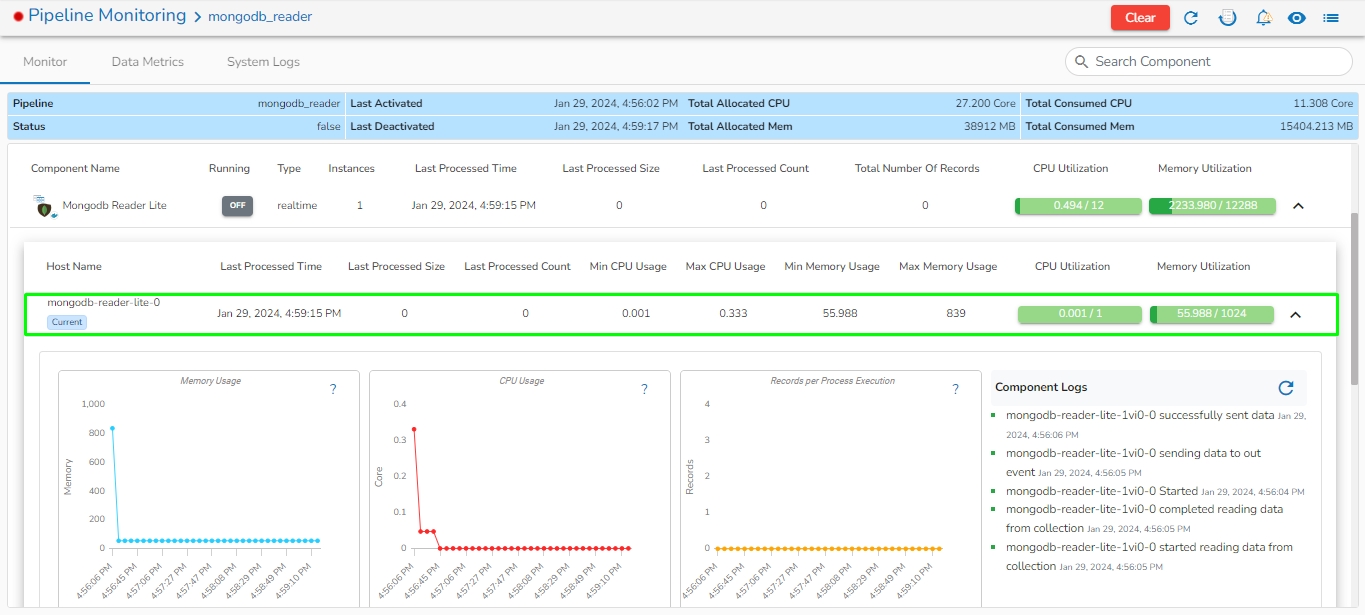
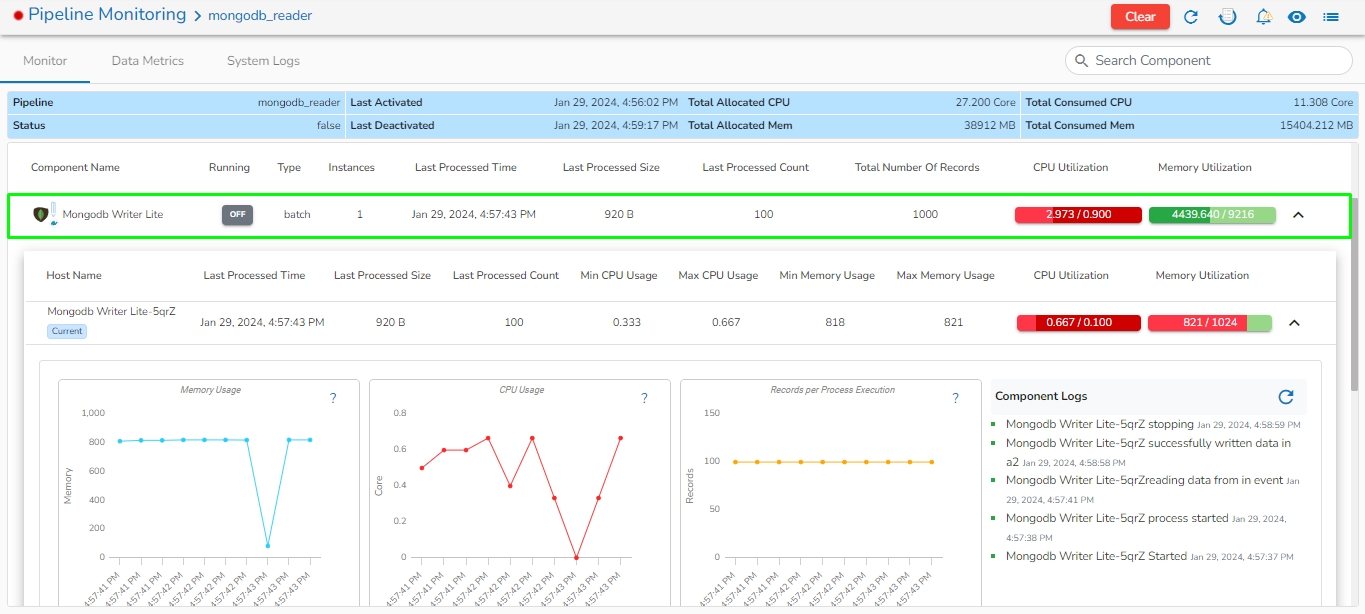
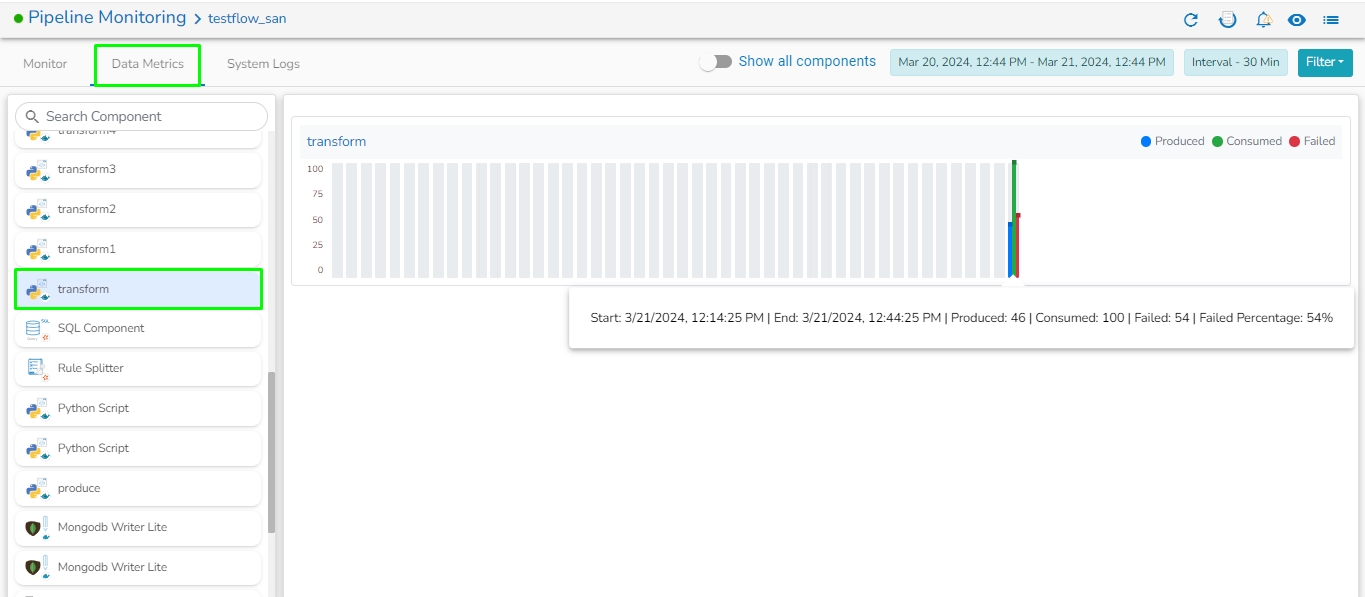
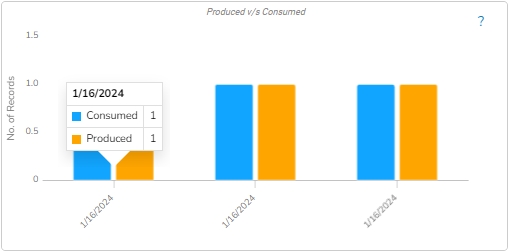
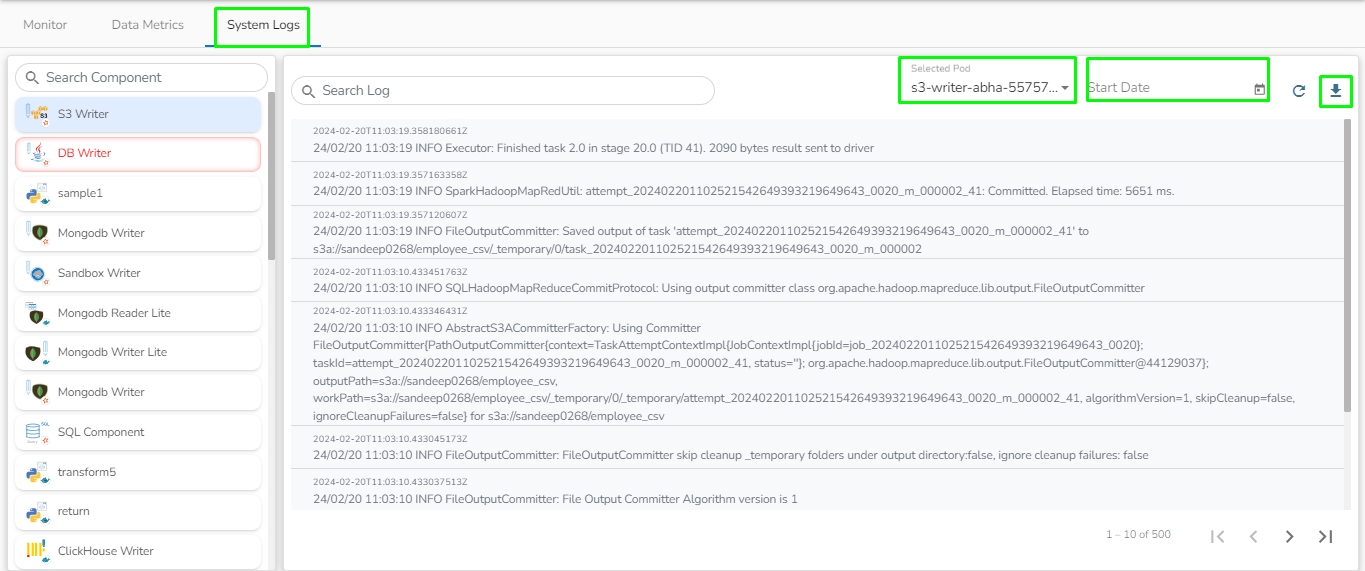
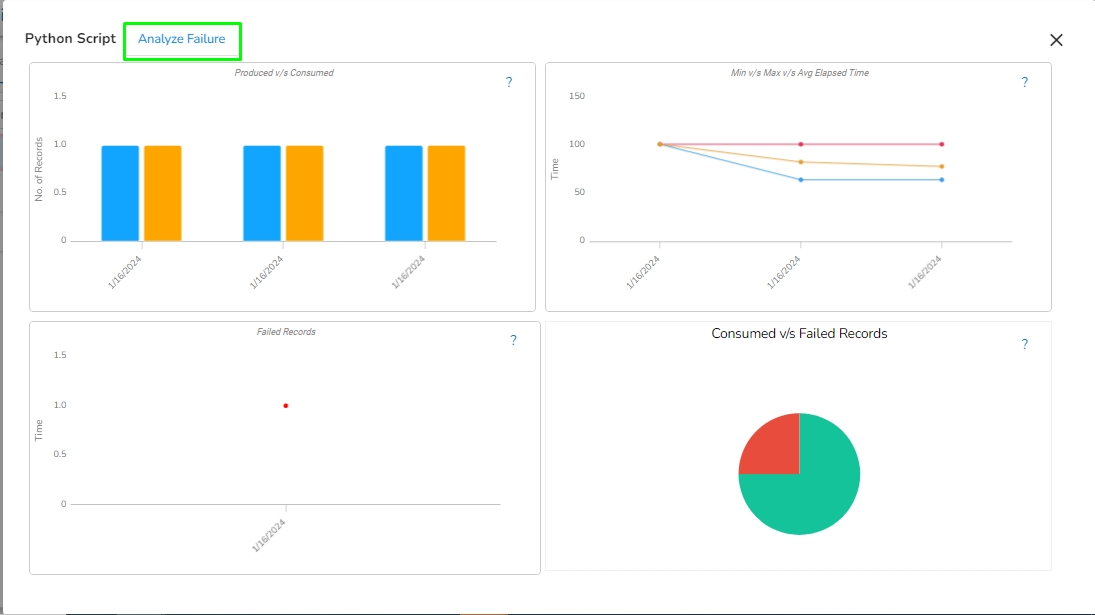
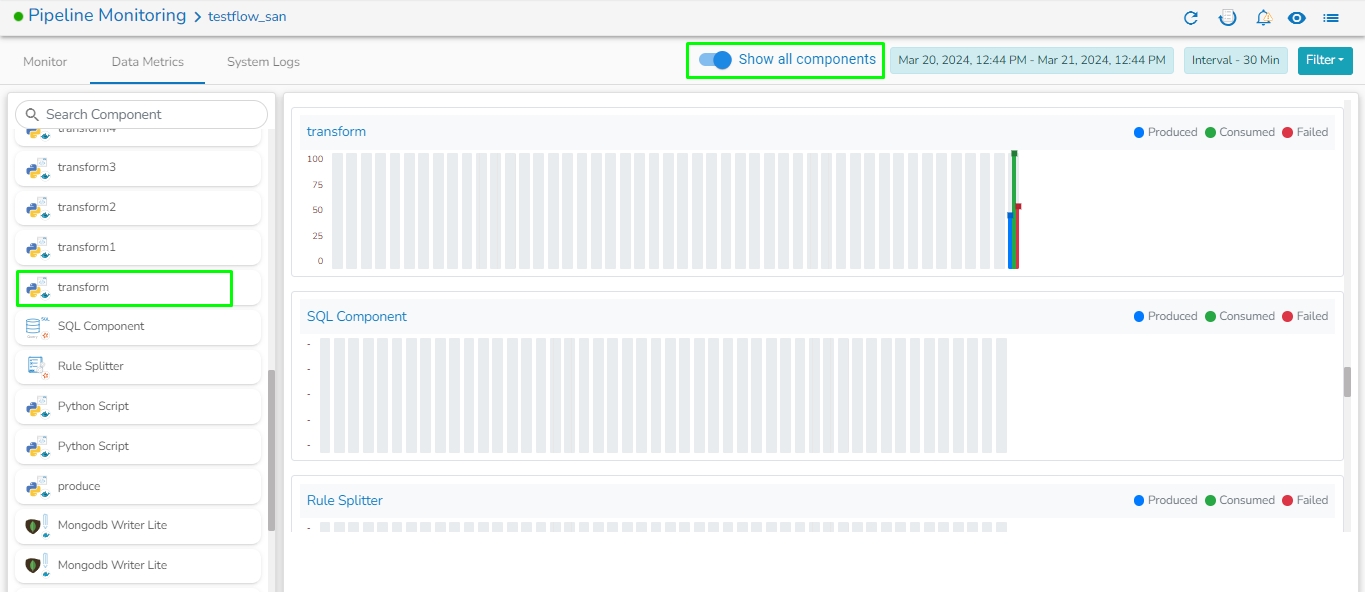
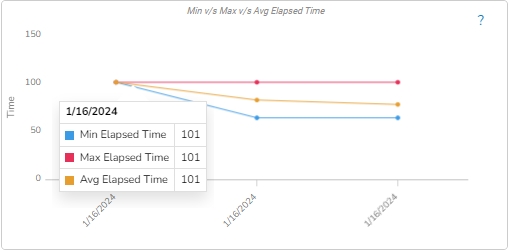
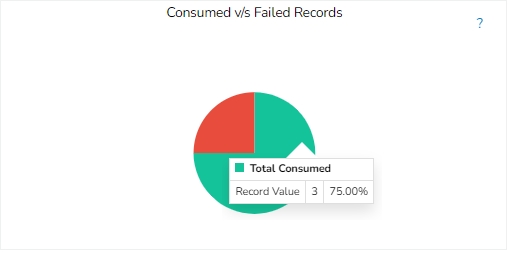
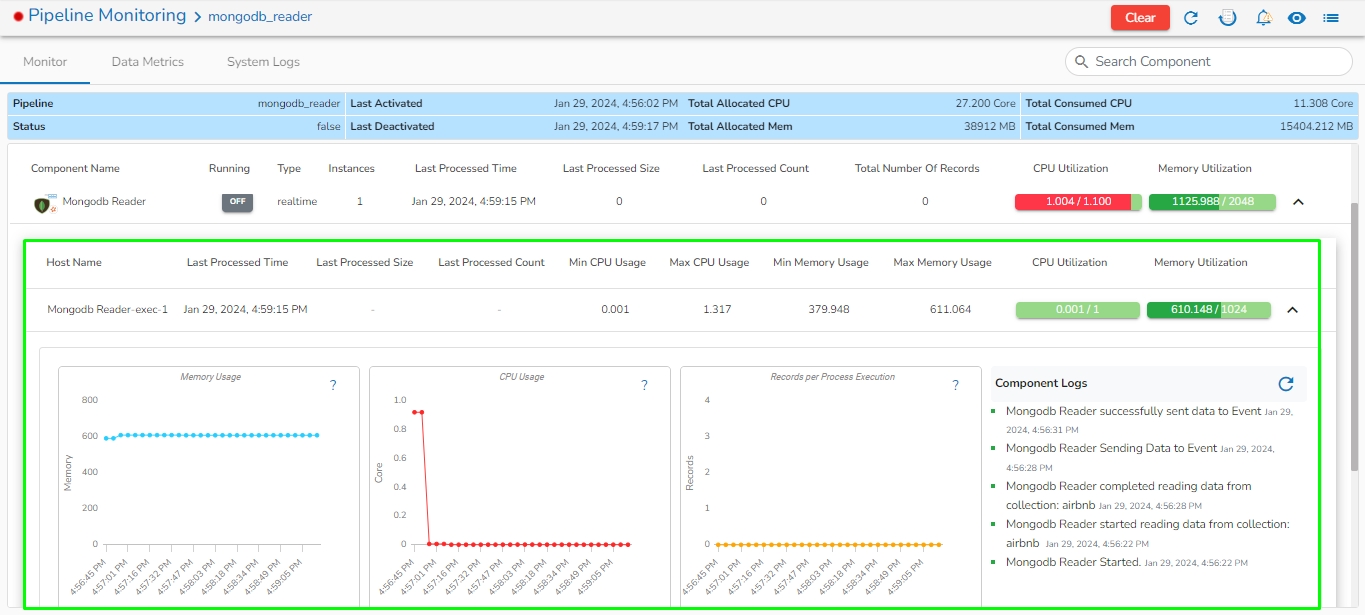
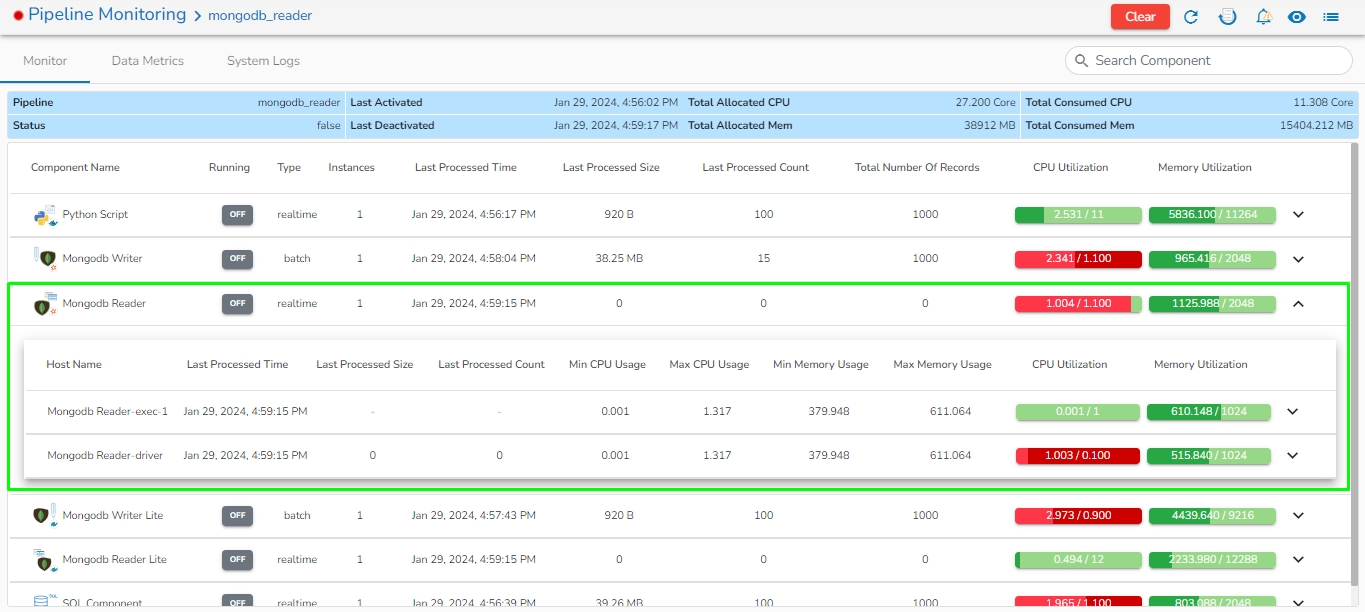
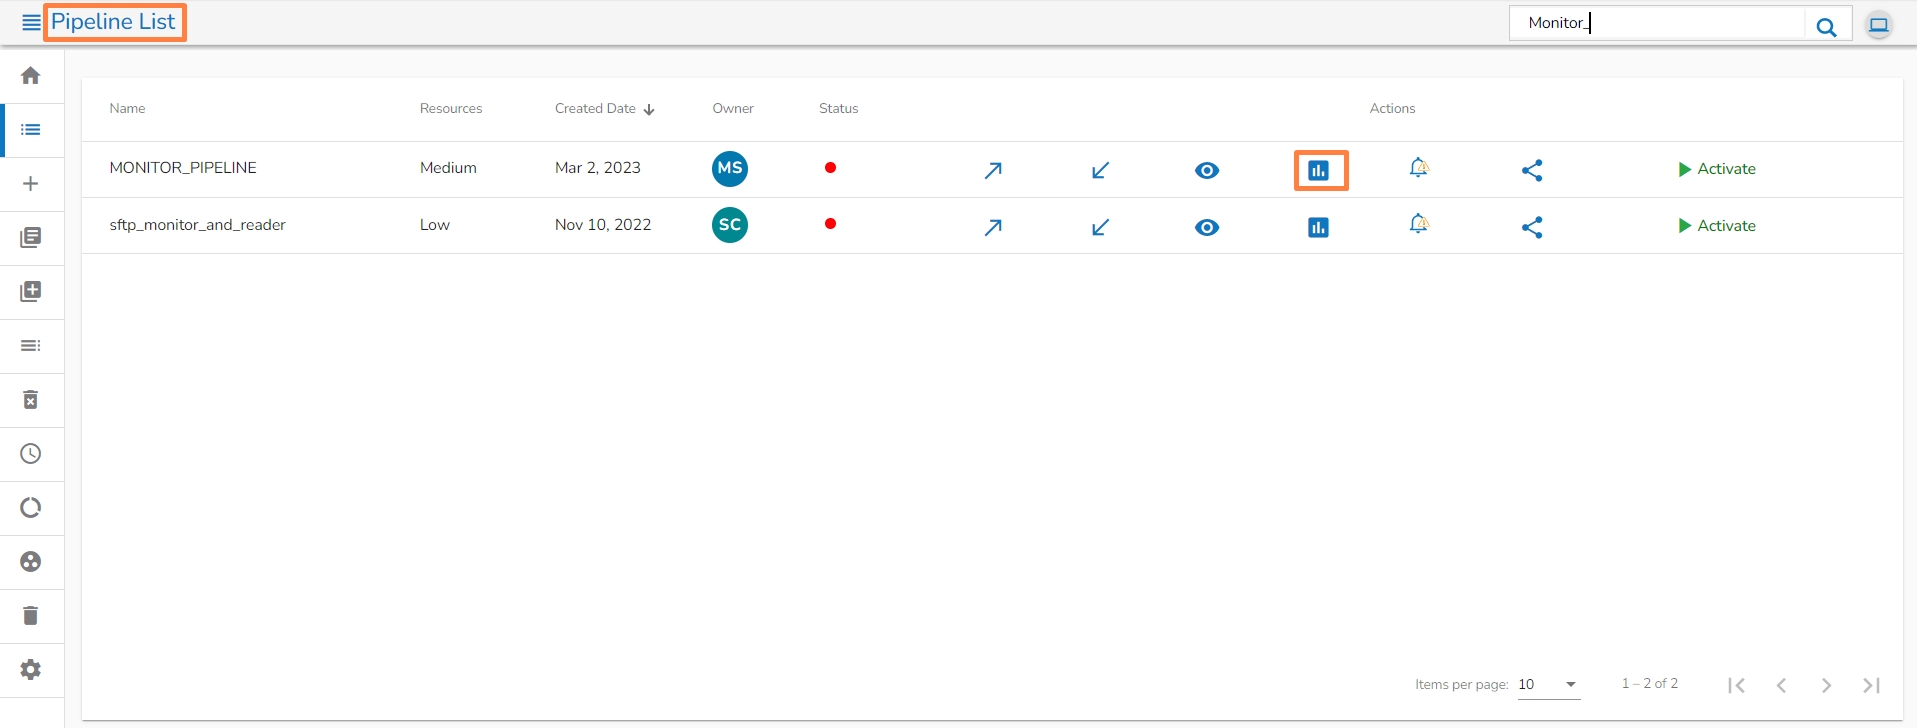
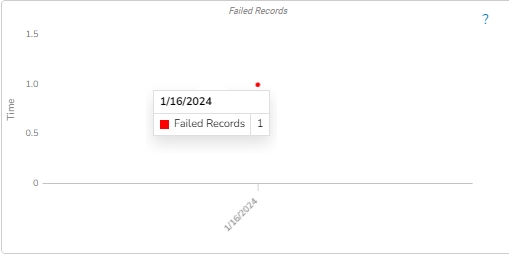
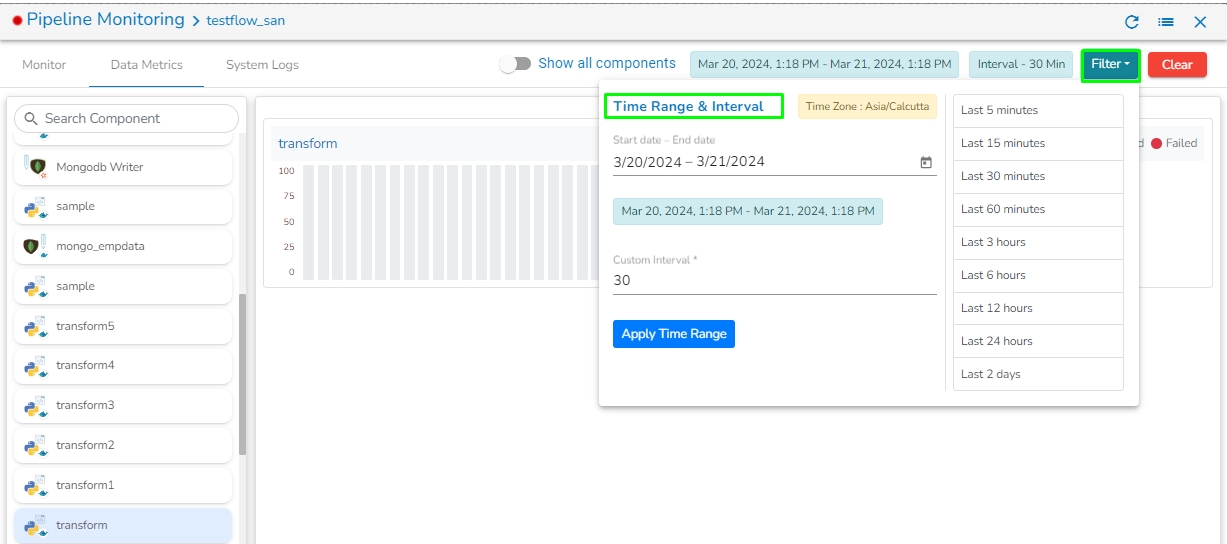
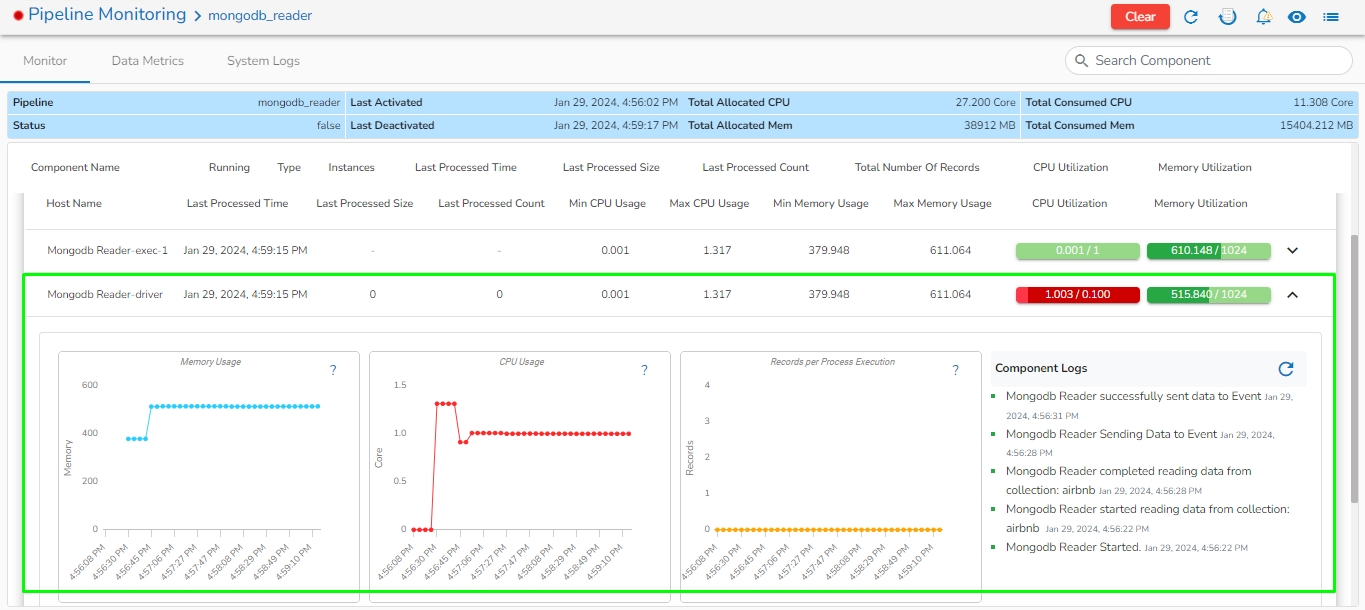
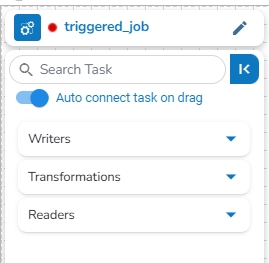
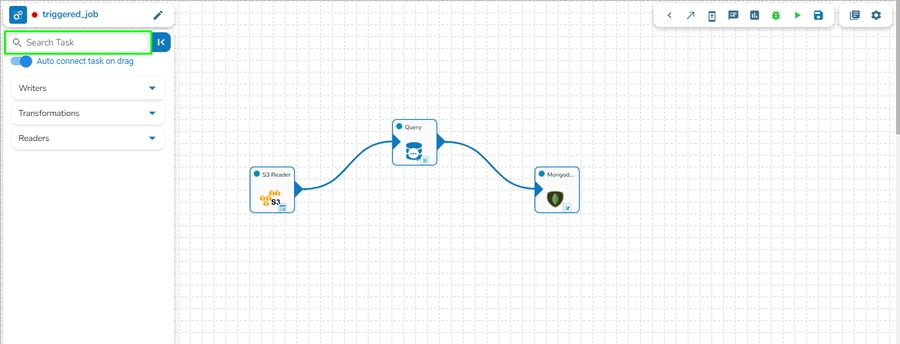
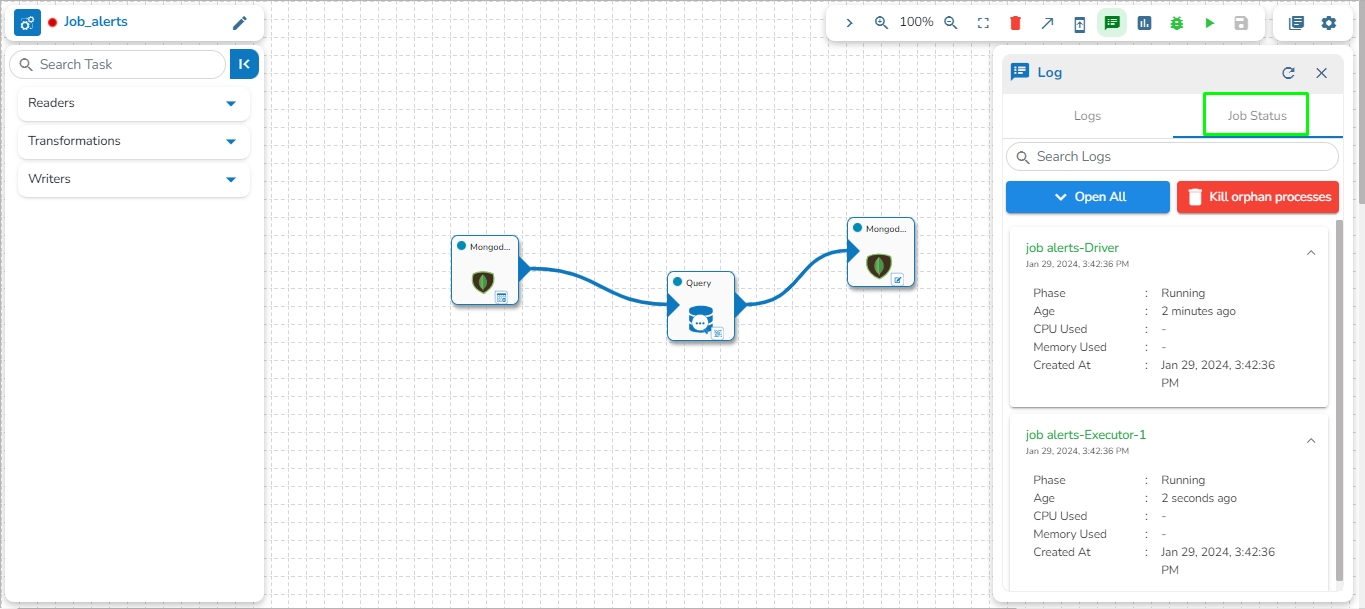
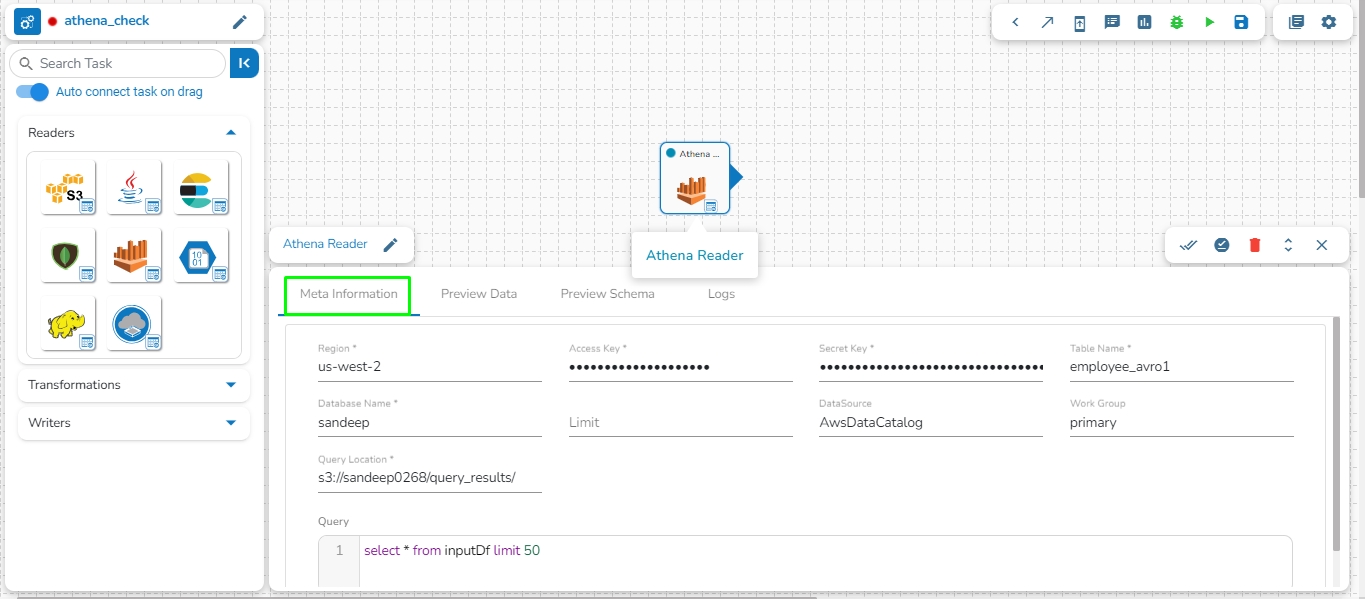
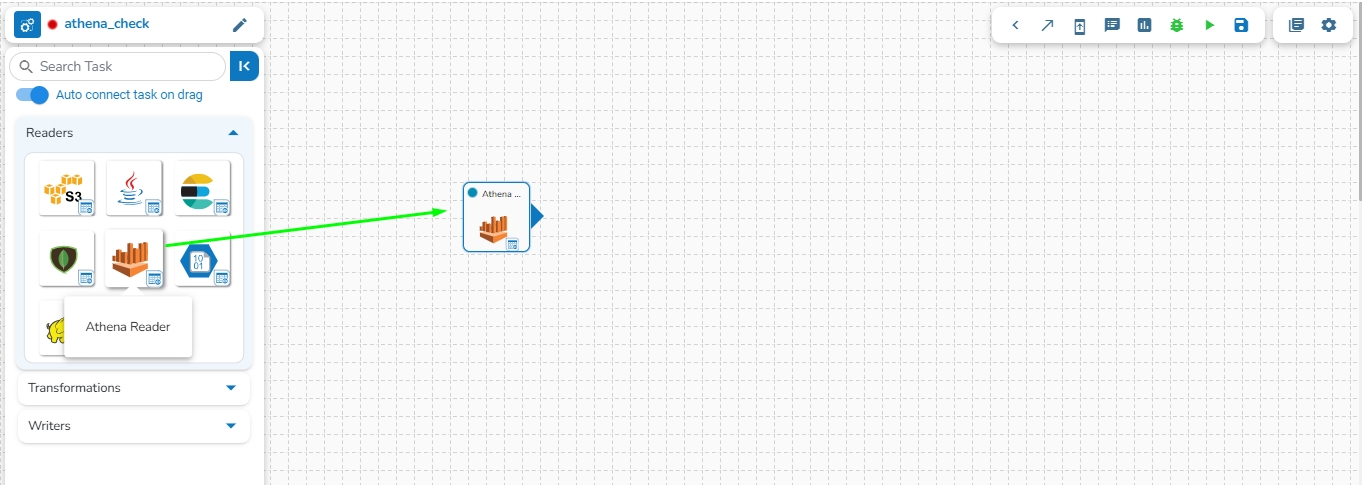
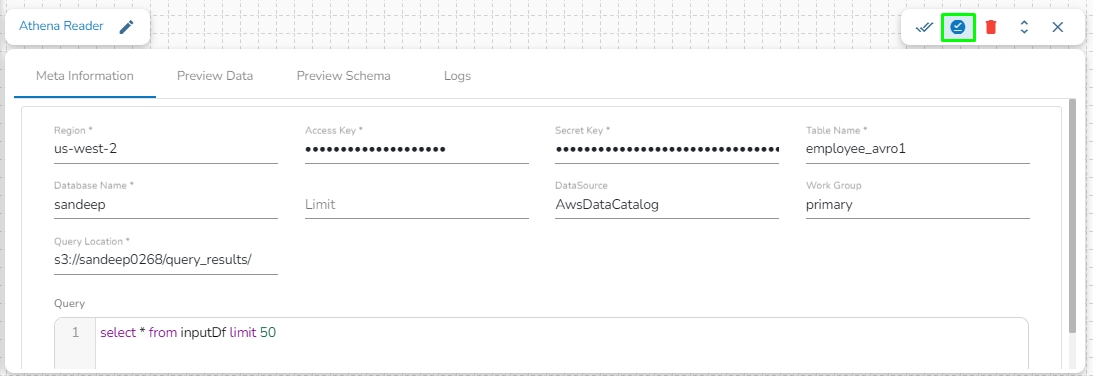
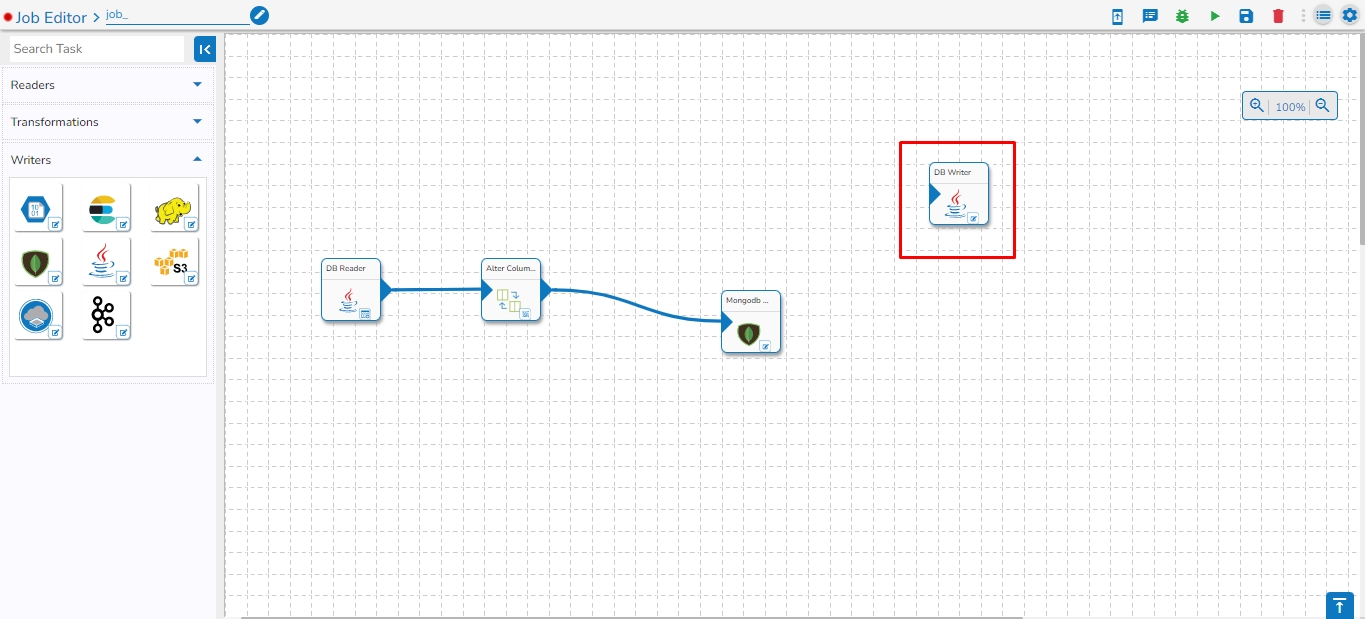
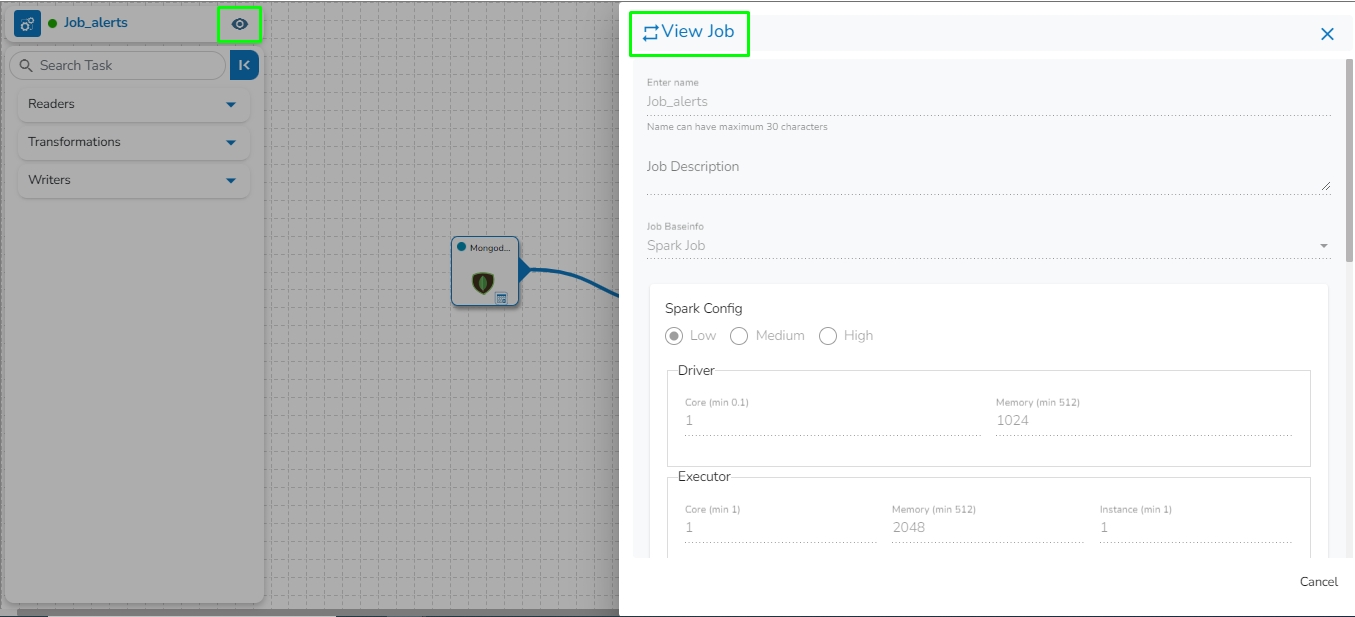
The List Pipelines option opens the available Pipeline List for the logged-in user. All the saved pipelines by a user are listed on this page. Please refer to the below image for reference:
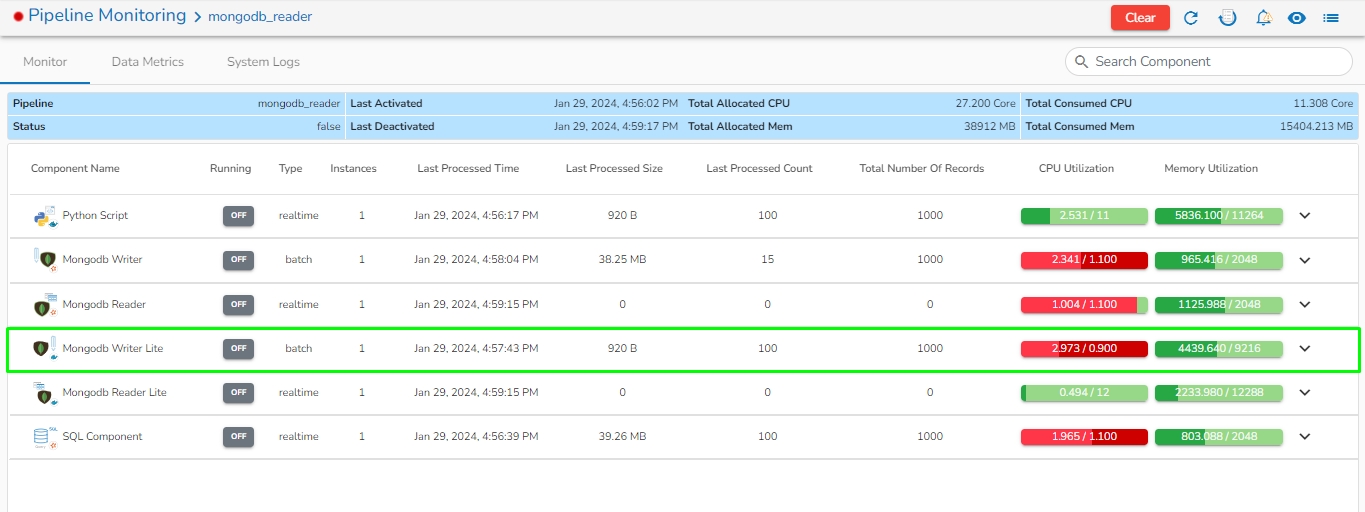
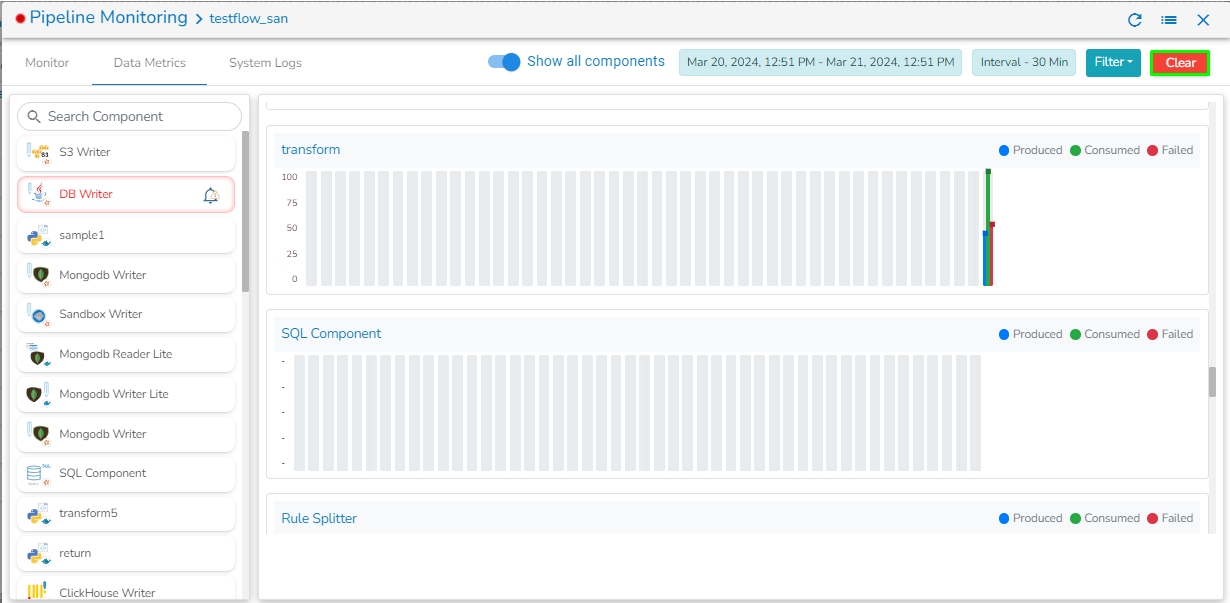
Full Day (24 hours)
Long (48 hours)
Week (168 hours)


The non-admin users get to access the list of pipelines created by them or shared with them by the other users.
The Pin and Unpin feature allows users to prioritize and easily access specific pipelines within a list. This functionality is beneficial for managing tasks, projects, or workflows efficiently. This feature is available on each pipeline card in the list view.
Navigate to the List Pipelines page.
Select a Pipeline from the list that you wish to pin.
Click the Pin icon provided for the selected pipeline.
The Pipeline gets pinned to the list and it will be moved to the top of the list if it is the first pinned pipeline.
The user can pin multiple pipelines to the list.
Click the Unpin icon for a pinned pipeline.
The pipeline will be unpinned from the list.
Navigate to the Pipeline List page.
Select a data pipeline from the displayed list.
Click the Push & Pull Pipeline icon for the selected data pipeline.
The Push/ Pull drawer appears. It displays the name of the selected Pipeline. E.g., In the following image the Push/ Pull Restaurant Analysis WK5 heading, the Restaurant Analysis WK5 is the name of the selected Pipeline.
Provide a Commit Message (required) for the data pipeline version.
Select a Push Type out of the below-given choices to push the pipeline:
Version Control: For versioning of the pipeline in the same environment. In this case, the selected Push Type is Version Control.
GIT Export (Migration): This is for pipeline migration. The pushed pipeline can be migrated to the destination environment from the migration window in the Admin Module.
Click the Save option.
Based on the selected Push Type the pipeline gets moved to Git or VCS, and a notification message appears to confirm the completion of the action.
Check out the illustrations below on the Version Control and Pipeline Migration functionalities.
Version Control:
Pipeline Migration:
The Pull feature helps users pull the previously moved versions of a pipeline from the VCS. Thus, it can help the users significantly to recover the lost pipelines or avoid unwanted modifications made to the pipeline.
Check out the walk-through on how to pull a pipeline version from the VCS.
Navigate to the Pipeline List page.
Select a data pipeline from the displayed list.
Click the Pull from GIT icon for the selected data pipeline.
The Push/ Pull drawer opens with the selected Pipeline name.
Select the data pipeline version by marking the given checkbox.
Click the Save option.
A notification appears to inform that the selected pipeline workflow is imported.
Clicking on the View icon will direct the user to the pipeline workflow editor page.
Navigate to the Pipeline List page.
Select a Pipeline from the list.
Click the View icon.
The Pipeline Editor page opens for that pipeline.
The user can search for a specific pipeline by using the Search bar on the Pipeline List. By typing a common name all the existing pipelines having that word will be listed. E.g., By typing the letters 'resta' all the existing pipelines with those letters get listed.
Click on the pipeline to view the information of the pipeline on the list pipeline page. Once clicked on the pipeline name, a menu will open on the right side of the screen showing all the details of the selected pipeline.
Please look at the demonstration to understand how the Pipeline details are displayed on the List Pipelines page.
By clicking on a pipeline name, the following details of that pipeline will appear below in two tabs:
The Pipeline Details panel displays key metadata: the creator, last updater, last activation timestamp, and last deactivation timestamp. This information helps users track changes and manage their workflows effectively.
Components: Number of components used in the pipeline.
Created: Indicates the Pipeline owner's name (with Date and Time stamp).
Updated: Name of the person who has updated the pipeline (with Date and Time stamp).
Last Activated: Displays the person's name who last activated the pipeline (with Date and Time stamp).
Last Deactivated: Displays the person's name who last deactivated the pipeline (with Date and Time stamp).
Description: This field will show the description of the pipeline if given by the pipeline owner.
Total Component Config
Total Allocated Max CPU: The maximum allocated CPU in cores.
Total Allocated Min CPU: The minimum allocated CPU in cores.
Total Allocated Max Memory: The maximum allocated memory in MB.
Total Allocated Min Memory: The minimum allocated memory in MB.
This section displays the component that has been failed or ignored in the selected pipeline workflow.
Users can click the Failed Components & Ignored Components options to display the failed or ignored component names. The information icon provided next to the names of the Failed or Ignored components will redirect the user to get more information about those components.
Navigate to the Failed and Ignored Components section for a pipeline.
Click the Ignore Failure Components icon provided for Failed Components.
The Confirm dialog box opens.
Use the Comment space to comment on the Failed component.
Click the Yes option to ignore the Failed Components.
Check out the illustration on the Pipeline Component Configuration page.
Navigate to the Pipeline List page.
Select a Pipeline from the list.
Click the Pipeline Component Configuration icon.
The configuration page will list all the components used in the selected pipeline. The Basic Info tab opens by default.
Click the Configuration tab to access the pipeline components' configuration details. The user may modify the details and update it using the Save option.
Users can share a pipeline with one or multiple users and user Groups using the Share Pipeline option.
Check out the following walk-through on how to share a pipeline with user/ user group and exclude the user from a shared pipeline.
Click the List Pipelines icon to open the Pipeline List.
Select a Pipeline from the pipeline list.
Click on the Share Pipeline icon.
The Share Pipeline window opens.
Select an option from the given choices: User (the default tab) and User Group or Exclude User (the Exclude User option can be chosen if the pipeline is already shared with a user/user group and you wish to exclude them from the privilege).
Select a user or user(s) from the displayed list of users (In case of the User Group(s) tab, it displays the names of the User Groups.
Click the arrow to move the selected User(s)/ User Group(s).
The selected user(s)/user group(s) get moved to the box given on the right (In case of the Exclude User option the selected user/ the user moved to the right-side box looses the access of the shared pipeline).
Click the Save option.
Privilege for the selected pipeline gets updated and the same gets communicated through a message.
By completing the steps mentioned above, the concerned pipeline gets successfully shared with the selected user/user group or the selected users can also be excluded from their privileges for the concerned pipeline.
By clicking the Pipeline Monitor icon, the user will be redirected to the Pipeline Monitoring page.
Navigate to the List Pipelines page.
Select a Pipeline from the list.
Click the Pipeline Monitor icon.
The user gets redirected to the Pipeline Monitoring page of the selected Pipeline. The Monitor tab opens by default.
Click the expand icon to display the monitor page in detail.
The user may click on the Data Metrics and System Logs tabs to get more details on the pipeline.
Failure analysis is a central failure mechanism. Here, the user can identify the failure reason. Failure of any pipeline stored at a particular location (collection). From there you can query your failed data in the Failure Analysis UI. It displays the failed records, cause, event time, and pipeline ID.
Check out the illustration to access the Failure Analysis for a selected Pipeline.
Navigate to the Pipeline List page.
Select a Pipeline with Failed status from the list.
Click on the Failure Analysis icon.
The user gets redirected to the Failure Analysis page.
The user can further get the failure analysis of the specific component that failed in the pipeline workflow.
Use the ellipsis icon to get redirected to the Monitoring and Data Metrics options for a component.
Navigate to the List Pipelines page.
Select a Pipeline from the list.
Click the Delete Pipeline icon for the pipeline.
The Confirm dialog box appears to confirm the action.
Click the YES option to confirm the deletion.
The selected Pipeline gets removed from the list.
The user can activate/deactivate the pipeline by clicking on the Activate/ Deactivate icon.
Click the List Pipelines icon to open the Pipeline list.
Select a Pipeline from the pipeline list.
Click on the Activate Pipeline icon.
The Confirmation dialog box opens to get the confirmation for the action.
Click the YES option.
A confirmation message appears.
The pipeline gets activated. The Activate Pipeline icon turns into Deactivate Pipeline.
The Status option diaplays UP and turns green in color.
Click the Deactivate Pipeline icon to deactivate the pipeline.
The Confirmation dialog box opens to get the confirmation for the action.
Click the YES option.
A confirmation message appears.
The pipeline gets deactivated. The Deactivate Actions icon turns Activate.
The same gets communicated through the color of the Status icon which displays OFF and turns Gray.

