A Kafka event refers to a single piece of data or message that is exchanged between producers and consumers in a Kafka messaging system. Kafka events are also known as records or messages. They typically consist of a key, a value, and metadata such as the topic and partition. Producers publish events to Kafka topics, and consumers subscribe to these topics to consume events. Kafka events are often used for real-time data streaming, messaging, and event-driven architectures.
Check out the given illustration to understand how to create a Kafka Event.
Navigate to the Pipeline Editor page.
Click on the Event Panel option in the pipeline toolbar and Click on Add New Event icon.
The New Event window opens.
Provide a name for the new Event.
Select Event Duration: Select an option from the below-given options.
Short (4 hours)
Medium (8 hours)
Half Day (12 hours)
Full Day (24 hours)
Long (48 hours)
Week (168 hours)
Please Note: The event data gets erased after 7 days if no duration option is selected from the available options. The Offsets expire as well.
No. of Partitions: Enter a value between 1 to 100. The default number of partitions is 3.
No. of Outputs: Define the number of outputs using this field.
Is Failover: Enable this option to create the event as the Failover Event. If a Failover Event is created, it must be mapped with a component to retrieve failed data from that component.
Click the "Add Event" option.
The Event will be created successfully, and the newly created Event is added to the Kafka Events tab in the Events panel.
Once the Kafka Event is created, the user can drag it to the pipeline workspace and connect it to any component.
On hovering over the event in the pipeline workspace, the user can see the following information for that event.
Event Name
Duration
Number of Partitions
The user can edit the following information of the Kafka Event after dragging it to the pipeline workspace:
Display Name
No. of Outputs
Is Failover
A Failover Event is designed to capture data that a component in the pipeline fails to process. In cases where a connected event's data cannot be processed successfully by a component, the failed data is sent to the Failover Event.
Follow these steps to map a Failover Event with the component in the pipeline:
Create a Failover Event following the provided steps.
Drag the Failover Event to the pipeline workspace.
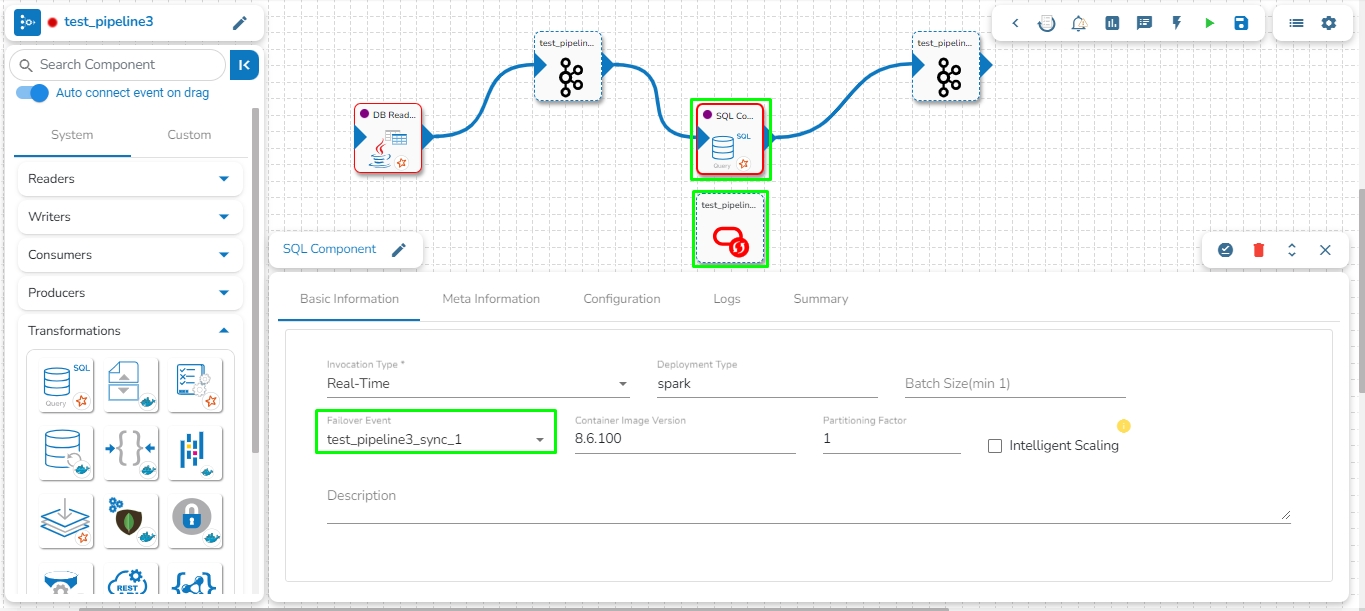
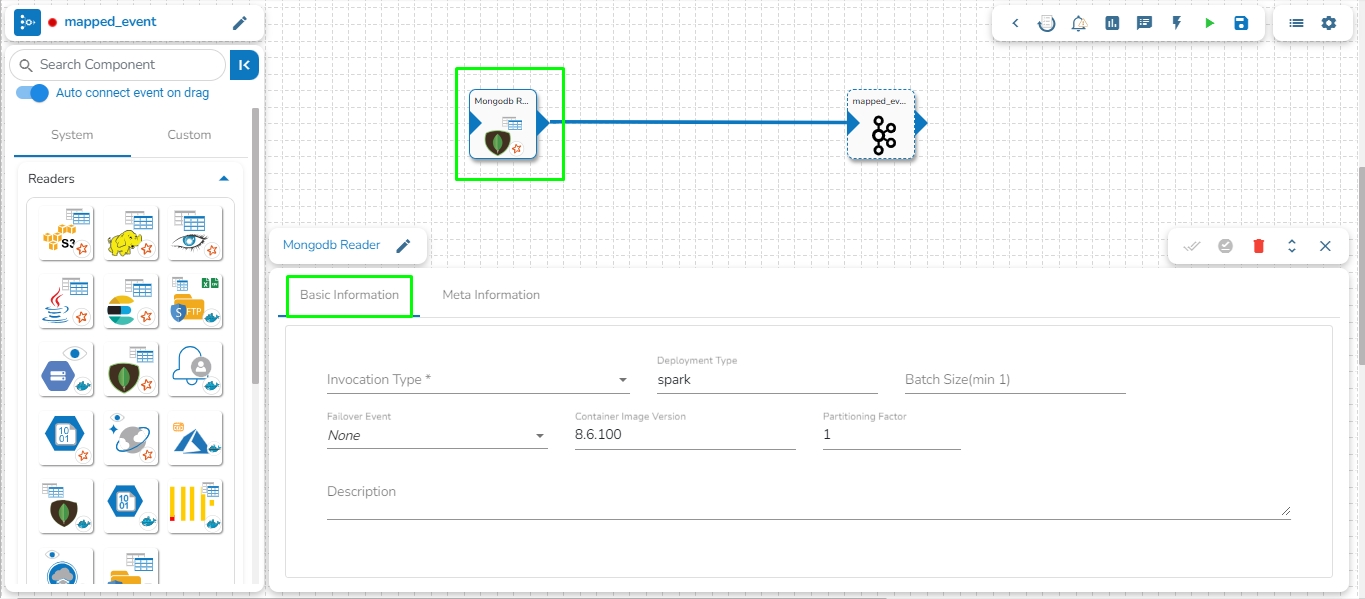
Navigate to the Basic Information tab of the desired component where the Failover Event should be mapped.
From the drop-down, select the Failover Event.
Save the component configuration.
The Failover Event is now successfully mapped. If the component encounters processing failures with data from its preceding event, the failed data will be directed to the Failover Event.
The Failover Event holds the following keys along with the failed data:
Cause: Cause of failure.
eventTime: Date and Time at which the data gets failed.
When hovering over the Failover Event, the associated component in the pipeline will be highlighted. Refer to the image below for visual reference.
Please see the below-given video on how to map a Failover Event.
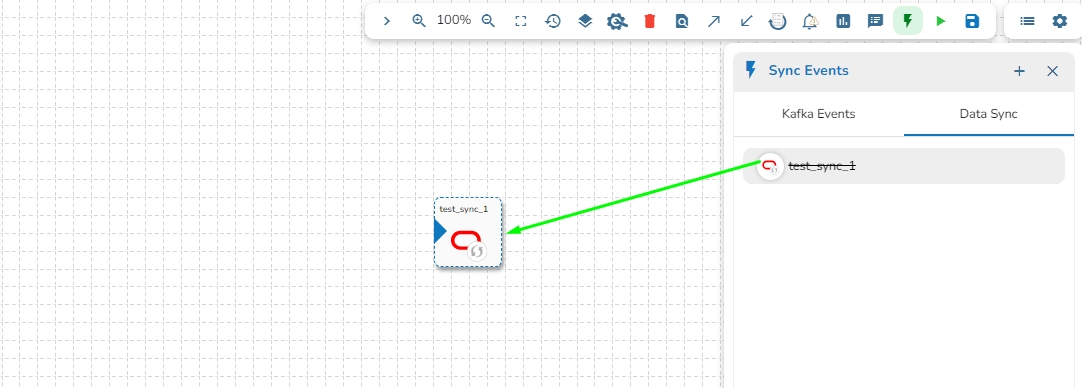
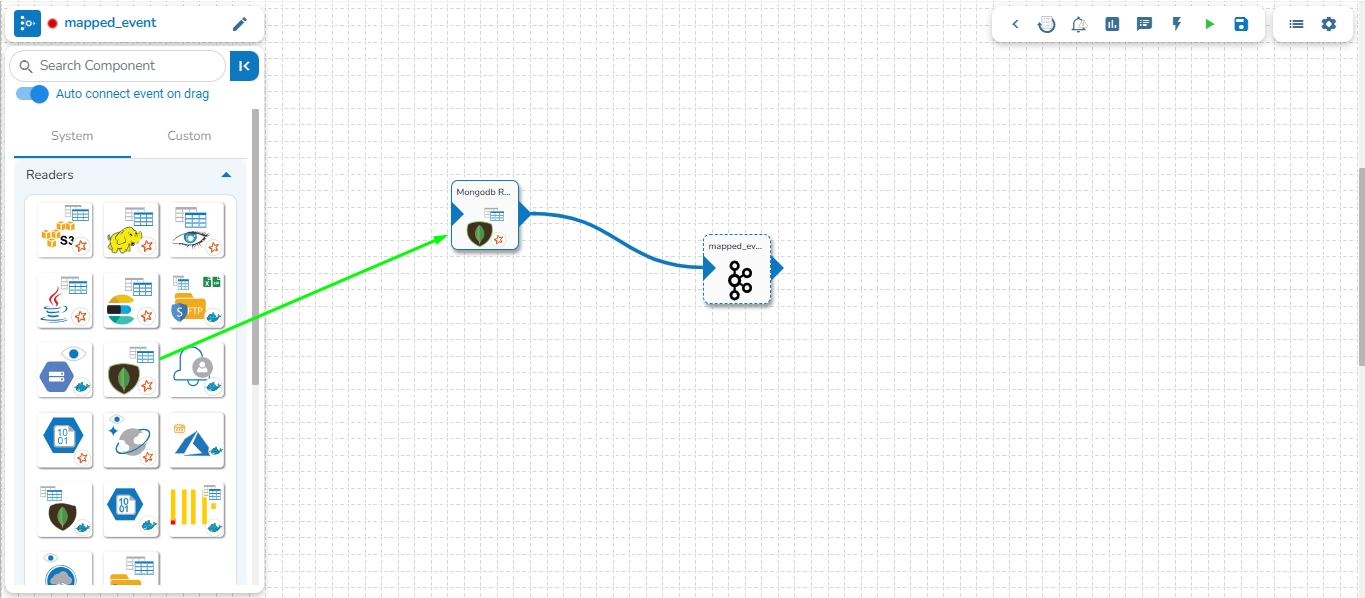
This feature automatically connects the Kafka/Data Sync Event to the component when dragged from the events panel. In order to use this feature, users need to ensure that the Auto connect components on drag option is enabled from the Events panel.
Please see the below-given illustrations on auto connecting a Kafka and Data Sync Event to a pipeline component.
This feature allows user to directly connect a Kafka/Data Sync event to a component by right clicking on the component in the pipeline.
Follow these steps to directly connect a Kafka/Data Sync event to a component in the pipeline:
Right-click on the component in the pipeline.
Select the Add Kafka Event or Add Sync Event option.
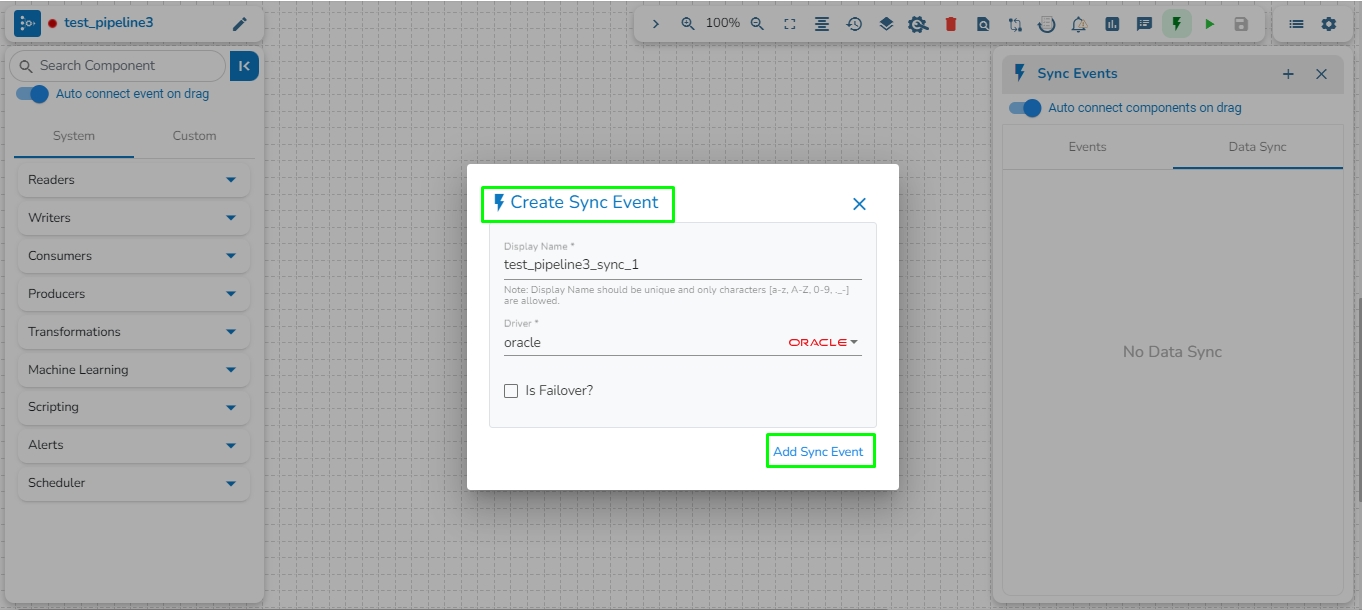
The Create Kafka Event or Create Sync Event dialog box will open.
Enter the required details.
Click on the Add Kafka Event or Create Sync Event option.
The newly created Kafka/Data Sync Event will be directly connected to the component.
Please see the below-given illustrations on how to add a Kafka and Data Sync Event to a pipeline workflow.
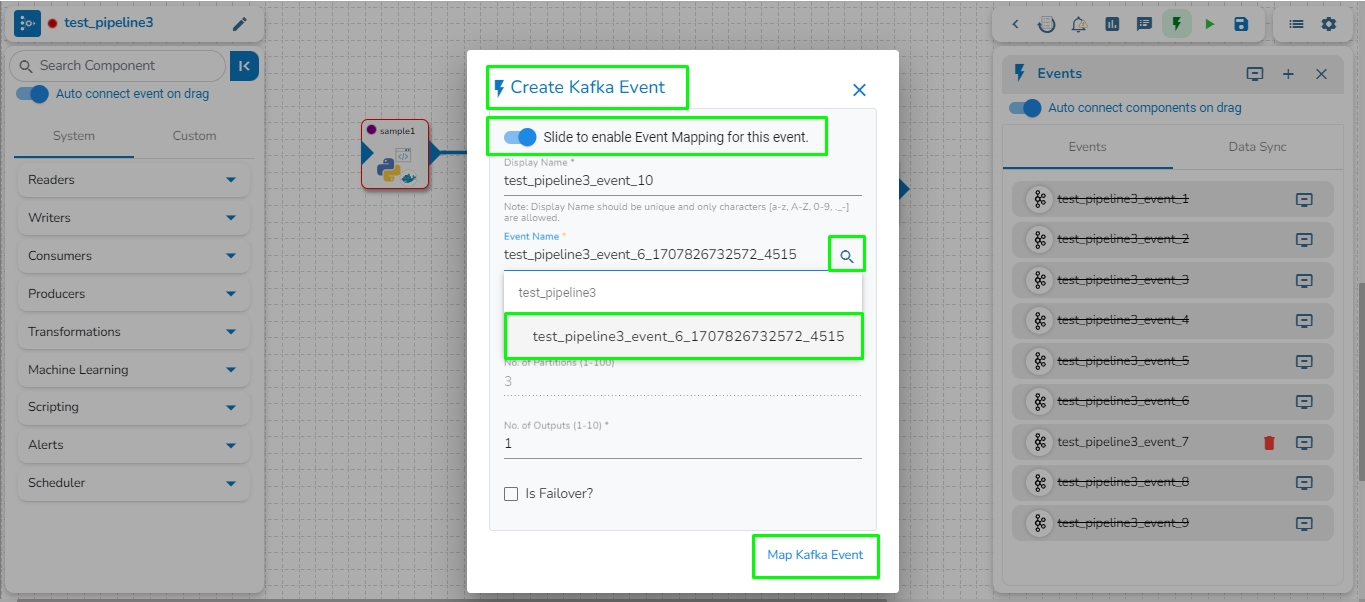
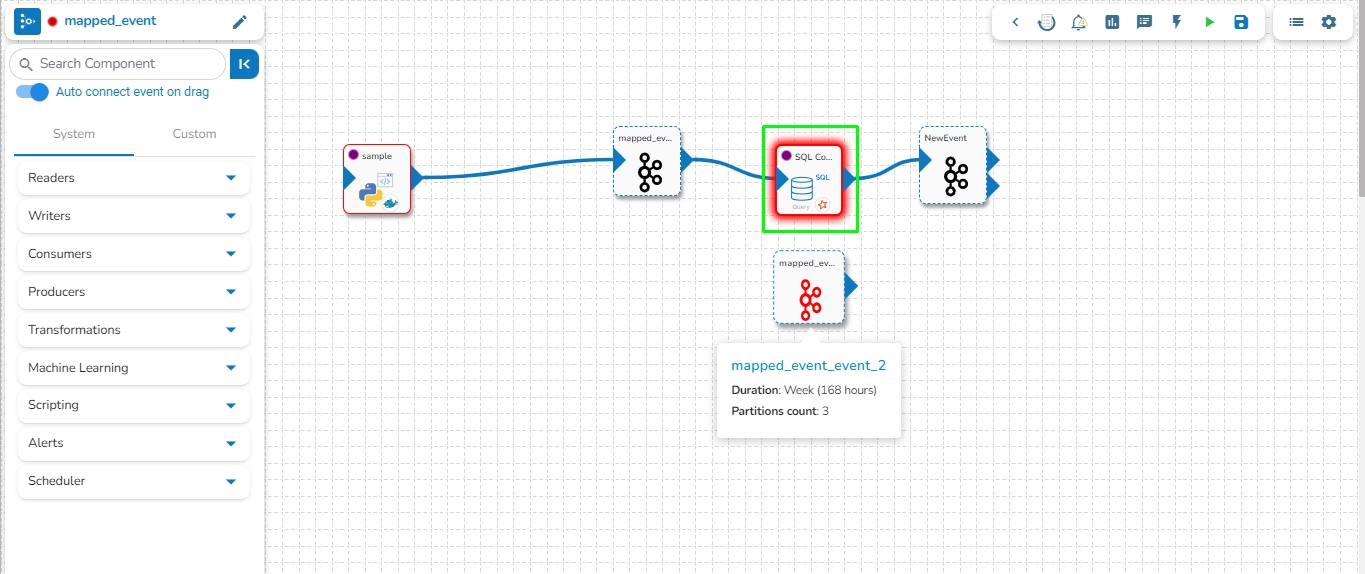
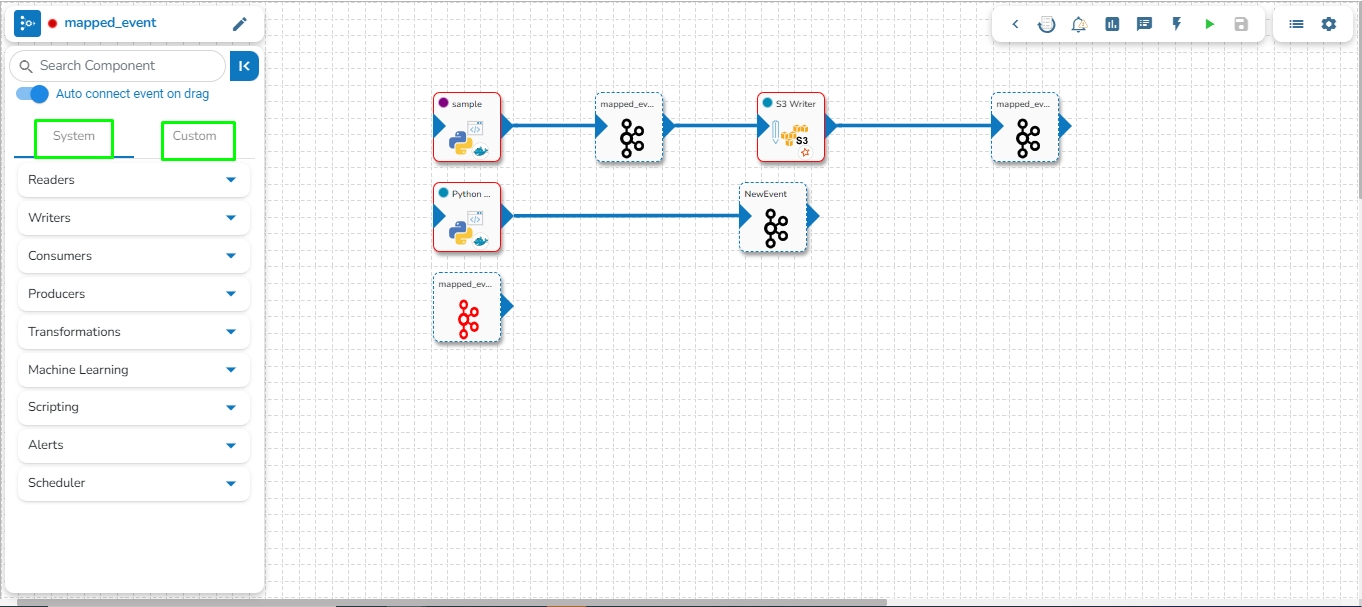
This feature enables users to map a Kafka Event with another Kafka event. In this scenario, the mapped event will have the same data as its source event.
Please see the below-given illustrations on how to create mapped Kafka Event.
Follow these steps to create a mapped event in the pipeline:
Choose the Kafka event from the pipeline as the source event for which mapped events need to be created.
Open the events panel from the pipeline toolbar and select the "Add New Event" option.
In the Create Kafka Event dialog box, enable the option at the top to enable mapping for this event.
Enter the Source Event Name in the Event name and click on the search icon to select the name of the source event from the suggestions.
The Event Duration and No. of Partitions will be automatically filled in the same as the source event. Users can modify the No. of Outputs between 1 to 10 for the mapped event.
Click on the Map Kafka Event option to create the Mapped Event.
Please Note: The data of the Mapped Event itself cannot be directly flushed. To clear the data of a Mapped Event, the user needs to flush the Source Event to which it is mapped.
Please go through the below-given steps to check the meta information and download the data from the Kafka topic once the data has been sent to the Kafka event by the producer. The user can download the data from the Kafka event in CSV, Excel, and JSON format. The user will find the following tabs in the Kafka topic:
This tab displays information such as Display Name, Event Name, No. of Partitions, No. of Outputs, Event Duration, etc.
Navigate to the meta information tab to view details such as the Number Of Records in the Kafka topic, Approximate Data Size, Number of Partitions, Approximate Partition Size (in MB), Start and End Offset of partition, and Total Records in each partition.
Navigate to the Preview tab for a pipeline workflow using an Event component. Preferably select a pipeline workflow that has been activated to get data.
It will display the Data Preview.
Please Note:
Users can preview, download, and copy up to 100 data entries.
Click the Download icon to download the data in CSV, JSON, or Excel format.
Click on the Copy option to copy the data as a list of dictionaries.
Data Type icons are provided in each column header to indicate the data type. The icons help users quickly understand the contained data type in each column. The following icons are added:
String
Number
Date
DateTime
Float
Boolean
Users can drag and drop column separators to adjust column widths, allowing for a personalized view of the data.
This feature helps accommodate various data lengths and user preferences.
The event data is displayed in a structured table format.
The table supports sorting and filtering to enhance data usability. The previewed data can be filtered based on the Latest, Beginning, and Timestamp options.
The Timestamp filter option redirects the user to select a timestamp from the Time Range window. The user can either select a start and end date or choose from the available time ranges to apply and get a data preview.
Check out the illustration on sorting and filtering the Event Data Preview for a Pipeline workflow.
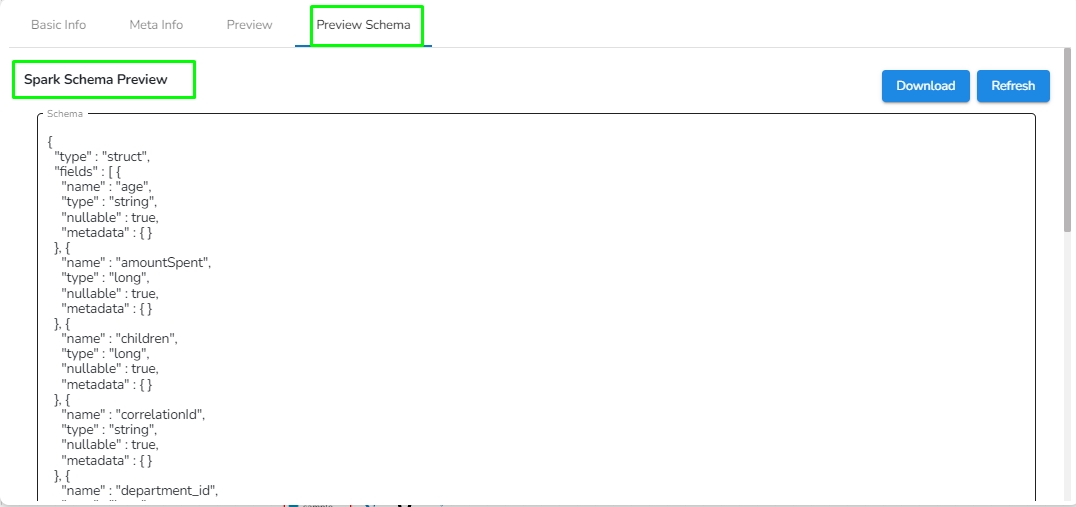
This tab holds the Spark schema of the data. Users can download the Spark schema of the data by clicking on the download option.
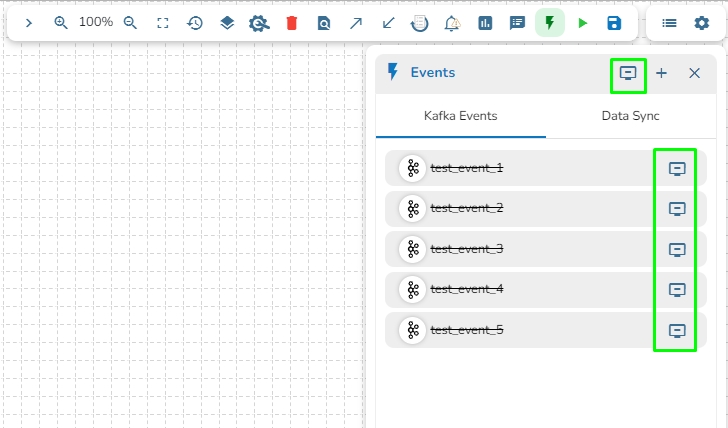
Kafka Events can be flushed to delete all present records. Flushing an Event retains the offsets of the topic by setting the start-offset value to the end-offset. Events can be flushed by using the Flush Event button beside the respective Event in the Event panel, and all Events can be flushed at once by using the Flush All button. This button is also present at the top of the Event panel.
Check out the given illustration on how to Auto connect a Kafka Event to a pipeline component.
Drag any component to the pipeline workspace.
Configure all the parameters/fields of the dragged component.
Drag the Event from the Events Panel. Once the Kafka event is dragged from the Events panel, it will automatically connect with the nearest component in the pipeline workspace. Please find the below given walk through for the reference.
Click the Update Pipeline icon to save the pipeline workflow.
Data Sync Event in the Data Pipeline module is used to write the required data directly to the any of the databases without using the Kafka Event and writer components in the pipeline. Please refer the below image for reference:
It can be seen in the above image that Data Event will directly write the data read from the MongoDB reader component to the table of the configured Database in the Data Sync without using a Kafka Event in-between.
It doesn't need Kafka event to read the data. It can be connected with any component to read the data and it writes it to the tables of respective databases.
Pipeline complexity is reduced because Kafka event and writer is not needed to use in the pipeline.
Since, writers are not used, the resource consumption are low.
Once Data sync are configured, multiple Data Sync events can be created for the same configuration and the data can be written to multiple tables.
Pre-requisite: Before Creating the Data Sync Event, the user has to configure the Data Sync section under the Settings page.
DB Sync Event enables direct write to the DB that helps in reducing the usage of additional compute resources like Writers in the Pipeline Workflow.
Please Note: The supported drivers for the Data Sync component are as listed below:
ClickHouse
MongoDB
MSSQL
MySQL
Oracle
PostgreSQL
Snowflake
Redshift
Check out the given video on how to create a Data Sync component and connect it with a Pipeline component.
Navigate to the Pipeline Editor page.
Click on the DB Sync tab.
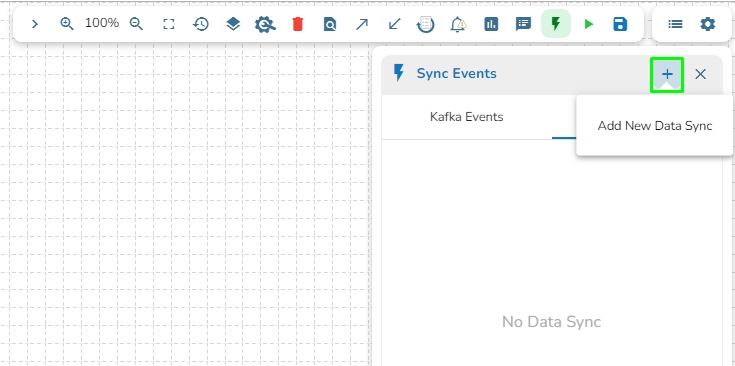
Click on the Add New Data Sync (+) icon from the Toggle Event Panel.
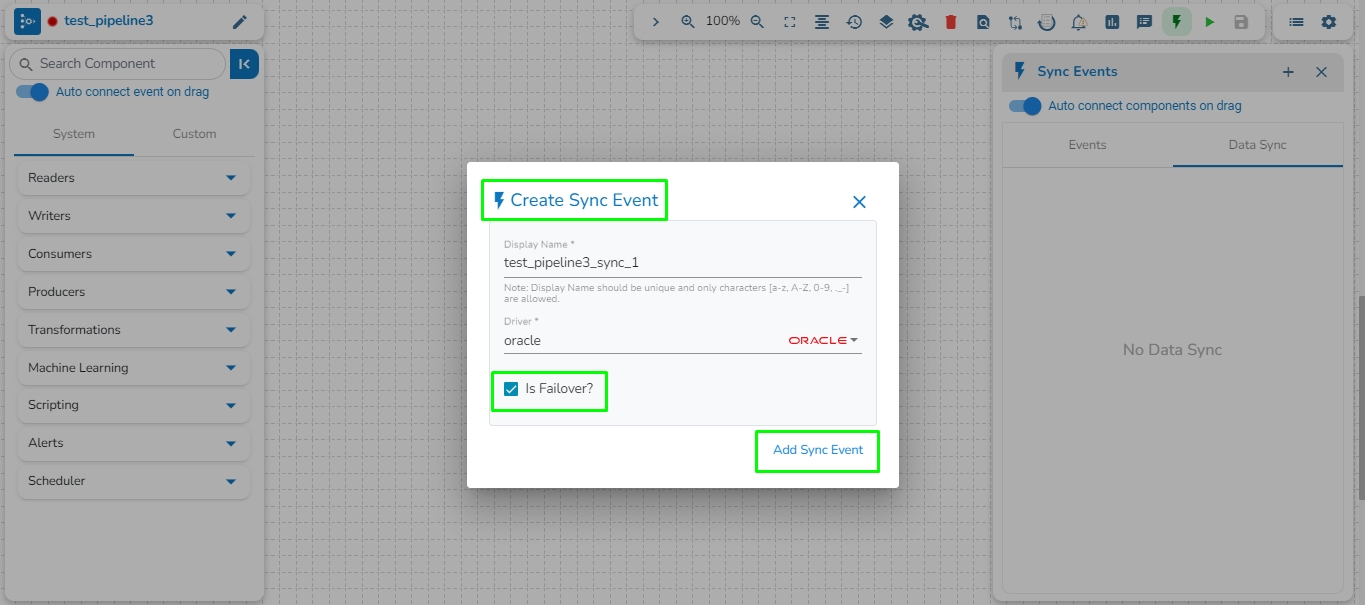
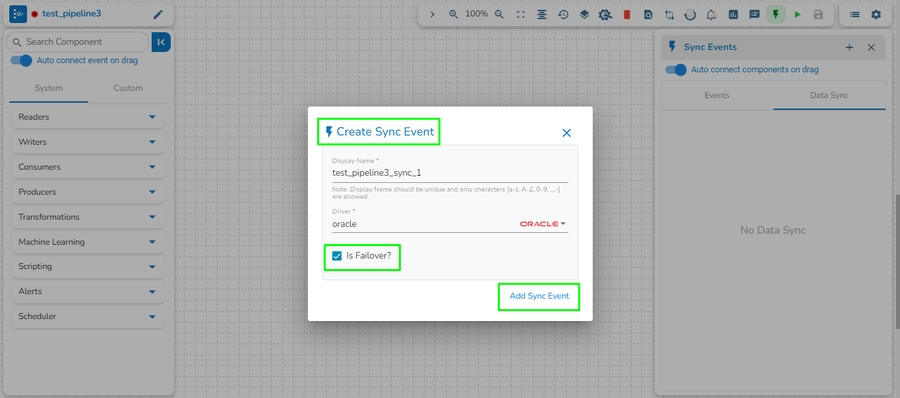
The Create Data Sync window opens.
Provide a display name for the new Data Sync.
Select the Driver
Put a checkmark in the Is Failover option to create a failover Data Sync. In this case, it is not enabled.
Click the Save option.
Please Note:
Only the configured drivers from the Settings page get listed under the Create Data Sync wizard.
The Data Sync component gets created as Failover Data Sync, if the Is Failover option is enabled while creating a Data Sync.
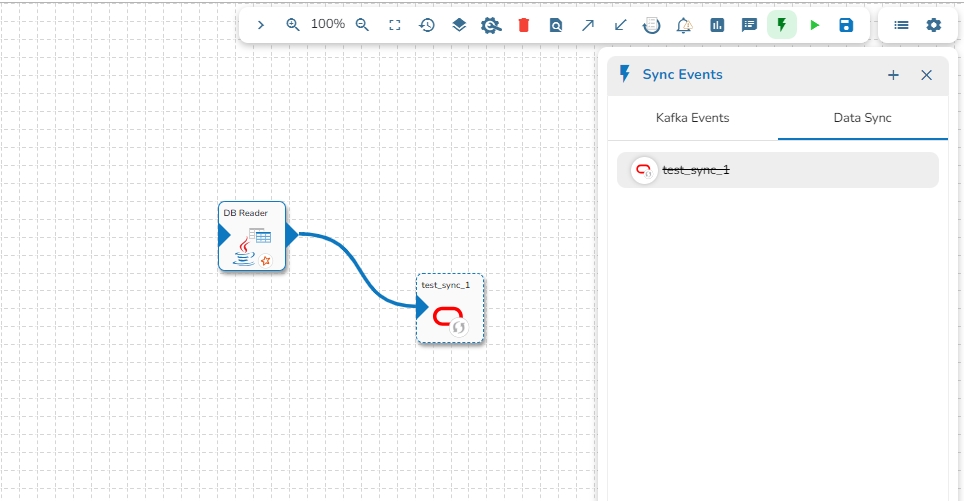
Drag and drop Data Sync Event to the workflow editor.
Click on the dragged Data Sync component.
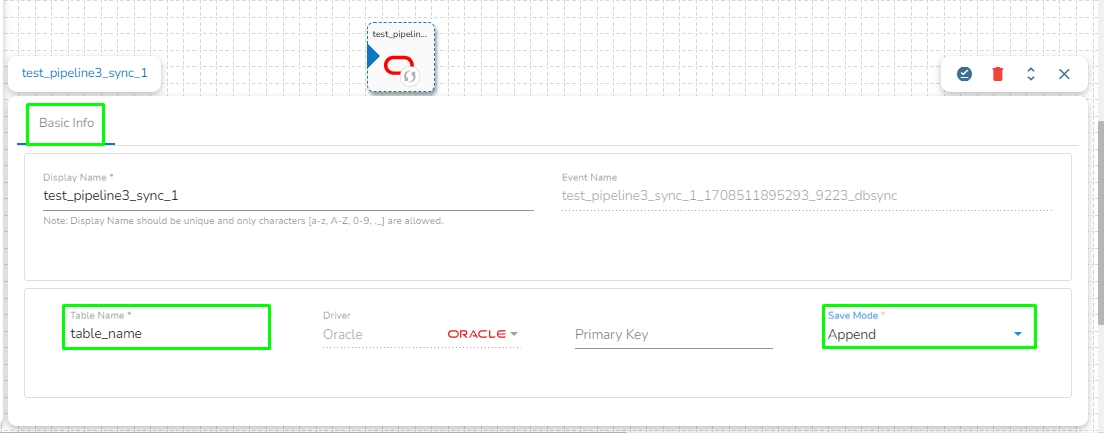
The Basic Information tab appears with the following fields:
Display Name: Display name of the Data Sync
Event Name: Event name of the Data Sync
Table name: Specify table name.
Driver: This field will be pre-selected.
Save Mode: Select save mode from the drop-down: Append or Upsert.
Composite Key: This field is optional. This field will only appear when upsert is selected as the Save Mode.
Click on the Save Data Sync icon to save the Data Sync information.
Once the Data Sync Event is dragged from the Events panel, it will automatically connect with the nearest component in the pipeline workflow.
Update and activate the pipeline.
Open the Logs tab to view whether the data gets written to a specified table.
Please Note:
In the Save mode, there are two available options.
Append
Upsert: One extra field will be displayed for upsert save mode i.e. Composite Key.
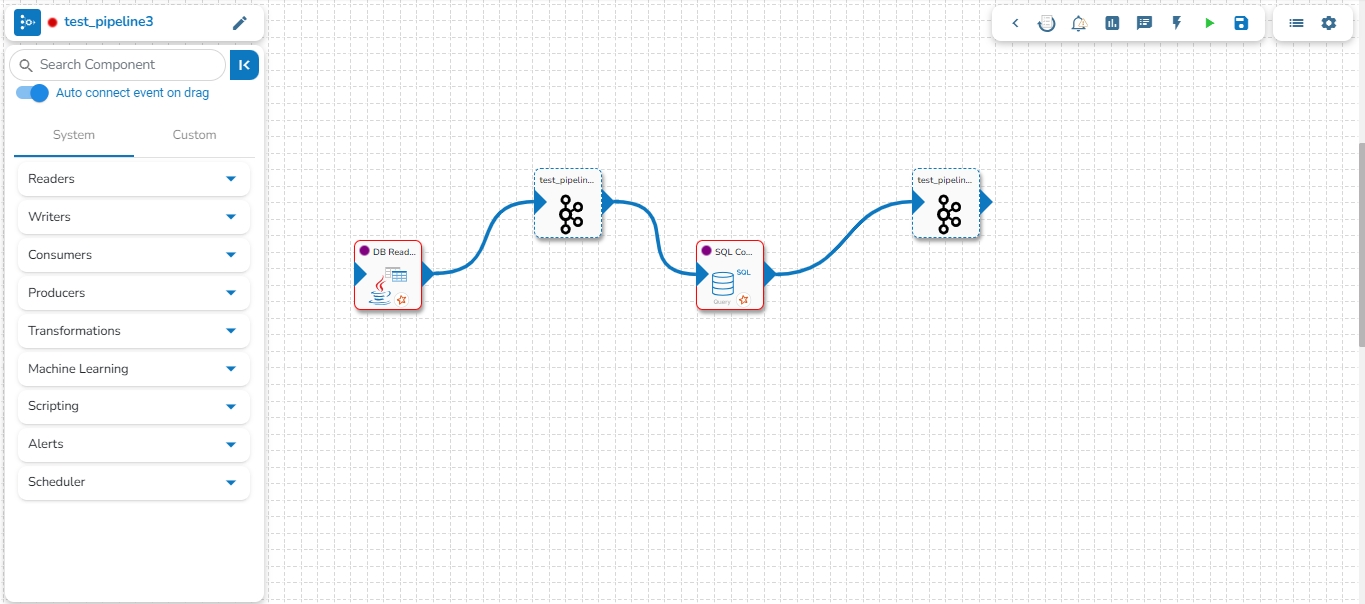
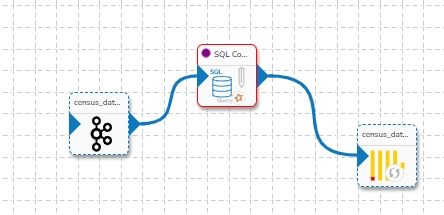
When the SQL component is set to Aggregate Query mode and connected to Data Sync, the data resulting from the query will not be written to the Data Sync Event. Please refer to the following image for a visual representation of the flow and avoid using such scenario.
The Events Panel appears on the right side of the Pipeline Workflow Editor page.
Click on the Data Sync tab.
Click on the Add New Data Sync (+) icon from the Toggle Event Panel.
The Create Data Sync dialog box opens.
Provide the Display Name and
Enable the Is Failover option.
Click the Save option.
The failover Data Sync will be created successfully.
Drag & drop the failover data sync to the pipeline workflow editor.
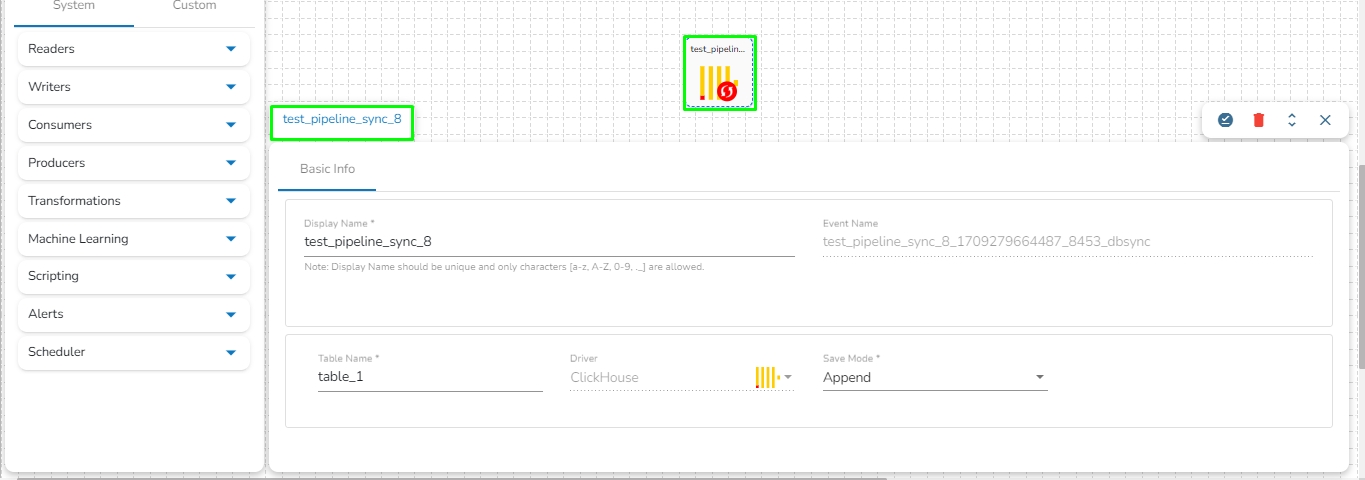
Click on the failover Data Sync and fill in the following field:
Table name: Enter the table name where the failed data has to be written.
Primary key: Enter the column name to be made as the primary key in the table. This field is optional.
Save mode: Select a save mode from the given choices. Select either Append or Upsert.
The failover Data Sync Event gets configured, and now the user can map it with any component in the pipeline workflow.
The image displays that the failover Data Sync Event is mapped with the SQL Component.
If the component fails, it will write all the data to the given table of the configured DB in the Failover Data Sync.
Please Note: There is no information available on UI that the failover Data Sync Event has been configured while hovering on the failover Data Sync Event.
Click the Toggle Event Panelicon from the header.
The Events Panel appears, and the Toggle Event Panel icon gets changed as, suggesting that the event panel is displayed.
Click the Event Panelicon from the Pipeline Editor page.
This section focuses on the Configuration tab provided for any Pipeline component.
For each component that gets deployed, we have an option to configure the resources i.e., Memory and CPU.
We have two deployment types:
Docker
Spark
Go through the given illustration to understand how to configure a component using the Docker deployment type.
After we save the component and pipeline, the component gets saved with the default configuration of the pipeline i.e., Low, Medium, and High. After we save the pipeline, we can see the configuration tab in the component. There are multiple things.
For the Docker components, we have the Request and Limit configurations.
We can see the CPU and Memory options to be configured.
CPU: This is the CPU configuration where we can specify the number of cores that we need to assign to the component.
Please Note: 1000 means 1 core in the configuration of docker components. When we put 100 that means 0.1 core has been assigned to the component.
Memory: This option is to specify how much memory you want to dedicate to that specific component.
Please Note: 1024 means 1GB in the configuration of the docker components.
Instances: The number of instances is used for parallel processing. If we give N no. of instances those many pods will get deployed.
Go through the below given walk-through to understand the steps to configure a component with Spark configuration type.
The Spark Components configuration is slightly different from the Docker components. When the spark components are deployed, there are two pods that come up:
Driver
Executor
Provide the Driver and executor configurations separately.
Instances: The number of instances is used for parallel processing. If we give N no. of instances in executors configuration those many executors pods will get deployed.
Please Note: Till the current release, the minimum requirement to deploy a driver is 0.1 Cores and 1 core for the executor. It can change with the upcoming versions of Spark.
Adding components to a pipeline workflow.
Check out the below given walk-through to add components to Pipeline Workflow editor canvas.
The Component Pallet is situated on the left side of the User Interface on the Pipeline Workflow. It has the System and Custom components tabs listing the various components.
The System components are displayed in the below given image:
Once the Pipeline gets saved in the pipeline list, the user can add components to the canvas. The user can drag the required components to the canvas and configure it to create a Pipeline workflow or Data flow.
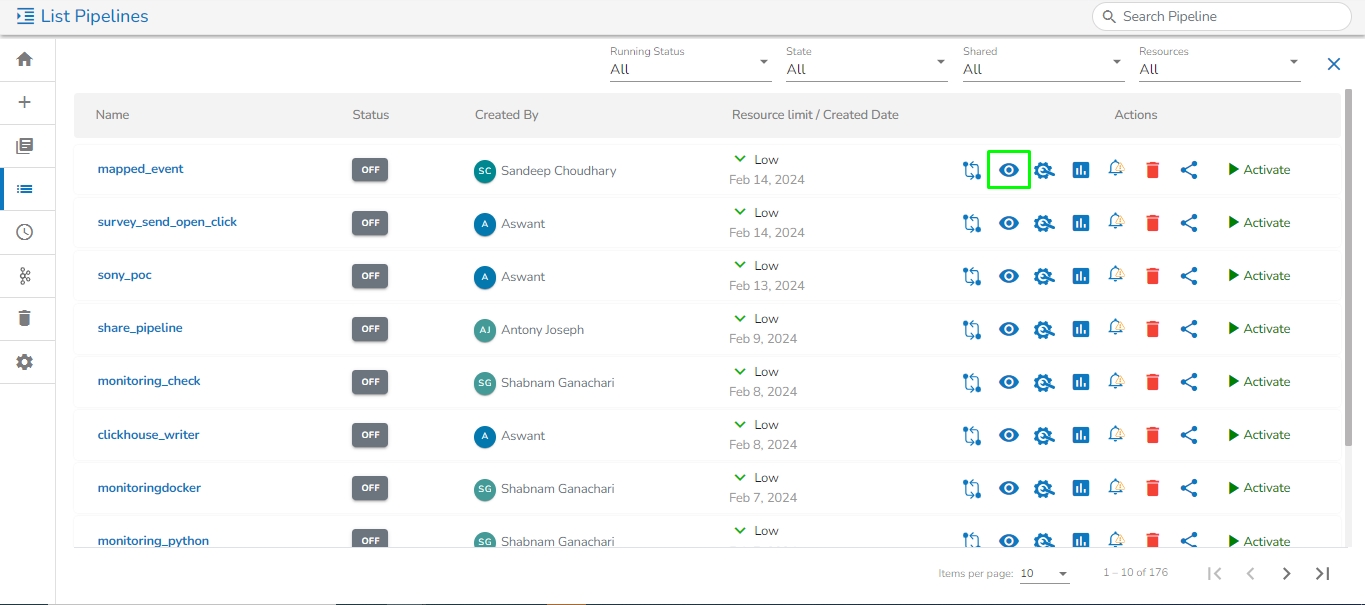
Navigate to the existing data pipeline from the List Pipelines page.
Click the View icon for the pipeline.
The Pipeline Editor opens for the selected pipeline.
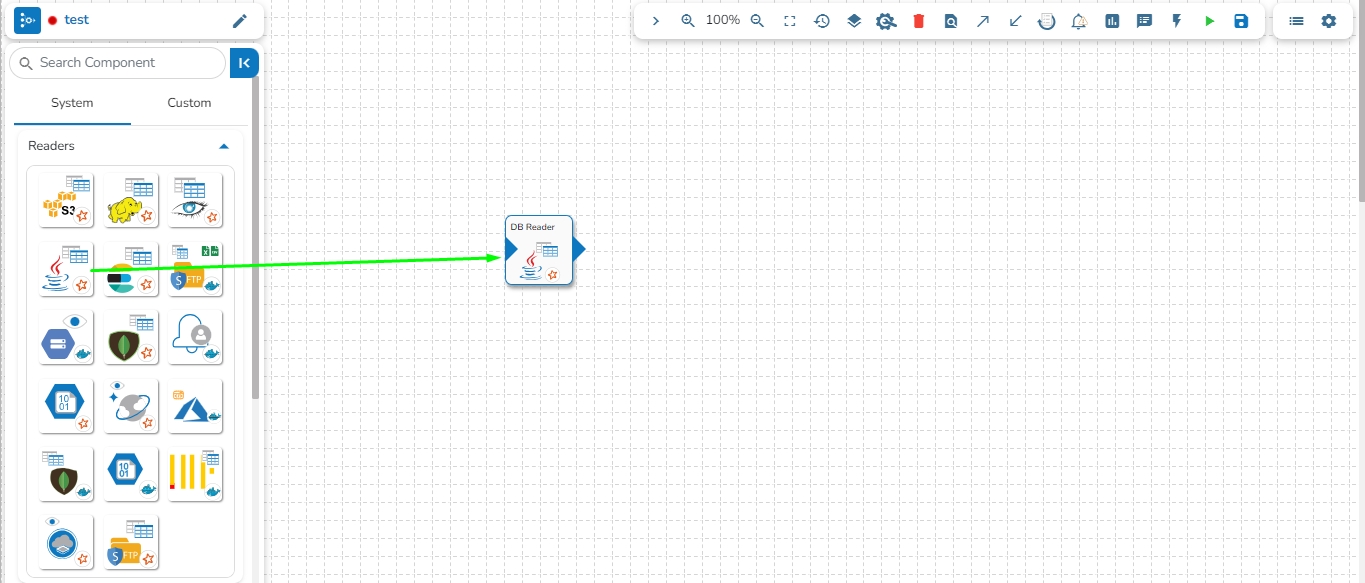
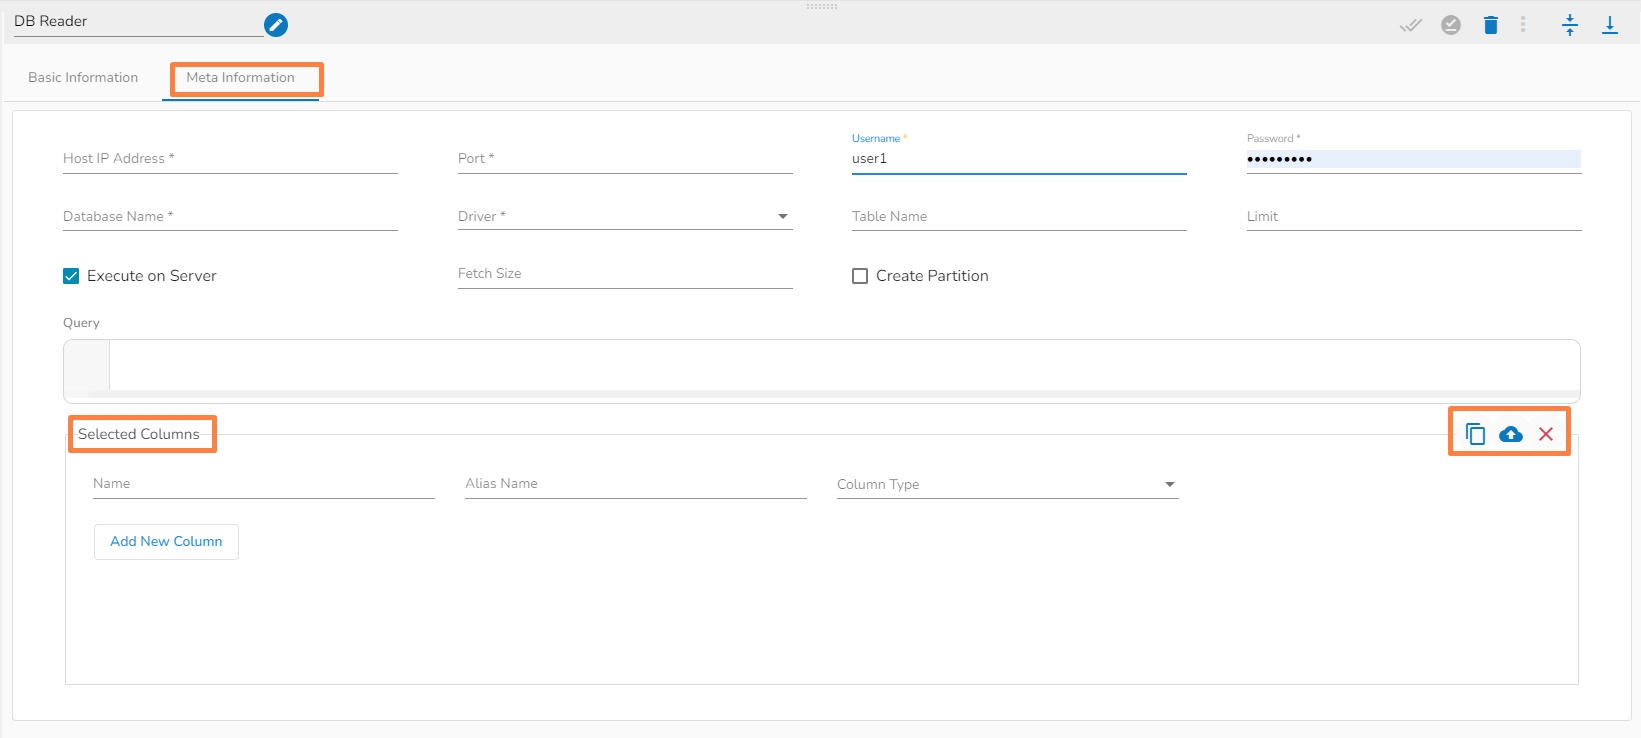
Drag and drop the new required components or make changes in the existing component’s meta information or change the component configuration (E.g., the DB Reader is dragged to the workspace in the below-given image).
Once dragged and dropped to the pipeline workspace, components can be directly connected to the nearest Kafka Event. To enable the auto-connect feature, the user needs to ensure that the Auto connect event on drag option is enabled, which is the default setting.
Please refer to the Event page for more details on creating Kafka Events and connecting them to components using various methods.
Click on the dragged component and configure the Basic Information tab, which opens by default.
Open the Meta Information tab, which is next to the Basic Information tab, and configure it.
Make sure to click the Save Component in Storage icon to update the component details and pipeline to reflect the recent changes in the pipeline. (The user can drag and configure other required components to create the Pipeline Workflow.
Click the Update Pipeline icon to save the changes.
A success message appears to assure that the pipeline has been successfully updated.
Click the Activate Pipeline icon to activate the pipeline (It appears only after the newly created pipeline gets successfully updated).
A dialog window opens to confirm the action of pipeline activation.
Click the YES option to activate the pipeline.
A success message appears confirming the activation of the pipeline.
Another success message appears to confirm that the pipeline has been updated.
The Status for the pipeline gets changed on the Pipeline List page.
Please Note:
Click the Delete icon from the Pipeline Editor page to delete the selected pipeline. The deleted Pipeline gets removed from the Pipeline list.
Refer to the Component Panel section to get detailed information on the each Pipeline Component.
An event-driven architecture uses events to trigger and communicate between decoupled services and is common in modern applications built with microservices.
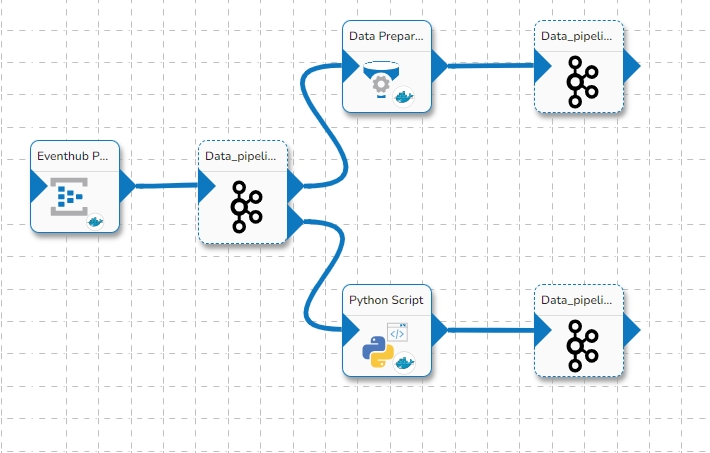
The connecting components help to assemble various pipeline components and create a Pipeline Workflow. Just click and drag the component you want to use into the editor canvas. Connect the component output to a Kafka Event.
Once a Pipeline is created the User Interface of the Data Pipeline provides a canvas for the user to build the data flow (Pipeline Workflow).The Pipeline assembling process can be divided into two parts as mentioned below:
Adding Components to the Canvas
Adding Connecting Components (Events) to create the Data flow/ Pipeline workflow
Each components inside a pipeline are fully decoupled. Each component acts as a producer and consumer of data. The design is based on event-driven process orchestration. For passing the output of one component to another component we need an Intermediatory event. An event-driven architecture contains three items:
Event Producer [Components]
Event Stream [Event (Kafka topic/ DB Sync)
Event Consumer [Components]
This section provides the steps involved in creating a new Pipeline flow.
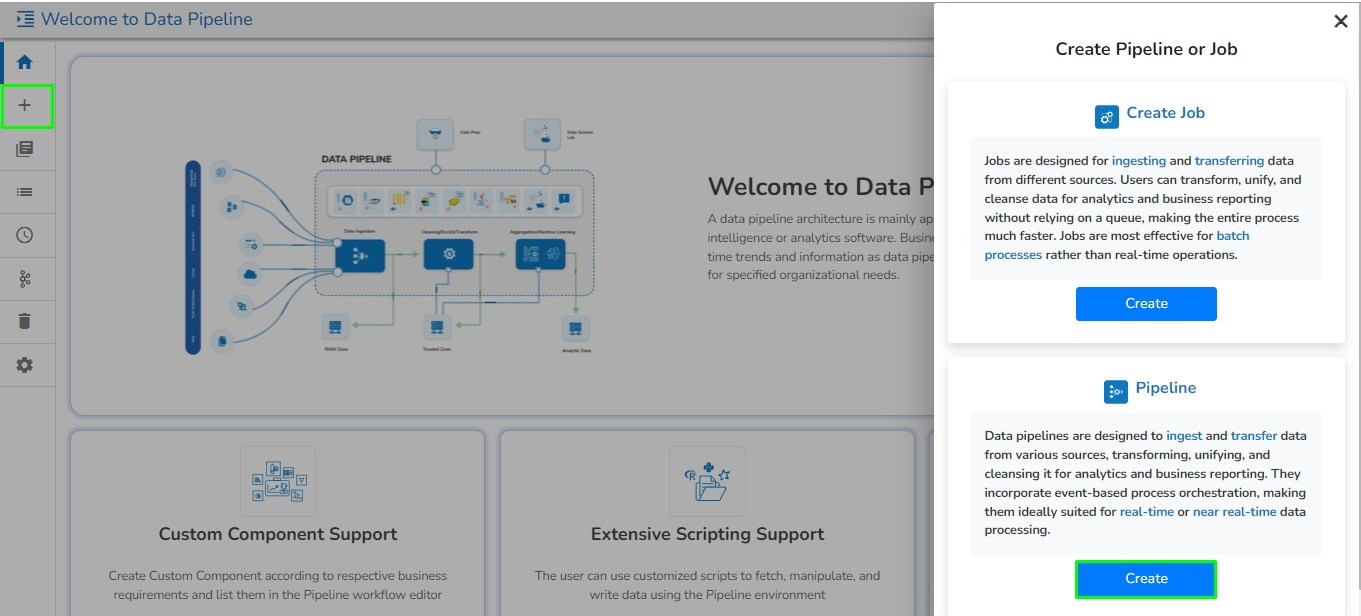
Check out the below-given illustration on how to create a new pipeline.
Navigate to the Create Pipeline or Job interface.
Click the Create option provided for Pipeline.
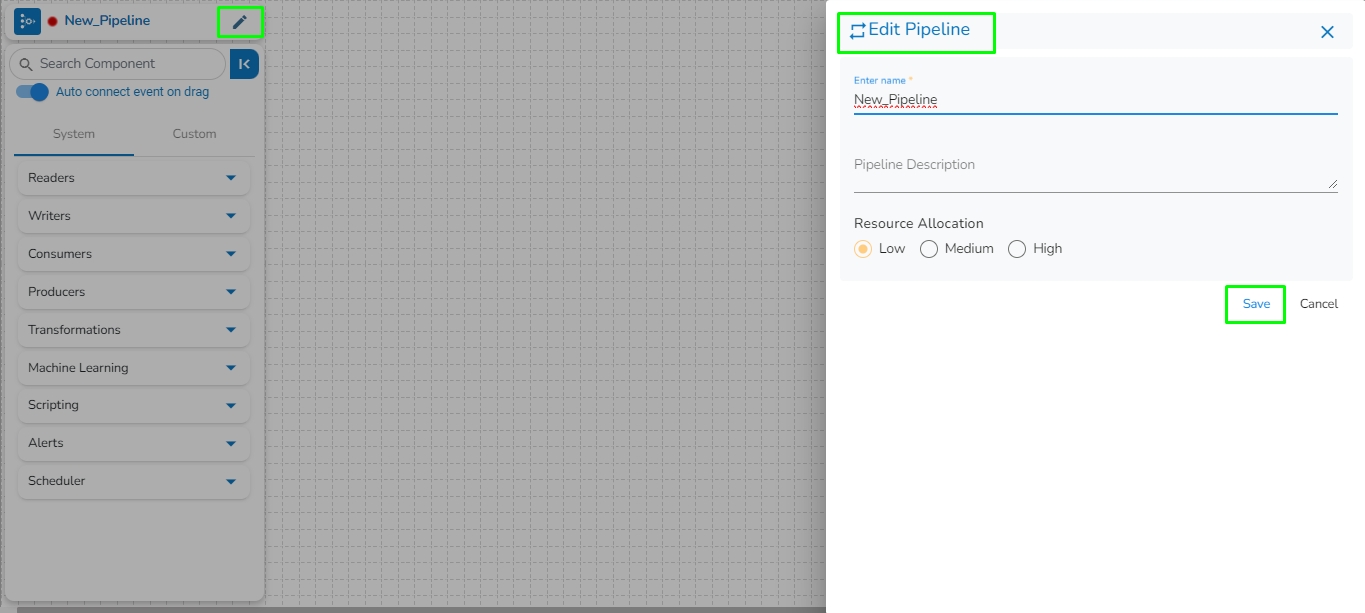
The New Pipeline window opens asking for the basic information.
Enter a name for the new Pipeline.
Describe the Pipeline (Optional).
Select a resource allocation option using the radio button- the given choices are:
Low
Medium
High
Please Note: This feature is used to deploy the pipeline with high, medium, or low-end configurations according to the velocity and volume of data that the pipeline must handle. All the components saved in the pipeline are then allocated resources based on the selected Resource Allocation option depending on the component type (Spark and Docker).
Click the Save option to create the pipeline. By clicking the Save option, the user gets redirected to the pipeline workflow editor.
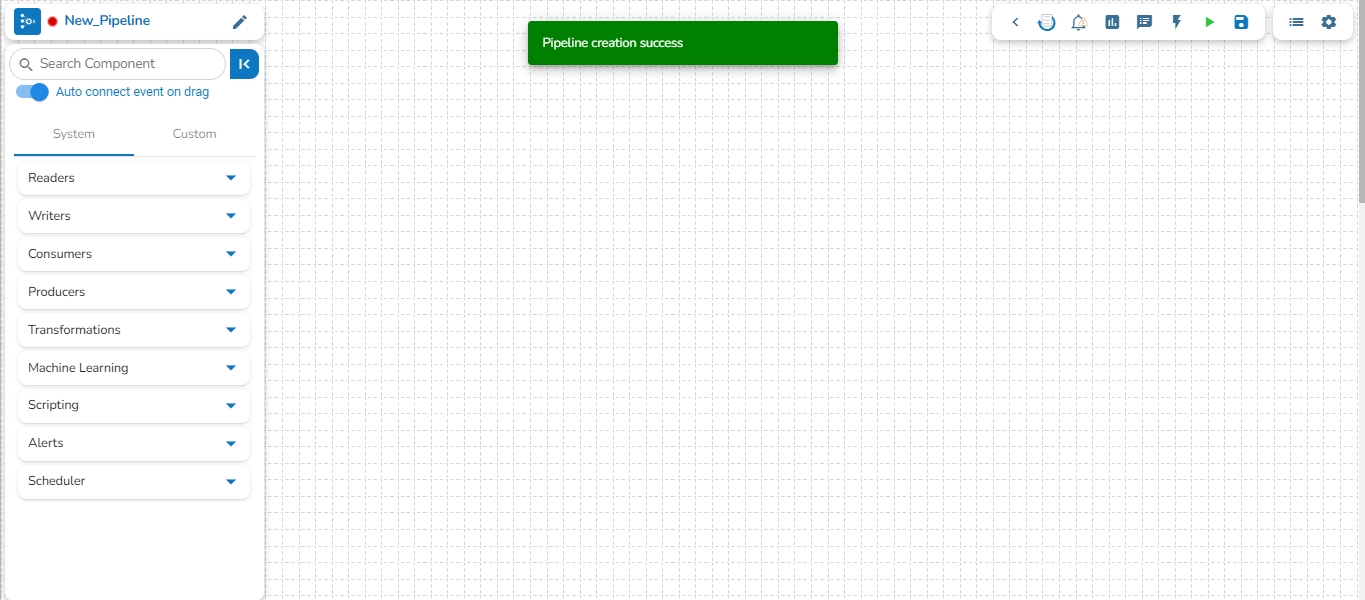
A success message appears to confirm the creation of a new pipeline.
The Pipeline Editor page opens for the newly created pipeline.
Resource allocation can be changed anytime by clicking on top left edit icon near pipeline name.


