Loading...
Loading...
Loading...
Loading...
Loading...
Loading...
Loading...
Loading...
Loading...
Loading...
Loading...
Loading...
Loading...
SQL transformer applies SQL operations to transform and manipulate data, providing flexibility and expressiveness in data transformations within a data pipeline.
The SQL component serves as a bridge between the extracted data and the desired transformed data, leveraging the power of SQL queries and database systems to enable efficient data processing and manipulation.
It also provides an option of using aggregation functions on the complete streaming data processed by the component. The user can use SQL transformations on Spark data frames with the help of this component.
All component configurations are classified broadly into the following sections:
Meta Information
Follow the given steps in the demonstration to configure the SQL transformation component.
Please Note: The schema file that can be uploaded here is a JSON spark schema.
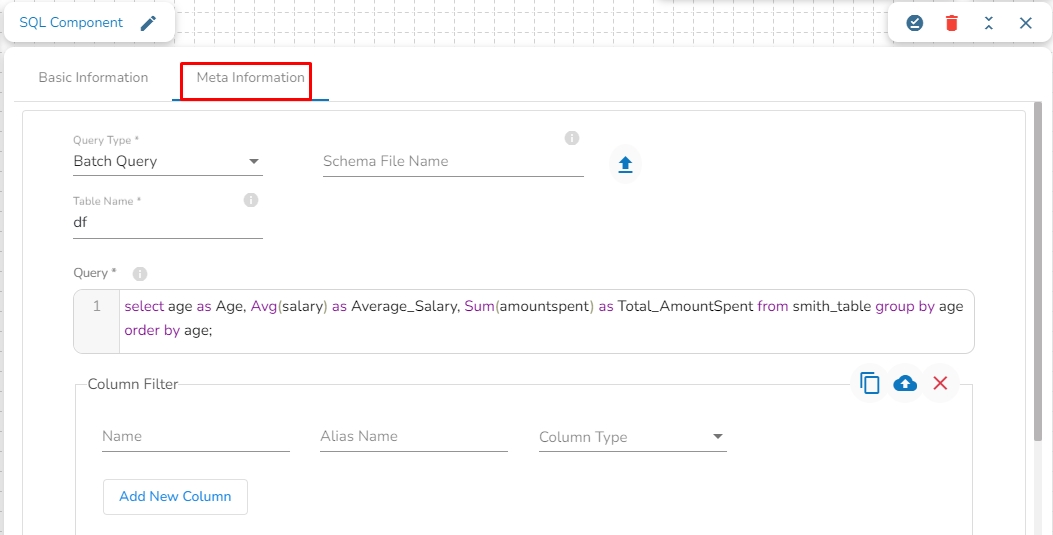
Query Type: There are two options available under this field:
Batch Query: When this option is selected, then there is no need to upload a schema file.
Aggregate Query: When this option is selected, it is mandatory to upload the spark schema file in JSON format of the in-event data.
Schema File name: Upload the spark schema file in JSON format when the Aggregate query is selected in the query type field.
Table name: Provide the table name
Query: Write an SQL query in this field.
Selected Columns: select the column name from the table, and provide the Alias name and the desired data type for that column.
Please Note: When Usging Aggregation Mode
Data Writing:
When configured for Aggregate Query mode and connected to DB Sync, the SQL component will not write data to the DB Sync event.
Monitoring:
In Aggregate mode, monitoring details for the SQL component will not be available on the monitoring page.
Running Aggregate Queries Freshly:
If you set the SQL component to Aggregate Query mode and want to run it afresh, clearing the existing event data is recommended. To achieve this:
Copy the component.
Paste the copied component to create a fresh instance.
Running the copied component ensures the query runs without including aggregations from previous runs.
The File Splitter component is designed to split one or more files based on specified conditions.
All component configurations are classified broadly into 3 section
Meta Information
Follow the given steps in the demonstration to configure the File Splitter component.
Split Type: The condition based on which the files are splitted. We have 5 supported file split type:
By File Format
By File Name
By RegExp
By Excel Sheet Name
By Excel Sheet Number
No. of Outputs: Select the total number of output(1-5)
Details: Mapping of each output to out-event.
Out Event: Event/Topic selected automatically.
File Type: Select the right file format for each of the file (PDF,CSV,EXCEL,OTHERS).
Please Note: The user will not be able to copy and paste File Splitter component in the pipeline as the Copy option has been disabled for File Splitter.
The Flatten JSON component takes complex JSON data structures and flattens them into a more simplified and tabular format.
All component configurations are classified broadly into 3 section
Meta Information
Follow the given steps in the demonstration to configure the Flatten JSON component.
Column Filter: Enter column name to read and optionally specify an alias name and column type from the drop-down menu.
Use Download Data and Upload File options to select the desired columns.
Upload File: The user can upload the existing system files (CSV, JSON) using the Upload File icon (file size must be less than 2 MB).
Download Data: Users can download the schema structure in JSON format by using the Download Data icon.
A stored procedure is a named group of SQL statements that are precompiled and stored in a database. A stored procedure runner component is designed to run pre-compiled set of instructions that is stored in a database and can be executed by a database management system on demand.
All component configurations are classified broadly into 3 section
Meta Information
Follow the given steps in the demonstration to configure the Stored Producer Runner component.
Host IP Address: Enter the Host IP Address for the selected driver.
Port: Enter the port for the given IP Address.
User name: Enter the user name for the provided database.
Password: Enter the password for the provided database.
Database name: Enter the Database name.
Procedure name: Provide the stored procedure name.
Driver: Select the driver from the drop down. There are 4 drivers supported here: MYSQL, MSSQL, Oracle, PostgreSQL.
Input Parameters: These are values passed into the stored procedure from an external application or script(with name, value and type).
Output Parameters: These are values returned by the stored procedure to the calling application or script(with name and type).
MongoDB Aggregation component allows users to group and transforms data from one or more MongoDB collections. The aggregation query pipeline consists of a series of stages that can be used to filter, group, project, sort, and transform data from MongoDB collections.
All component configurations are classified broadly into the following sections:
Meta Information
Please follow the given demonstration to configure the Mongo Aggregation component in a pipeline workflow.
Connection Type: Select the connection type from the drop-down:
Standard
SRV
Connection String
Host IP Address (*): Hadoop IP address of the host.
Port(*): Port number (It appears only with the Standard Connection Type).
Username(*): Provide username.
Password(*): Provide a valid password to access the MongoDB.
Database Name(*): Provide the name of the database from where you wish to read data.
Collection Name(*): Provide the name of the collection.
Additional Parameters: Provide the additional parameters to connect with MongoDB. This field is optional.
Enable SSL: Check this box to enable SSL for this components. MongoDB connection credentials will be different if this option is enabled.
Certificate Folder: This option will appear when the Enable SSL field is checked-in. The user has to select the certificate folder from drop down which contains the files which has been uploaded to the admin settings for connecting MongoDB with SSL. Please refer the below given images for the reference.
Script: Write the Mongo Aggregation script in this field.
Rule splitter component is designed to splits a set of data based on given conditions into smaller and more manageable data subsets.
All component configurations are classified broadly into 3 section
Meta Information
Follow the steps given in the demonstration to configure the Rule Splitter component.
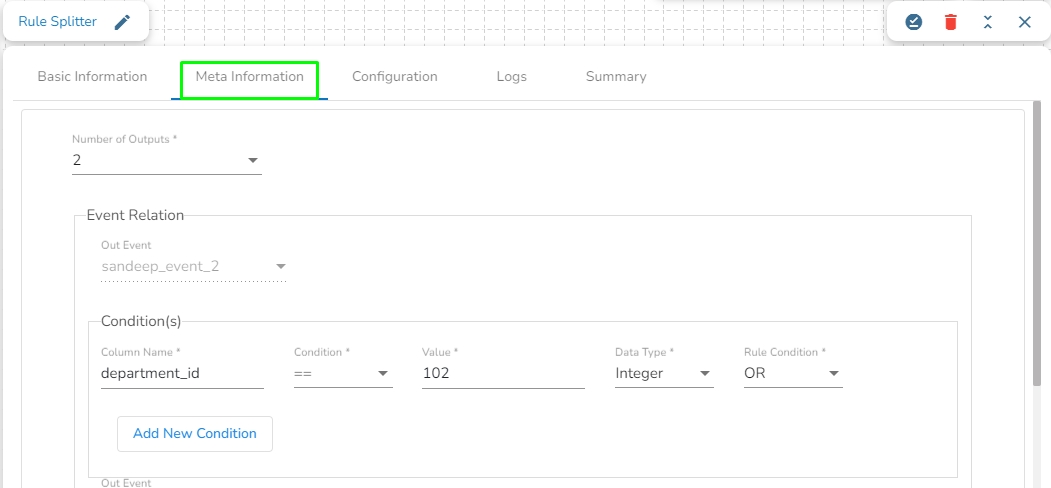
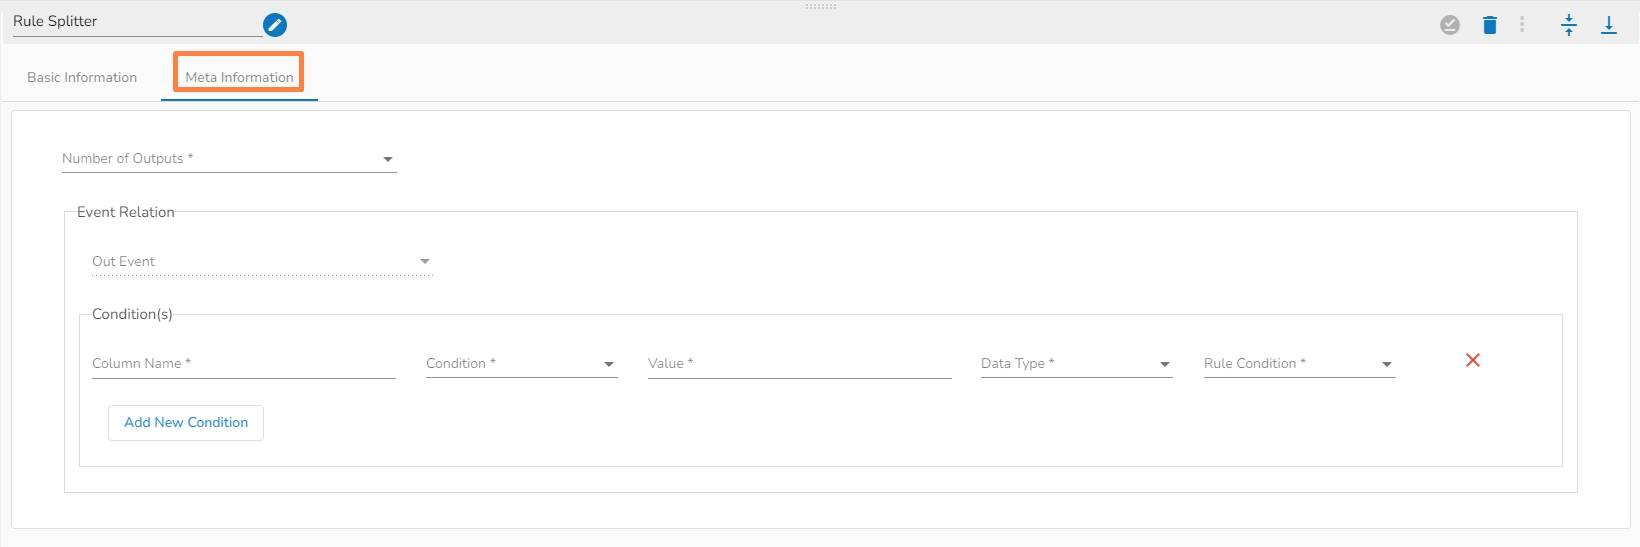
Number of outputs: The total number of sets you want to split your data into(1-7).
Event Relation
Out Event: Automatically mapped based on number of outputs(Make sure to connect this component to same count of events to that of a numbers of outputs).
Conditions: Set of rules based on which the split will happen.
Column Name: Provide column name to apply the condition on.
Condition: Select the condition from the dropdown.
We have 8 supported conditions:
>(Greater than)
<(Less than)
>=(Greater than equal to)
<=(Less than equal to)
==(Equal to)
!=(Not equal to)
BETWEEN
LIKE
Value: Give the value.
Datatype: Specify the datatype of the column you have provided.
Rule Condition: In case of multiple column conditions select from dropdown(AND,OR).
Please Note: The user will not be able to copy and paste Rule Splitter component in the pipeline as the Copy option has been disabled for Rule Splitter.
The Pandas query component is designed to filter the data by applying pandas query on it.
All component configurations are classified broadly into the following sections:
Meta Information
Follow the steps given in the demonstration to configure the Pandas Query component.
This component helps the users to get data as per the entered query.
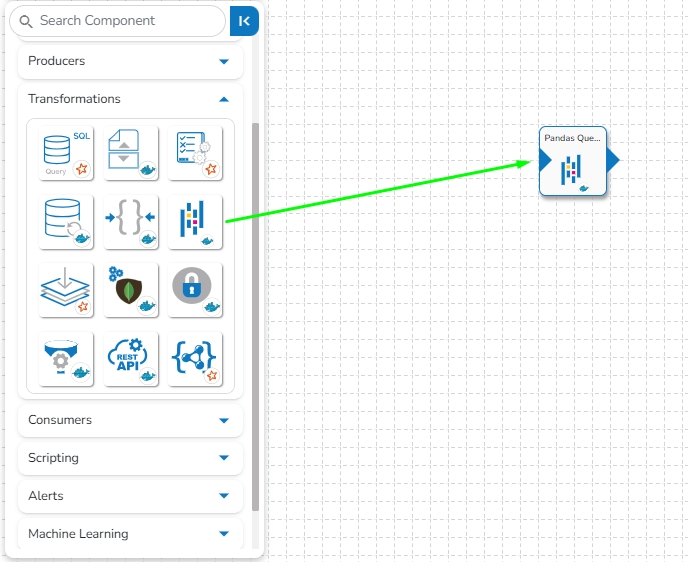
Drag and Drop the Pandas Query component to the Workflow Editor.
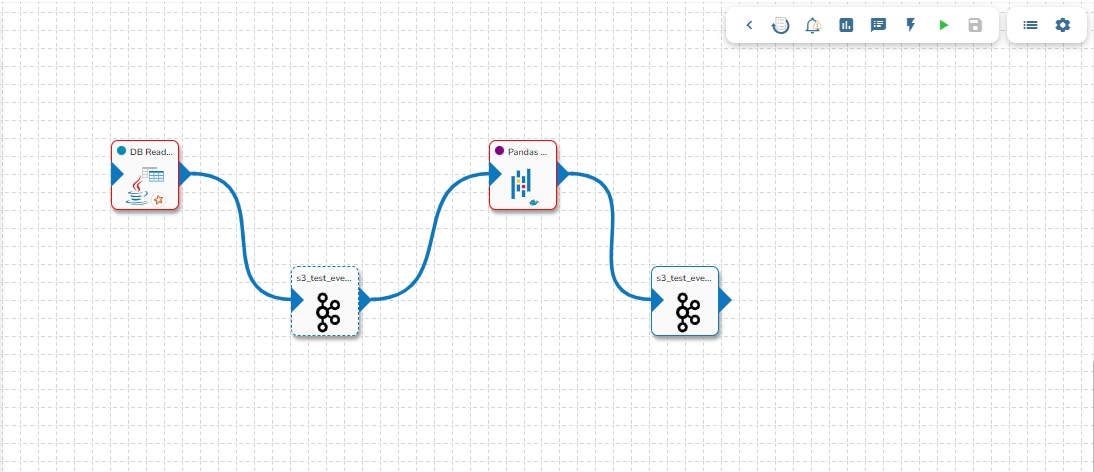
The transformation component requires an input event (to get the data) and sends the data to an output event.
Create two Events and drag them to the Workspace.
Connect the input event and the output event to the component (The data in the input event can come from any Ingestion, Reader, or shared events).
Click the Pandas Query component to get the component properties tabs.
The Basic Information tab opens by default while clicking the dragged component.
Select an Invocation type from the drop-down menu to confirm the running mode of the Pandas Query component. Select ‘Real-Time’ or ‘Batch’ from the drop-down menu.
Deployment Type: It displays the deployment type for the component. This field comes pre-selected.
Container Image Version: It displays the image version for the docker container. This field comes pre-selected.
Failover Event: Select a failover Event from the drop-down menu.
Batch Size (min 10): Provide the maximum number of records to be processed in one execution cycle (Min limit for this field is 10).
Open the Meta Information tab and provide the connection-specific details.
Enter a Pandas query to fetch data from in-event.
Provide the Table Name.
Sample Pandas Query:
In the above given Pandas Query, df is the table name which contains the data from previous event. It will fetch all the rows having gender= 'Female' and department= 'Sales'.
Click the Save Component in Storage icon to save the component properties.
A Notification message appears to notify the successful update of the component.
Please Note: The samples of Pandas Query are given below together with the SQL query for the same statements.
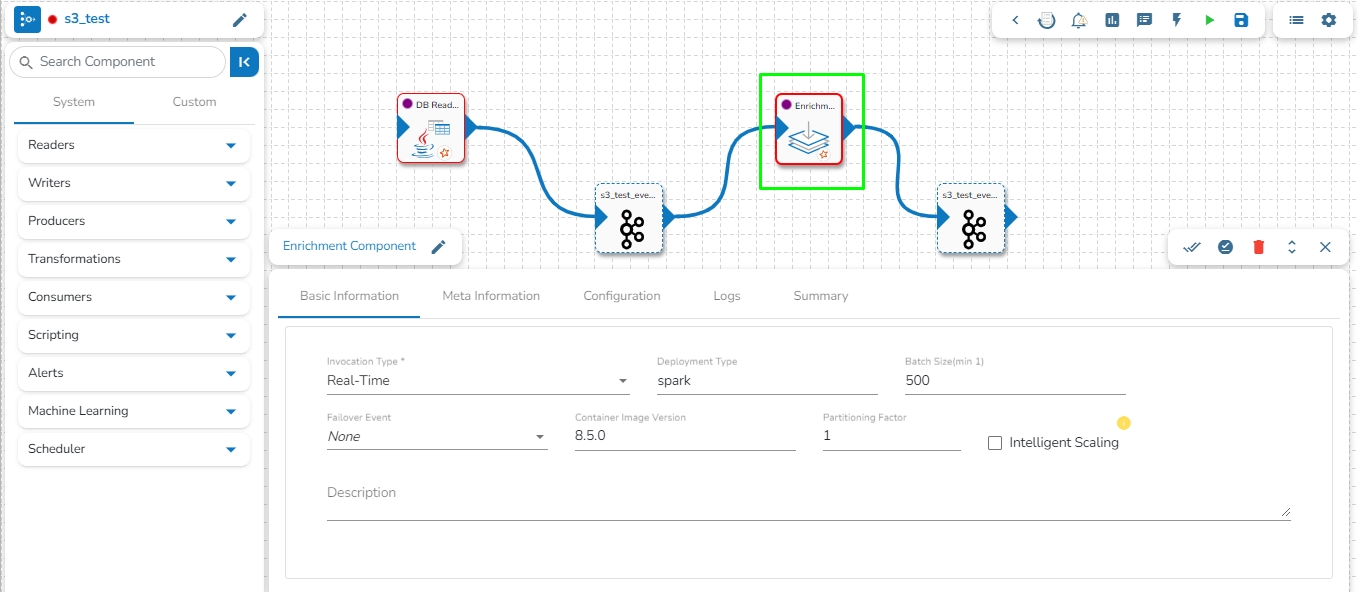
Enrich your data from the master table/collection with few simple steps. This component helps users to enrich the incoming data from an in-Event by querying lookup table in the RDBMS and MongoDB reader components. All component configurations are classified broadly into the following sections:
Meta Information
Follow the steps given in the demonstration to configure the Enrichment component.
Please Note: If the selected driver is MongoDB, then write Mongo Aggregation query in Master table query field. Please refer the below given demonstration to configure the Enrichment component for MongoDB driver.
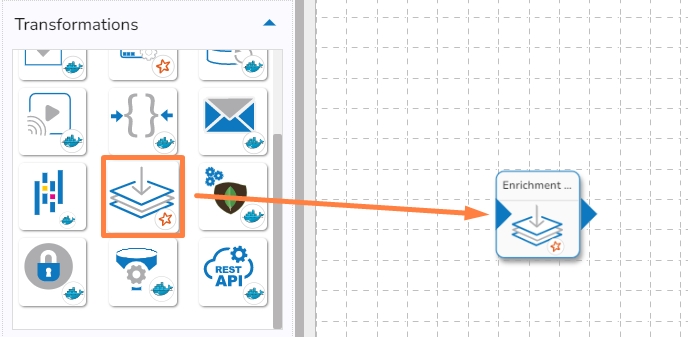
Drag and drop the Enrichment Component to the Workflow Editor.
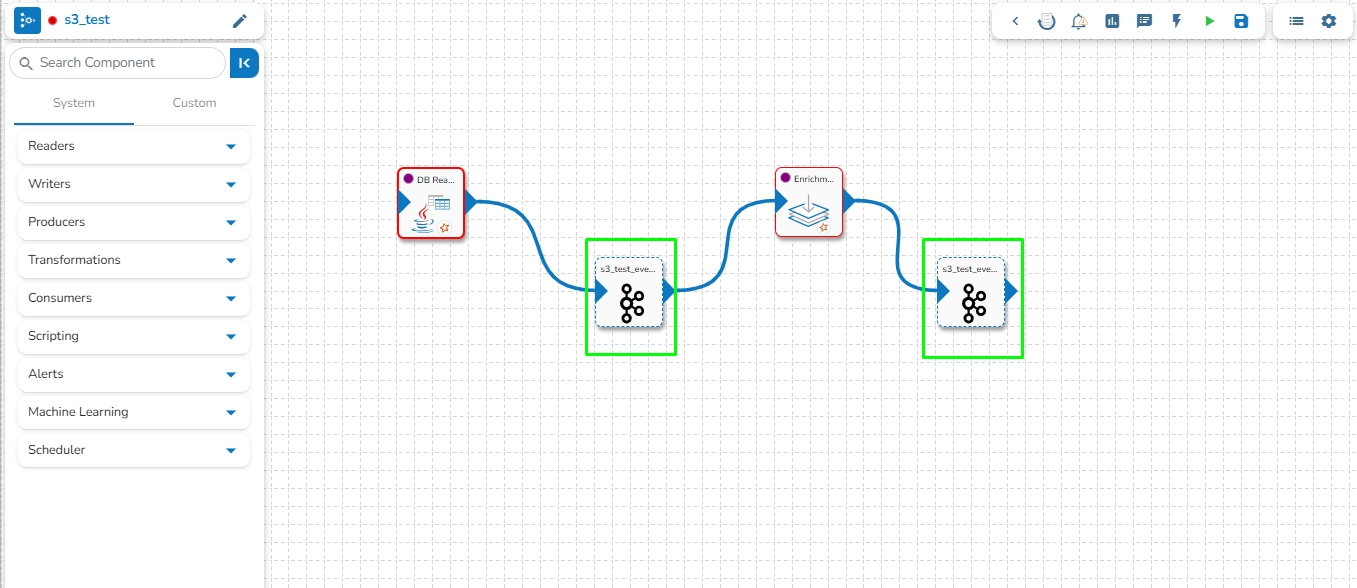
Create two Events and drag them to the Workspace.
Connect the input event and the output event (The data in the input event can come from any Ingestion, Reader, or shared events).
Click the Enrichment Component to get the component properties tabs.
The Basic Information tab opens by default.
Select an Invocation type from the drop-down menu to confirm the running mode of the reader component. Select either Real-Time or Batch option from the drop-down menu.
Deployment Type: It displays the deployment type for the component. This field comes pre-selected.
Container Image Version: It displays the image version for the docker container. This field comes pre-selected.
Failover Event: Select a failover Event from the drop-down menu.
Batch Size: Provide the maximum number of records that you want to be processed in one execution cycle.
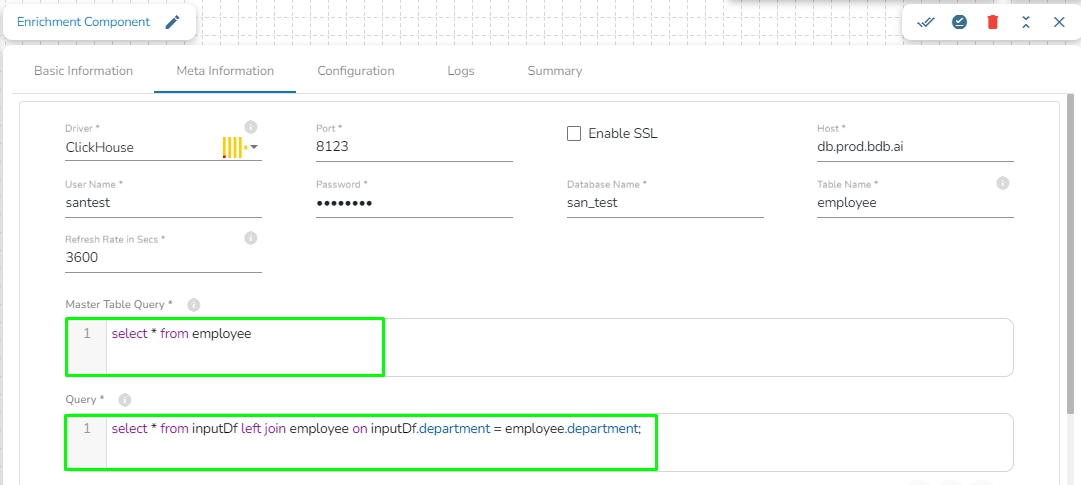
Open the Meta Information tab and fill in all the connection-specific details for the Enrichment Component.
Driver (*): Select Database type (MYSQL, MSSQL, Oracle, Postgres, MongoDB, ClickHouse, Snowflake)
Port (*): Host server port number
Host IP Address (*): IP Address
Username (*): Username for Authentication.
Password (*): Password for Authentication.
Database Name (*): Provide the Database name.
Enable SSL: Check this box to enable SSL for this components. Enable SSL feature in DB reader component will appear only for three(3) drivers: Mongodb, PostgreSQL and ClickHouse.
Certificate Folder: This option will appear when the Enable SSL field is checked-in. The user has to select the certificate folder from drop down which contains the files which has been uploaded to the admin settings. Please refer the below given images for the reference.
Table Name: Provide the table name to read the data.
Refresh rate in Secs: The value of this field has to be provided in seconds. It refreshes the master table and fetches the changes in every cycle of the given value. For example, if Refresh rate value is given as 3600 seconds, it will refresh the master table in every 3600 seconds and fetch the changes (Default value for this field is 3600 seconds).
Please Note: The Refresh rate value can be changed according to your use-case.
Connection Type: This option will show if the user selects MongoDB from the Driver field. A User can configure the MongoDB driver via two connection types (Standard or SRV) that are explained below:
Standard - Port field does appear with the Standard connection type option.
SRV - Port field does not appear with the SRV connection type option.
Conditions: Select conditions type (Remove or Blank option).
Master table query: Write a Spark SQL query to get the data from the table which has been mentioned in the Table name field.
Query: Enter a Spark SQL query to join the master table and the data coming from the previous event. Take inputDf as the table name for the previous event data.
The users can select some specific columns from the table to read data instead of selecting a complete table; this can be achieved via the Selected Columns section. Select the columns which you want to read and if you want to change the name of the column, then put that name in the alias name section otherwise keep the alias name the same as of column name and then select a Column Type from the drop-down menu.
or
Use the Download Data and Upload File options to select the desired columns.
Upload File: The user can upload the existing system files (CSV, JSON) using the Upload File icon (file size must be less than 2 MB).
Download Data (Schema): Users can download the schema structure in JSON format by using the Download Data icon.
After doing all the configurations click the Save Component in Storage icon provided in the reader configuration panel to save the component.
A notification message appears to inform about the component configuration success.
Please Note: The data of previous event is taken as inputDf as the table name in the query field of the Enrichment component as shown in the above query example.
SQL Query
Pandas Query
select id from airports where ident = 'KLAX'
airports [airports.ident == 'KLAX'].id
select * from airport_freq where airport_ident = 'KLAX' order by type
airports[(airports.iso_region == 'US-CA') & (airports.type == 'seaplane_base')]
select type, count(*) from airports where iso_country = 'US' group by type having count(*) > 1000 order by count(*) desc
airports[airports.iso_country == 'US'].groupby('type').filter(lambda g: len(g) > 1000).groupby('type').size().sort_values(ascending=False)
All component configurations are classified broadly into 3 section
Meta Information
Data Loss Protection component in pipeline used to protect or mask the incoming data by using the several techniques so that the loss of important data can be ignored.
Please follow the steps provided in the demonstration to configure the Data Loss Protection component.
Column name: Enter the column name whose data has to be protected.
Rule type: Select the rule type to hide the data. There are four types of rules available by which the data can be protected.
Redaction: Redaction is a data masking technique that enables you to mask data by removing or substituting all or part of the field value.
Masking: By selecting this method, the data can be masked by the given character. Once this option is selected, the following value needs to be given:
Masking character: Enter the character by which the data will be masked.
Characters to ignore: Enter the character which should be ignored while masking the data.
Type: Select either Full or Partial for masking the data.
Hashing: Hashing is using a special cryptographic function to transform one set of data into another of fixed length by using a mathematical process. Once this option is selected, then select the Hash type from the drop down to protect the data. There are 3 options available under the Hash type:
sha 256
sha 384
sha 512
Date generalization: For this rule, select a column which is having only date values. There are four(4) options under this rule:
Year
Month
Quarter
Week
Data Preparation component allows to run data preparation scripts on selected datasets. These datasets can be created from sources such as sandbox or by creating them using data connector. With Data Preparation, you can easily create data preparation with a single click. This automates common data cleaning and transformation tasks, such as filtering, aggregation, mapping, and joining.
All component configurations are classified broadly into 3 section
Meta Information
Follow the steps given in the demonstration to configure the Data Preparation component.
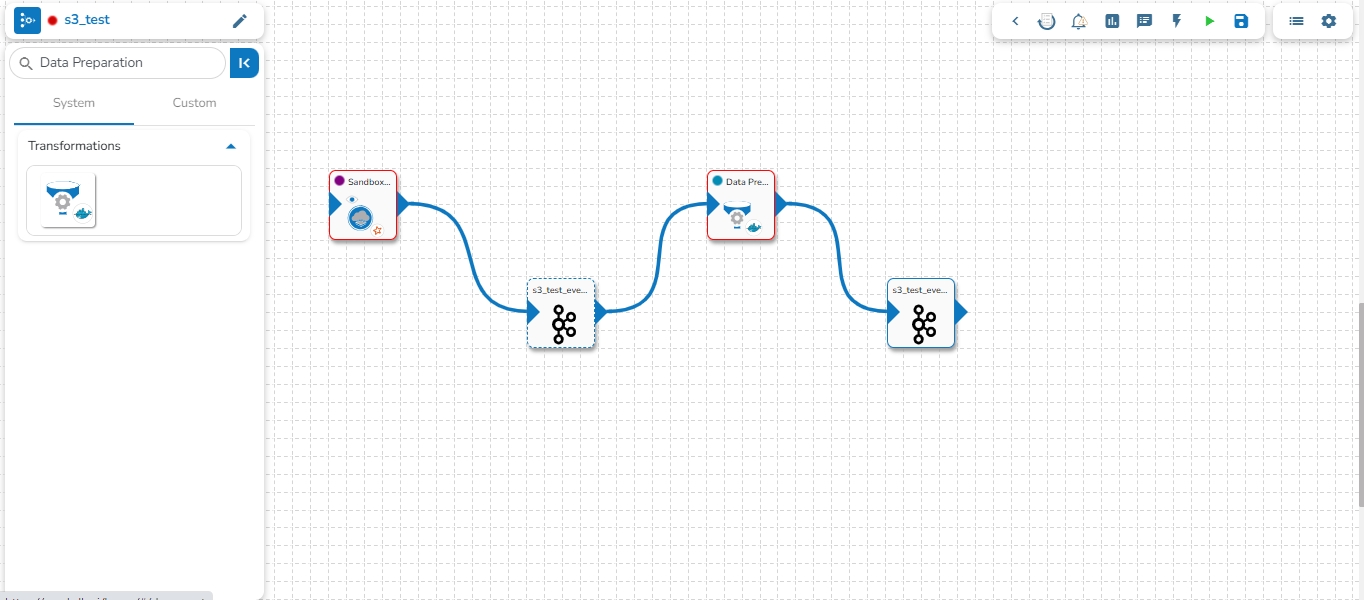
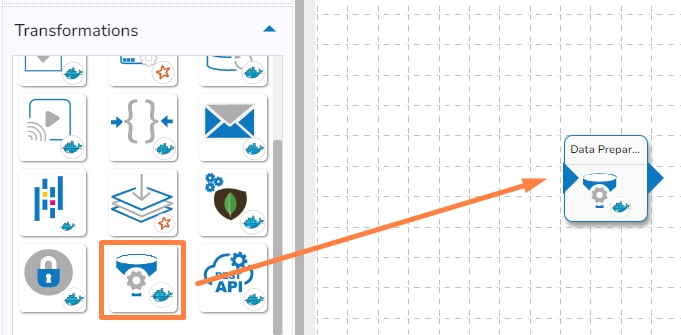
Select the Data Preparation from the Transformations group and drag it to the Pipeline Editor Workspace.
The user needs to connect the Data Preparation component with an In-Event and Out Event to create a Workflow as displayed below:
The following two options provided under the Data Center Type field:
Data Set
Data Sandbox
Please Note: Based on the selected option for the Data Center Type field the configuration fields will appear for the Meta Information tab.
Navigate to the Meta Information tab.
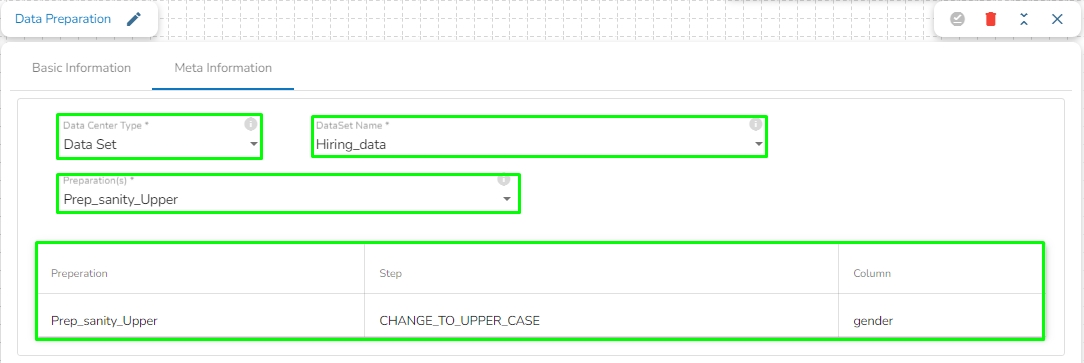
Data Center Type: Select Data Set as the Data Center Type.
Data Set Name: Select a Data Set Name using the drop-down menu.
Preparation(s): The available Data Preparation will list under the Preparation(s) field for the selected Data Set. Select a Preparation by using the checkbox. Once the preparation is selected, it will display the list of transformation done in that selected preparation. Please see the below given image for reference.
Navigate to the Meta Information tab.
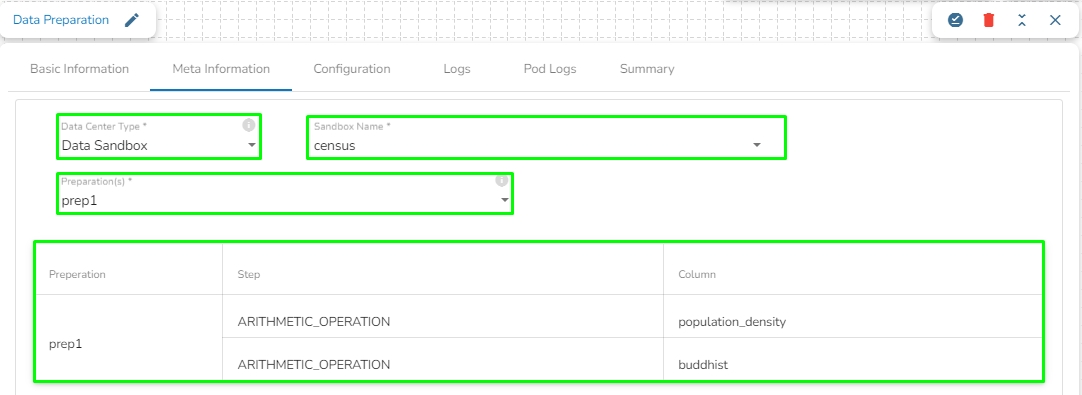
Data Center Type: Select Data Sandbox as the Data Center Type.
Data Sandbox Name: Select a Data Sandbox Name using the drop-down menu.
Preparation(s): The available Data Preparation will list under the Preparation(s) field for the selected Data Sandbox. Select a Preparation by using the checkbox. Once the preparation is selected, it will display the list of transformation done in that selected preparation. Please see the below given image for reference.
Please Note:
Once Meta Information is configured, the same transformation will be applied to the in-Event data which has been done while creating the Data Preparation. To ensure the same transformation is applied to the in-event data, the user must have used the same source data during the previous event where the preparation was conducted.
If the file is uploaded to the Data Sandbox by an Admin user, it will not be visible or listed in the Sandbox Name field of the Meta information for the Data Preparation component to non-admin users.
A success notification message appears when the component gets saved.
Save and Run the Pipeline workflow.
Please Note: Once the Pipeline workflow gets saved and activated, the related component logs will appear under the Logs panel. The Preview tab will come for the concerned component displaying the preview of the data. The schema preview can be accessed under the Preview Schema tab.
The REST API component provides a way for applications to interact with a web-based service through a set of predefined operations or HTTP methods, such as GET, POST, PUT,PATCH, DELETE etc.
All component configurations are classified broadly into 3 section
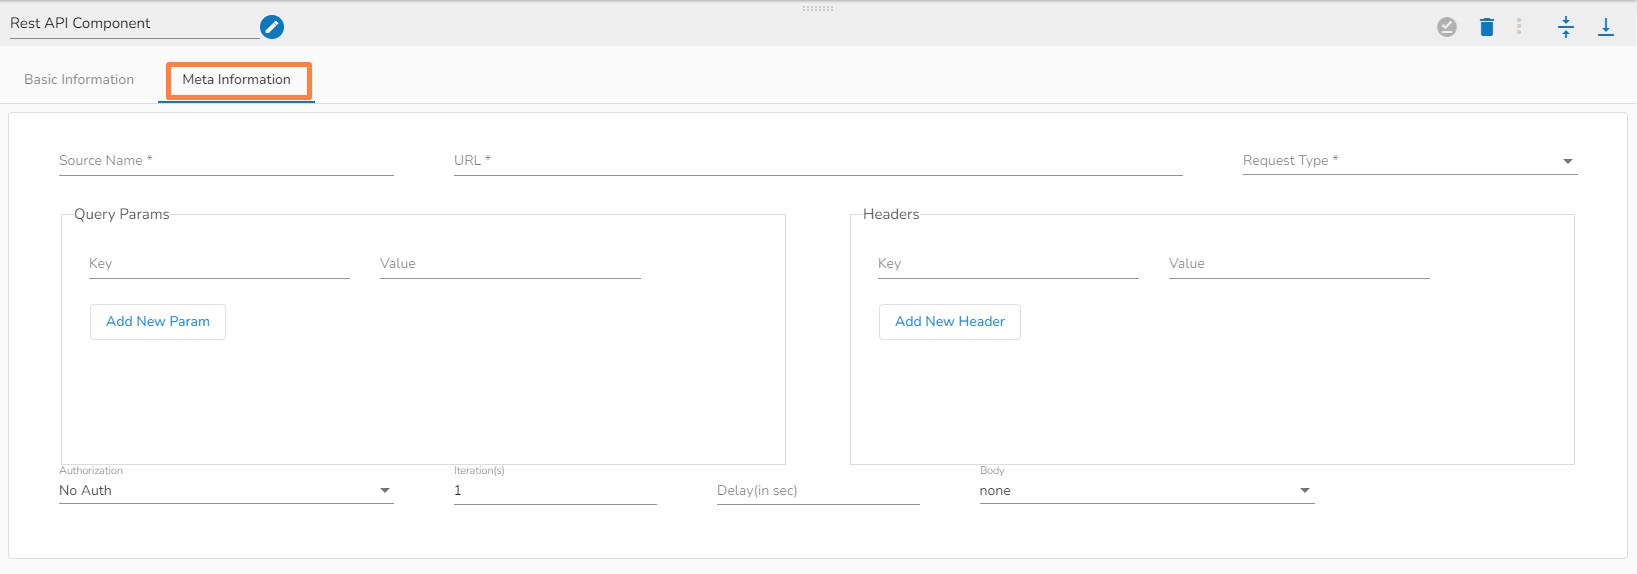
Meta Information
Follow the steps given in the demonstration to configure the Rest API component.
Source Name: Provide the name of the source you would like to reference.
URL: It is a unique identifier that specifies the location of a resource on the web.
Request Type: The Request Type refers to the HTTP method or operation used to interact with a web service or resource. The most common HTTP methods used in REST APIs are:
GET: It retrieves data from a resource.
POST: It submits new data to a resource.
PUT: It updates existing data in a resource.
DELETE: It deletes data from a resource.
PATCH: It is to partially update a resource or entity on the server.
Query Params: These are additional parameters that can be passed along with the URL of a request to modify the data returned by an API endpoint
Headers: It refer to the additional information sent in the HTTP request or response along with the actual data.
Authorization: It refers to the process of verifying that a user or application has the necessary permissions to access a particular resource or perform a particular action.
Iteration(s): It refers to the process of retrieving a collection of resources from a web service in a paginated manner, where each page contains a subset of the overall resource collection.
Delay(in sec): It refers to a period of time between when a request is made by a client and when a response is received from the server.
Body: It refers to the data or payload of a request or response message.
Schema Validator component lets the users create validation rules for their fields, such as allowed data types, value ranges, and nullability.
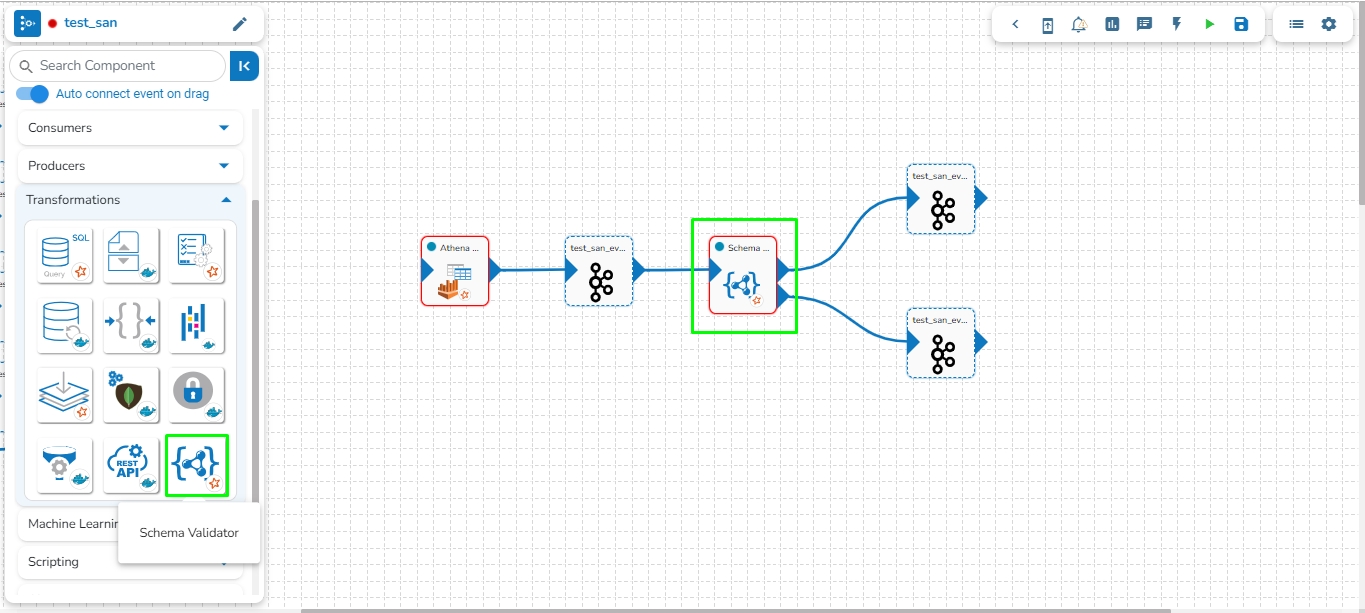
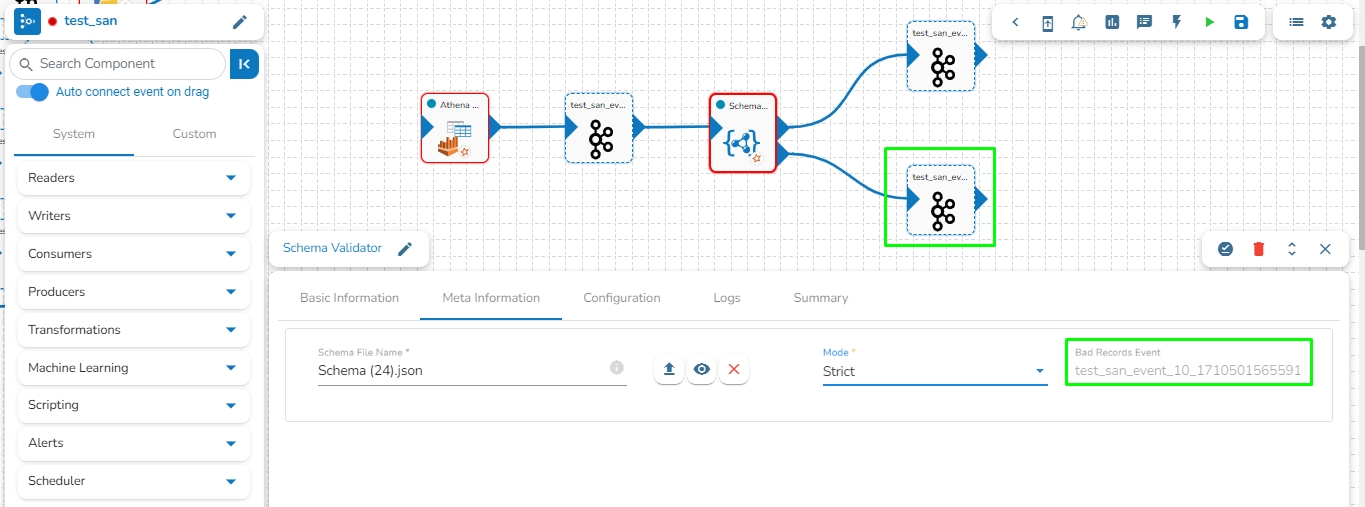
The Schema Validator component has two outputs. The first one is to pass the Schema Validated records successfully and the second one is to pass the Bad Record Event.
Check out the given demonstration to configure the Schema Validator component.
All component configurations are classified broadly into the following sections:
Meta Information
Please Note: Schema Validator will only work for flat JSON data, it will not work on array/list or nested JSON data.
Access the Schema Validator component from the Ingestion component.
Drag the Schema Validator component to the Pipeline workflow canvas and connect it with the required components.
Click the Schema Validator component.
It displays the component configuration tabs below:
Invocation Type: The user can select any one invocation type from the given choices.
Real-Time: If the Real-Time option is selected in invocation type, the component never goes down when the pipeline is active. This is for the situations when you want to keep the component ready all the time to consume data.
Batch-Size: Is Batch is selected as invocation type, the component needs a trigger to initiate the process from the previous event. Once the process of the component is finished and there are no new Events to process, the component goes down.
Batch Size: The Pipeline components process the data in batches. This batch size is given to define the maximum number of records that you want to process in a single cycle of operation. This is really helpful if you want to control the number of records being processed by the component if the unit record size is huge.
Failover Event: The Failover Event can be mapped through the given field. If the component gets failed due to any glitch, all the needed data to perform the operation goes to this Event with the failure cause and timestamp.
Intelligent Scaling: By enabling this option helps the component to scale up to the max number of instances by automatically reducing the data processing. This feature detects the need to scale up the components in case of higher data traffic.
Schema File Name: This specifies the name of uploaded Schema file.
Choose File: This option allows you to upload your schema file.
View Schema: This option allows you to view uploaded schema file.
Remove File: This option allows you to remove uploaded schema file.
Mode: Two choices are provided under the Meta Information of the Schema Validator to choose a mode:
Strict: Strict mode intends to prevent any unexpected behaviors or silently ignored mistakes in user schemas. It does not change any validation results compared with the specification, but it makes some schemas invalid and throws exception or logs warning (with strict: "log" option) in case any restriction is violated and sends them to bad record event.
Allow Schema Drift: Schema drift is the case where the used data sources often change metadata. Fields, columns, types etc. can be added, removed, or changed on the fly. It allows slight changes in the data schema.
Bad Records Event: The records that are rejected by the Schema Validator will automatically go to the Bad Records Event.
Please Note:
The Event component connected to the second node of the Schema Validator component automatically gets mapped as the Bad record Event in the workflow.
The user will not be able to copy and paste Schema Validator component in the pipeline as the Copy option has been disabled for Schema Validator.
Future Plan: The Schema Validator component will be able to process nested JSON data.
Click the Save Component in Storage icon.
{'Emp_id':248, 'Age':20, 'city': 'Mumbai, 'Dept':'Data_Science'}
{'Id':248, 'name': 'smith', 'marks':[80,85,70,90,91], 'Dept':{'dept_id':20,'dept_name':'data_science','role':'software_engineer'}}


