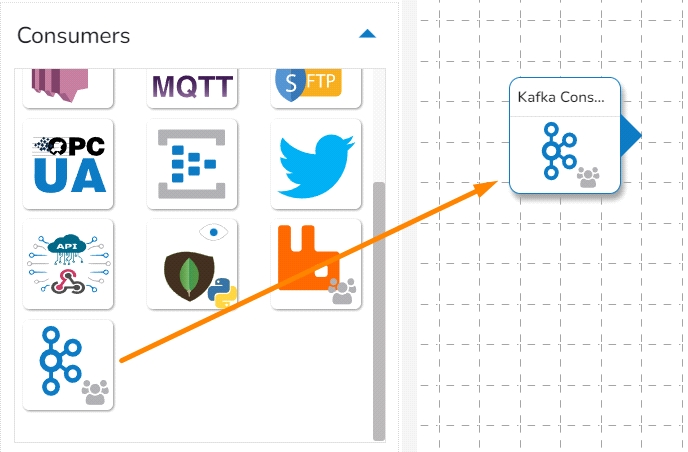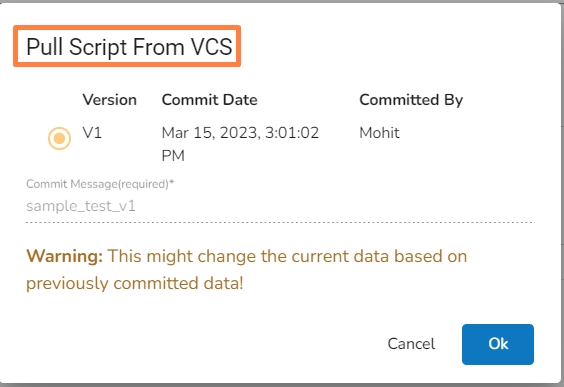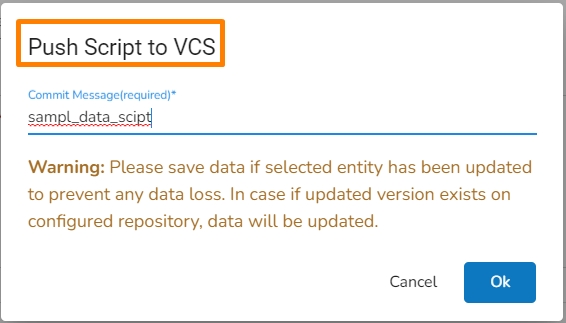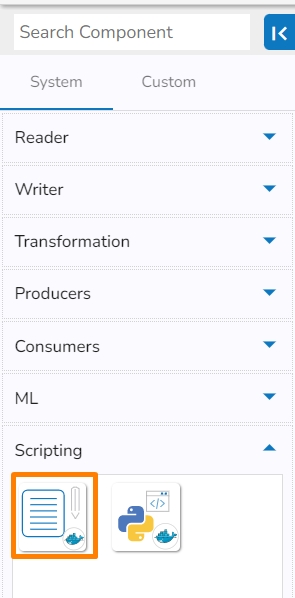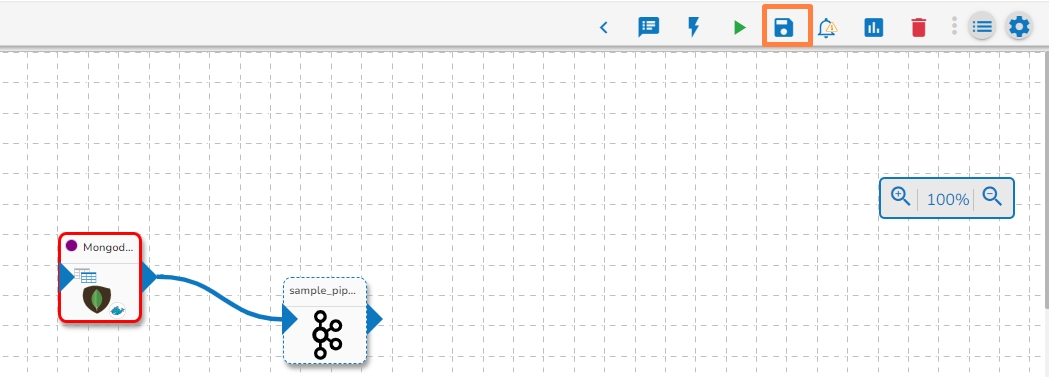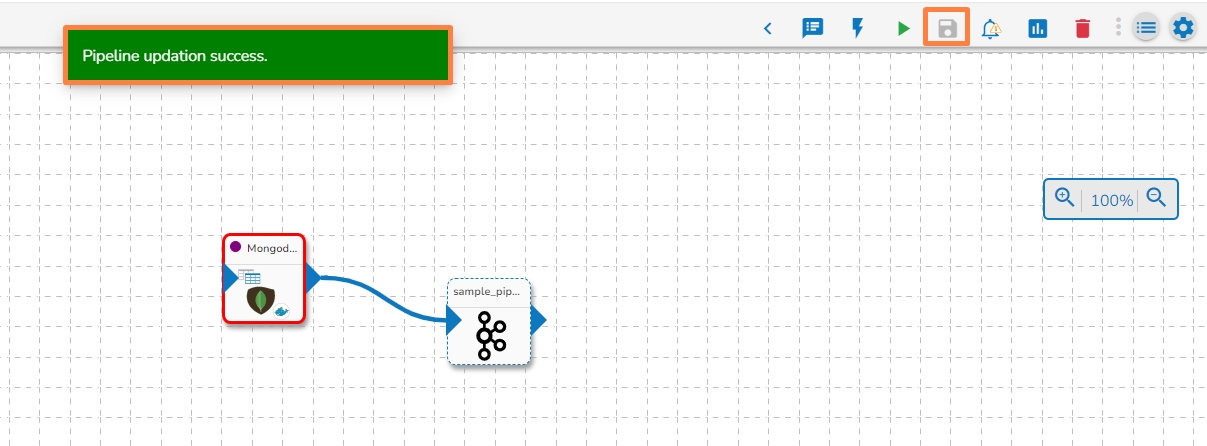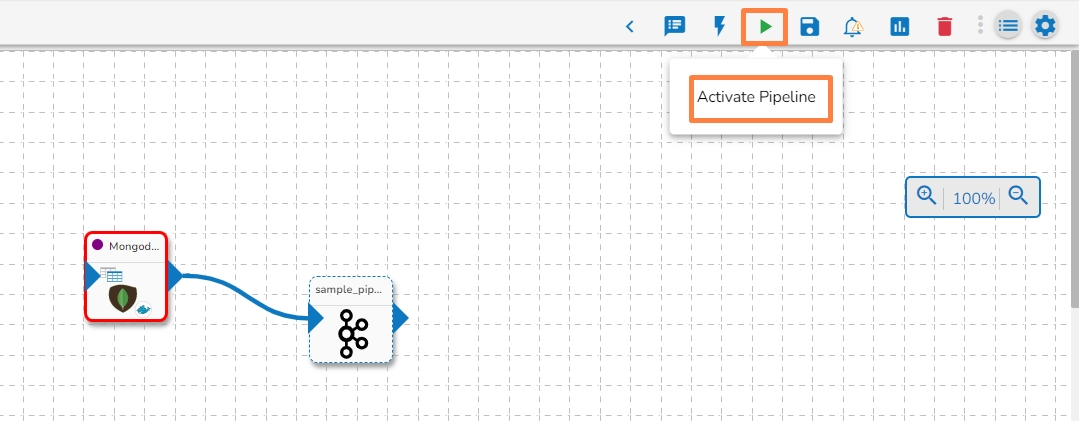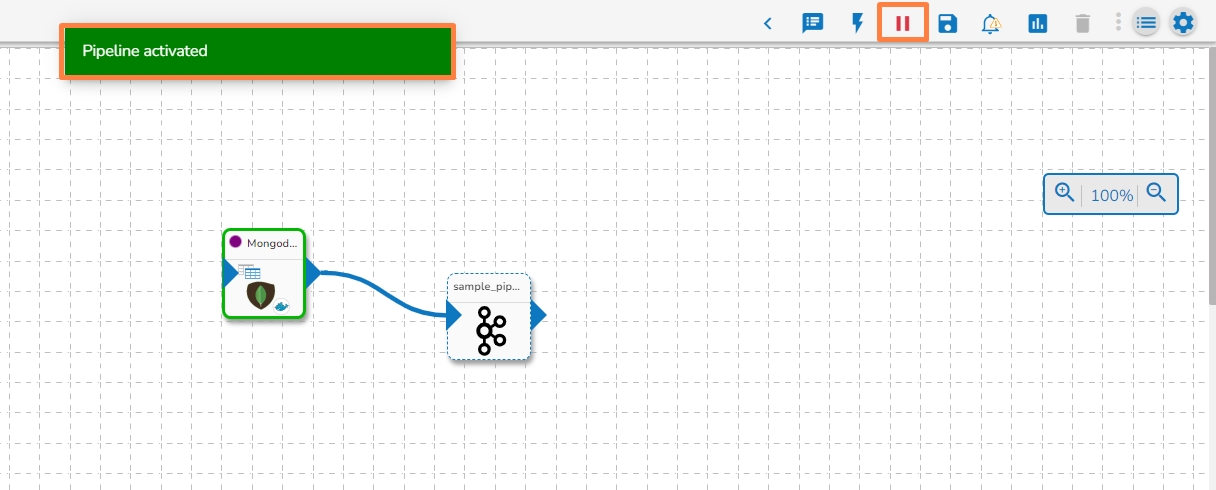
Loading...
Loading...
Loading...
Loading...
Loading...
Loading...
Loading...
Loading...
Loading...
Loading...
Loading...
Loading...
Loading...
Loading...
Loading...
Loading...
Loading...
Loading...
Loading...
Loading...
Loading...
Loading...
Loading...
Loading...
Loading...
Loading...
Loading...
Loading...
Loading...
Loading...
Loading...
Loading...
Loading...
Loading...
Loading...
Loading...
Loading...
Loading...
Loading...
Loading...
Loading...
Loading...
Loading...
Loading...
Loading...
Loading...
Loading...
Loading...
Loading...
Loading...
Loading...
Loading...
Loading...
Loading...
Loading...
Loading...
Loading...
Loading...
Loading...
Loading...
Loading...
Loading...
Loading...
Loading...
Loading...
Loading...
Loading...
Loading...
Loading...
Loading...
Loading...
Loading...
Loading...
Loading...
Loading...
Loading...
Loading...
Loading...
Loading...
Loading...
Loading...
Loading...
Loading...
Components are broadly classified into:
Component Panel
Expand component group and select
Search using the search bar in the component panel
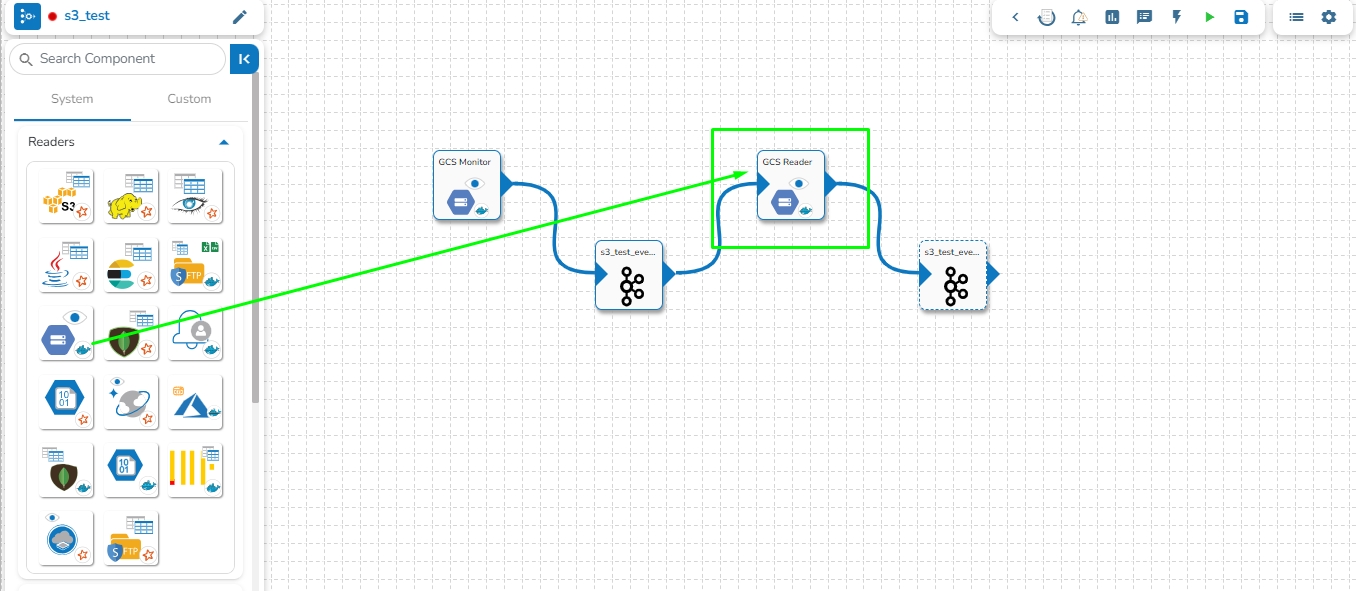
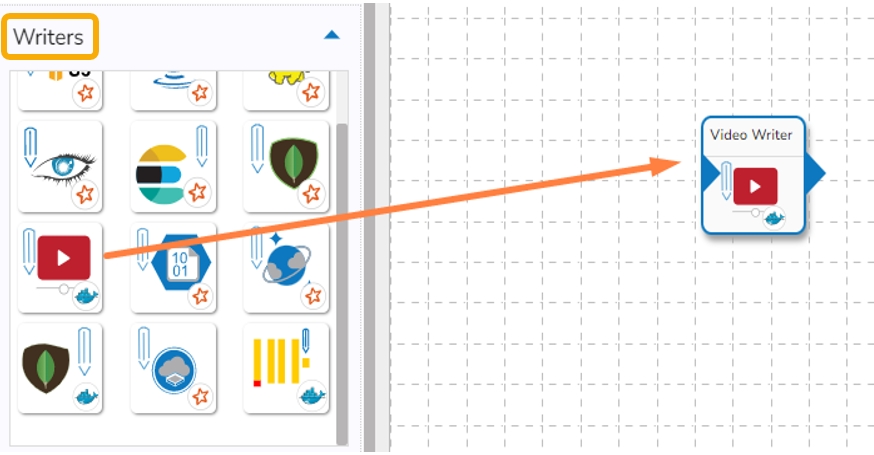
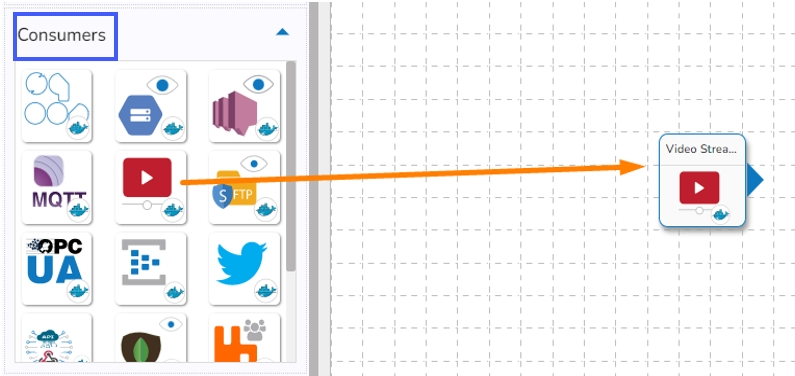
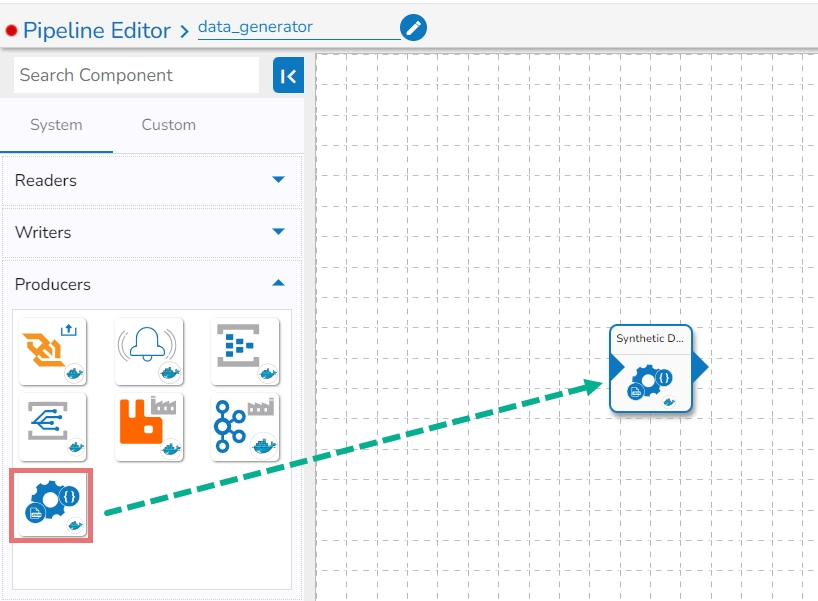
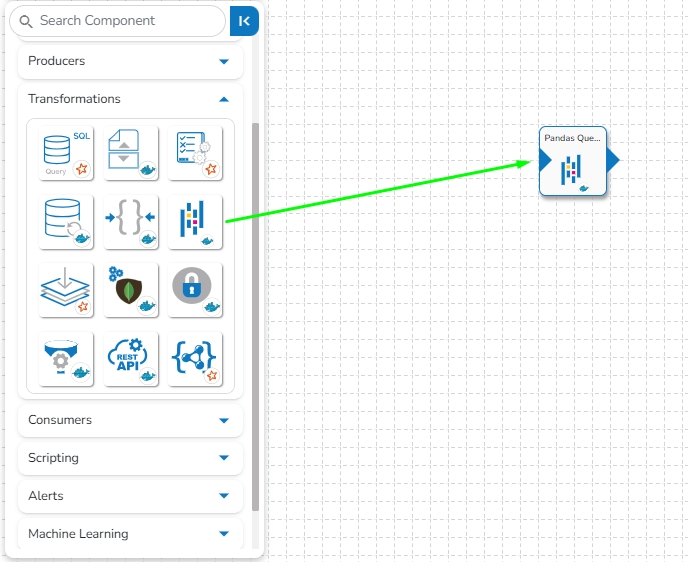
Drag and Drop the components to the workflow editor.
Any Pipeline System component can be easily dragged to the workflow it includes the following steps to use a System component in the Pipeline Workflow editor:
Drag and Drop the components to the workflow editor.
Search using the search bar in the component panel
Expand component group and select
Check out the illustration on how to use a system pipeline component.
GCS Reader component is typically designed to read data from Google Cloud Storage (GCS), a cloud-based object storage service provided by Google Cloud Platform. A GCS Reader can be a part of an application or system that needs to access data stored in GCS buckets. It allows you to retrieve, read, and process data from GCS, making it accessible for various use cases, such as data analysis, data processing, backups, and more.
GCS Reader pulls data from the GCS Monitor, so the first step is to implement GCS Monitor.
Note: The users can refer to the GCS Monitor section of this document for the details.
All component configurations are classified broadly into the following sections:
Meta Information
Navigate to the Pipeline Workflow Editor page for an existing pipeline workflow with GCS Monitor and Event component.
Open the Reader section of the Component Pallet.
Drag the GCS Reader to the Workflow Editor.
Click on the dragged GCS Reader component to get the component properties tabs below.
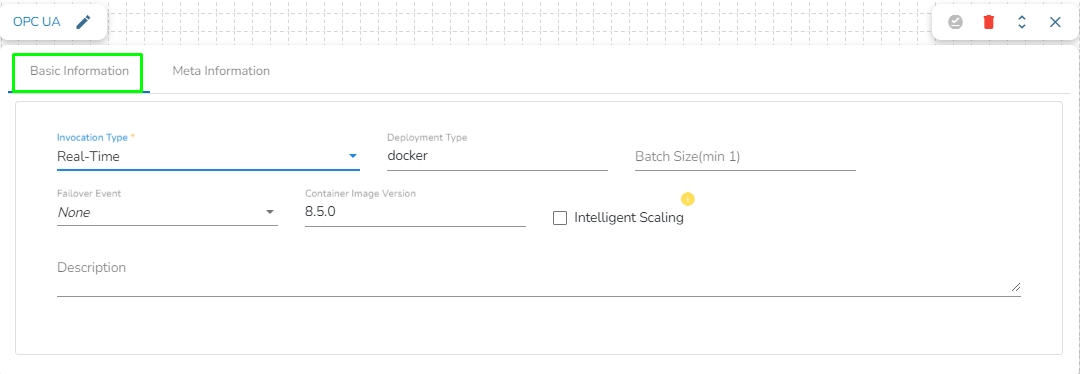
It is the default tab to open for the component while configuring it.
Invocation Type: Select an invocation mode from the ‘Real-Time’ or ‘Batch’ using the drop-down menu.
Deployment Type: It displays the deployment type for the reader component. This field comes pre-selected.
Container Image Version: It displays the image version for the docker container. This field comes pre-selected.
Failover Event: Select a failover Event from the drop-down menu.
Batch Size (min 10): Provide the maximum number of records to be processed in one execution cycle (the minimum limit for this field is 10).
Bucket Name: Enter the Bucket name for GCS Reader. A bucket is a top-level container for storing objects in GCS.
Directory Path: Enter the path where the file is located, which needs to be read.
File Name: Enter the file name.
Navigate to the Pipeline Workflow Editor page for an existing pipeline workflow with the PySpark GCS Reader and Event component.
OR
You may create a new pipeline with the mentioned components.
Open the Reader section of the Component Pallet.
Drag the PySpark GCS Reader to the Workflow Editor.
Click the dragged GCS Reader component to get the component properties tabs below.
Invocation Type: Select an invocation mode from the ‘Real-Time’ or ‘Batch’ using the drop-down menu.
Deployment Type: It displays the deployment type for the reader component. This field comes pre-selected.
Container Image Version: It displays the image version for the docker container. This field comes pre-selected.
Failover Event: Select a failover Event from the drop-down menu.
Batch Size (min 10): Provide the maximum number of records to be processed in one execution cycle (the minimum limit for this field is 10).
Secret File (*): Upload the JSON from the Google Cloud Storage.
Bucket Name (*): Enter the Bucket name for GCS Reader. A bucket is a top-level container for storing objects in GCS.
Path: Enter the path where the file is located, which needs to be read.
Read Directory: Disable reading single files from the directory.
Limit: Set a limit for the number of records to be read.
File-Type: Select the File-Type from the drop-down.
File Type (*): Supported file formats are:
CSV: The Header, Multilibe, and Infer Schema fields will be displayed with CSV as the selected File Type. Enable the Header option to get the Header of the reading file and enable the Infer Schema option to get the true schema of the column in the CSV file. Check the Multiline option if there is any Multiline string in the file.
JSON: The Multiline and Charset fields are displayed with JSON as the selected File Type. Check in the Multiline option if there is any Multiline string in the file.
PARQUET: No extra field gets displayed with PARQUET as the selected File Type.
AVRO: This File Type provides two drop-down menus.
Compression: Select an option out of the Deflate and Snappy options.
Compression Level: This field appears for the Deflate compression option. It provides 0 to 9 levels via a drop-down menu.
XML: Select this option to read the XML file. If this option is selected, the following fields will be displayed:
Infer schema: Enable this option to get the true schema of the column.
Path: Provide the path of the file.
Root Tag: Provide the root tag from the XML files.
Row Tags: Provide the row tags from the XML files.
Join Row Tags: Enable this option to join multiple row tags.
Query: Enter the Spark SQL query.
Select the desired columns using the Download Data and Upload File options.
Or
The user can also use the Column Filter section to select columns.
Click the Save Component in Storage icon after doing all the configurations to save the reader component.
A notification message appears to inform about the component configuration success.
Readers are a group of components that can read data from different DB and cloud storages in both invocation types i.e., Real-Time and Batch.
S3 Reader component typically authenticate with S3 using AWS credentials, such as an access key ID and secret access key, to gain access to the S3 bucket and its contents. S3 Reader is designed to read and access data stored in an S3 bucket in AWS.
All component configurations are classified broadly into the following sections:
Meta Information
Check out the below-given demonstration to configure the S3 component and use it in a pipeline workflow.
Navigate to the Data Pipeline Editor.
Expand the Reader section provided under the Component Pallet.
Drag and drop the S3 Reader component to the Workflow Editor.
Click on the dragged S3 Reader to get the component properties tabs.
It is the default tab to open for the component while configuring it.
Invocation Type: Select an invocation mode out of ‘Real-Time’ or ‘Batch’ using the drop-down menu.
Deployment Type: It displays the deployment type for the reader component. This field comes pre-selected.
Container Image Version: It displays the image version for the docker container. This field comes pre-selected.
Failover Event: Select a failover Event from the drop-down menu.
Batch Size (min 10): Provide the maximum number of records to be processed in one execution cycle (Min limit for this field is 10).
Open the ‘Meta Information’ tab and fill in all the connection-specific details for the S3 Reader.·
Bucket Name (*): Enter AWS S3 Bucket Name.
Zone (*): Enter S3 Zone. (For eg: us-west-2)
Access Key (*): Provide Access Key ID shared by AWS.
Secret Key (*): Provide Secret Access Key shared by AWS.
Table (*): Mention the Table or file name from S3 location which is to be read.
File Type (*): Select a file type from the drop-down menu (CSV, JSON, PARQUET, AVRO, XML and ORC are the supported file types)
Limit: Set a limit for the number of records to be read.
Query: Enter a Spark SQL query. Take inputDf as table name.
Access Key (*): Provide Access Key ID shared by AWS.
Secret Key (*): Provide Secret Access Key shared by AWS.
Table (*): Mention the Table or file name from S3 location which is to be read.
File Type (*): Select a file type from the drop-down menu (CSV, JSON, PARQUET, AVRO are the supported file types).
Limit: Set a limit for the number of records to be read.
Query: Enter a Spark SQL query. Take inputDf as table name.
Sample Spark SQL query for S3 Reader:
There is also a section for the selected columns in the Meta Information tab if the user can select some specific columns from the table to read data instead of selecting a complete table so this can be achieved by using the ‘Selected Columns’ section. Select the columns which you want to read and if you want to change the name of the column, then put that name in the alias name section otherwise keep the alias name the same as of column name and then select a Column Type from the drop-down menu.
or
Use ‘Download Data’ and ‘Upload File’ options to select the desired columns.
Provide a unique Key column name on which the partition has been done and has to be read.
Click the Save Component in Storage icon after doing all the configurations to save the reader component.
A notification message appears to inform about the component configuration success.
Please Note:
(*) the symbol indicates that the field is mandatory.
Either table or query must be specified for the data readers except for SFTP Reader.
Selected Columns- There should not be a data type mismatch in the Column Type for all the Reader components.
The Meta Information fields may vary based on the selected File Type.
All the possibilities are mentioned below:
CSV: ‘Header’ and ‘Infer Schema’ fields get displayed with CSV as the selected File Type. Enable Header option to get the Header of the reading file and enable Infer Schema option to get true schema of the column in the CSV file.
JSON: ‘Multiline’ and ‘Charset’ fields get displayed with JSON as the selected File Type. Check-in the Multiline option if there is any multiline string in the file.
PARQUET: No extra field gets displayed with PARQUET as the selected File Type.
AVRO: This File Type provides two drop-down menus.
Compression: Select an option out of the ‘Deflate’ and ‘Snappy’ options.
Compression Level: This field appears for the Deflate compression option. It provides 0 to 9 levels via a drop-down menu.
XML: Select this option to read XML file. If this option is selected, the following fields will get displayed:
Infer schema: Enable this option to get true schema of the column.
Path: Provide the path of the file.
Root Tag: Provide the root tag from the XML files.
Row Tags: Provide the row tags from the XML files.
Join Row Tags: Enable this option to join multiple row tags.
ORC: Select this option to read ORC file. If this option is selected, the following fields will get displayed:
Push Down: In ORC (Optimized Row Columnar) file format, "push down" typically refers to the ability to push down predicate filters to the storage layer for processing. There will be two options in it:
True: When push down is set to True, it indicates that predicate filters can be pushed down to the ORC storage layer for filtering rows at the storage level. This can improve query performance by reducing the amount of data that needs to be read into memory for processing.
False: When push down is set to False, predicate filters are not pushed down to the ORC storage layer. Instead, filtering is performed after the data has been read into memory by the processing engine. This may result in more data being read and potentially slower query performance compared to when push down is enabled.
A way to scale up the processing speed of components.
A feature to scale your component to the max number of instances to reduce the data processing lag automatically. This feature detects the need to scale up the components in case of higher data traffic.
Please Note: This feature is available both in Spark & Docker components. This feature will only work with the real-time as invocation type.
All components have option of Intelligent scaling which is ability of the system to dynamically adjust the scale or capacity of the reader component based on the current demand and available resources. It involves automatically optimizing the resources allocated to the component to ensure efficient and effective processing of tasks.
Please Note:
If you have selected intelligent scaling option make sure to give enough resources to component so that it can auto-scale based on the load.
Components will scale up if there is a lag of more than 60% and if the lag goes less than 10% component pods will automatically scale down. This lag percentage is configurable.
The DB reader is a spark-based reader which gives you capability to read data from multiple database sources. All the database sources are listed below:
All component configurations are classified broadly into the following sections:
Meta Information
Please follow the steps given in the demonstration to configure the DB Reader component.
Please Note:
The ClickHouse driver in the Spark components will use HTTP Port and not the TCP port.
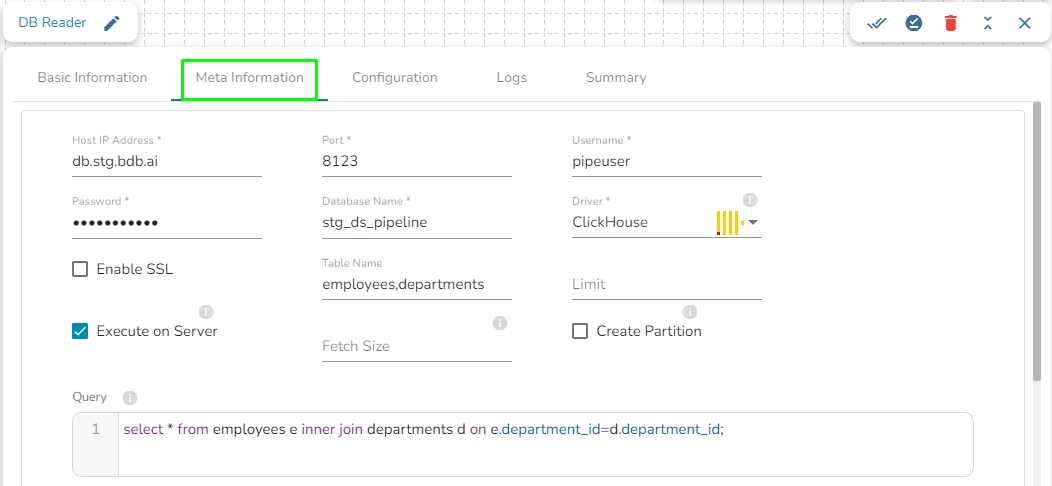
In the case of data from multiple tables (join queries), one can write the join query directly without specifying multiple tables, as only one among table and query fields is required.
Table name: Provide a single or multiple table names. If multiple table name has be given, then enter the table names separated by comma(,).
Fetch Size: Provide the maximum number of records to be processed in one execution cycle.
Create Partition: This is used for performance enhancement. It's going to create the sequence of indexing. Once this option is selected, the operation will not execute on server.
Partition By: This option will appear once create partition option is enabled. There are two options under it:
Auto Increment: The number of partitions will be incremented automatically.
Index: The number of partitions will be incremented based on the specified Partition column.
Query: Enter the spark SQL query in this field for the given table or table(s). It supports query containing a join statement as well. Please refer the below image for making query on multiple tables.
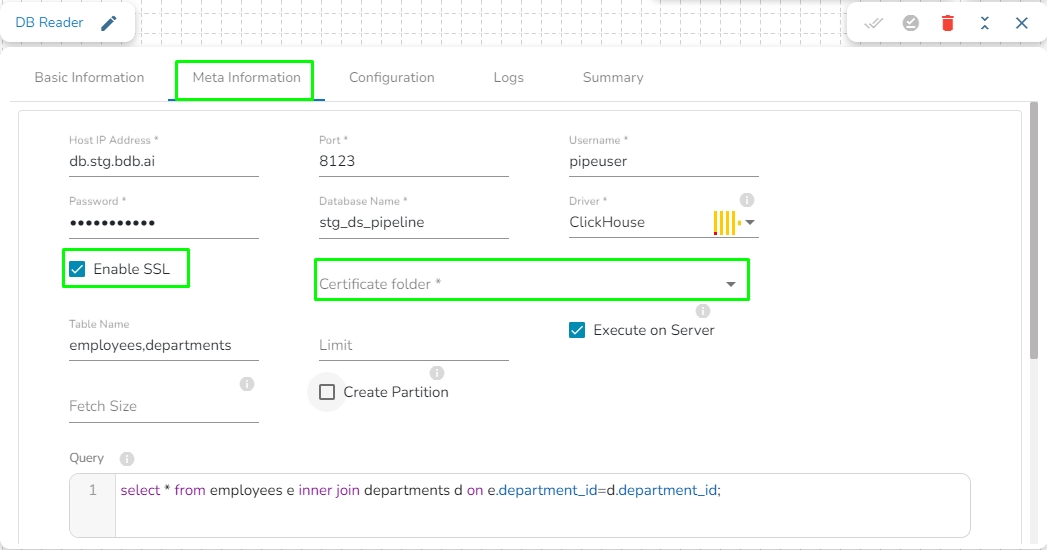
Enable SSL: Check this box to enable SSL for this components. Enable SSL feature in DB reader component will appear only for two(2) drivers: PostgreSQL and ClickHouse.
Certificate Folder: This option will appear when the Enable SSL field is checked-in. The user has to select the certificate folder from drop down which contains the files which has been uploaded to the admin settings. Please refer the below given images for the reference.
Sample Spark SQL query for DB Reader:
Please Note: To use DB reader component with SSL, the user needs to upload the following files on the certificate upload page:
Certificate file (.pem format)]
Key file (.key format)
SFTP stream reader is designed to read and access data from an SFTP server. SFTP stream readers typically authenticate with the SFTP server using username and password or SSH key-based authentication.
All component configurations are classified broadly into the following sections:
Meta Information
Please follow the demonstration to configure the component and its Meta Information.
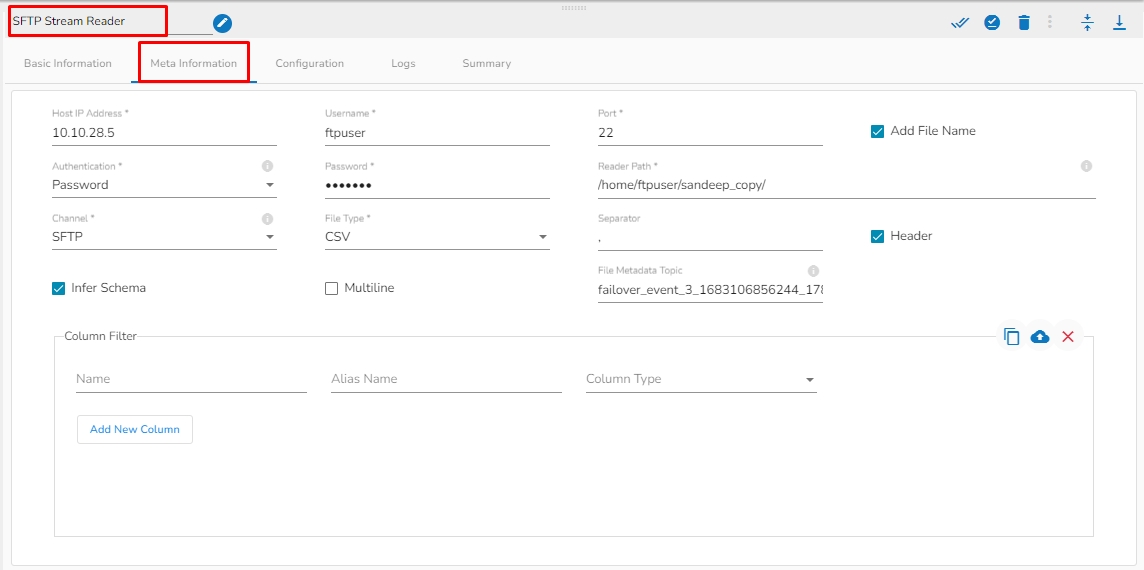
Host: Enter the host.
Username: Enter username for SFTP stream reader.
Port: Provide the Port number.
Add File Name: Enable this option to get the file name along with the data.
Authentication: Select an authentication option using the drop-down list.
Password: Provide a password to authenticate the SFTP Stream reader component
PEM/PPK File: Choose a file to authenticate the SFTP Stream reader component. The user needs to upload a file if this authentication option has been selected.
Reader Path: Enter the path from where the file has to be read.
Channel: Select a channel option from the drop-down menu (the supported channel is SFTP).
File type: Select the file type from the drop-down:
CSV: The Header and Infer Schema fields get displayed with CSV as the selected File Type. Enable Header option to get the Header of the reading file and enable Infer Schema option to get true schema of the column in the CSV file. Schema: If CSV is selected as file type, then paste spark schema of CSV file in this field.
JSON: The Multiline and Charset fields get displayed with JSON as the selected File Type. Check-in the Multiline option if there is any multiline string in the file.
XML: Select this option to read XML file. If this option is selected, the following fields will get displayed:
Infer schema: Enable this option to get true schema of the column.
Path: Provide the path of the file.
Root Tag: Provide the root tag from the XML files.
Row Tags: Provide the row tags from the XML files.
Join Row Tags: Enable this option to join multiple row tags.
File Metadata Topic: Enter Kafka Event Name where the reading file metadata has to be sent.
Column filter: Select the columns which you want to read and if you want to change the name of the column, then put that name in the alias name section otherwise keep the alias name the same as of column name and then select a Column Type from the drop-down menu.
Use Download Data and Upload File options to select the desired columns.
Upload File: The user can upload the existing system files (CSV, JSON) using the Upload File icon.
Download Data (Schema): Users can download the schema structure in JSON format by using the Download Data icon.
HDFS stands for Hadoop Distributed File System. It is a distributed file system designed to store and manage large data sets in a reliable, fault-tolerant, and scalable way. HDFS is a core component of the Apache Hadoop ecosystem and is used by many big data applications.
This component reads the file located in HDFS(Hadoop Distributed File System).
All component configurations are classified broadly into 3 section
Meta Information
Host IP Address: Enter the host IP address for HDFS.
Port: Enter the Port.
Zone: Enter the Zone for HDFS. Zone is a special directory whose contents will be transparently encrypted upon write and transparently decrypted upon read.
File Type: Select the File Type from the drop down. The supported file types are:
CSV: The Header and Infer Schema fields get displayed with CSV as the selected File Type. Enable Header option to get the Header of the reading file and enable Infer Schema option to get true schema of the column in the CSV file.
JSON: The Multiline and Charset fields get displayed with JSON as the selected File Type. Check-in the Multiline option if there is any multiline string in the file.
PARQUET: No extra field gets displayed with PARQUET as the selected File Type.
AVRO: This File Type provides two drop-down menus.
Compression: Select an option out of the Deflate and Snappy options.
Compression Level: This field appears for the Deflate compression option. It provides 0 to 9 levels via a drop-down menu.
XML: Select this option to read XML file. If this option is selected, the following fields will get displayed:
Infer schema: Enable this option to get true schema of the column.
Path: Provide the path of the file.
Root Tag: Provide the root tag from the XML files.
Row Tags: Provide the row tags from the XML files.
Join Row Tags: Enable this option to join multiple row tags.
ORC: Select this option to read ORC file. If this option is selected, the following fields will get displayed:
Push Down: In ORC (Optimized Row Columnar) file format, "push down" typically refers to the ability to push down predicate filters to the storage layer for processing. There will be two options in it:
True: When push down is set to True, it indicates that predicate filters can be pushed down to the ORC storage layer for filtering rows at the storage level. This can improve query performance by reducing the amount of data that needs to be read into memory for processing.
False: When push down is set to False, predicate filters are not pushed down to the ORC storage layer. Instead, filtering is performed after the data has been read into memory by the processing engine. This may result in more data being read and potentially slower query performance compared to when push down is enabled.
Path: Provide the path of the file.
Partition Columns: Provide a unique Key column name to partition data in Spark.
An Elasticsearch reader component is designed to read and access data stored in an Elasticsearch index. Elasticsearch readers typically authenticate with Elasticsearch using username and password credentials, which grant access to the Elasticsearch cluster and its indexes.
All component configurations are classified broadly into the following sections:
Meta Information
Please follow the given demonstration to configure the component.
Host IP Address: Enter the host IP Address for Elastic Search.
Port: Enter the port to connect with Elastic Search.
Index ID: Enter the Index ID to read a document in Elasticsearch. In Elasticsearch, an index is a collection of documents that share similar characteristics, and each document within an index has a unique identifier known as the index ID. The index ID is a unique string that is automatically generated by Elasticsearch and is used to identify and retrieve a specific document from the index.
Resource Type: Provide the resource type. In Elasticsearch, a resource type is a way to group related documents together within an index. Resource types are defined at the time of index creation, and they provide a way to logically separate different types of documents that may be stored within the same index.
Is Date Rich True: Enable this option if any fields in the reading file contain date or time information. The date rich feature in Elasticsearch allows for advanced querying and filtering of documents based on date or time ranges, as well as date arithmetic operations.
Username: Enter the username for elastic search.
Password: Enter the password for elastic search.
Query: Provide a spark SQL query.
This page covers configuration details for the MongoDB Reader component.
A MongoDB reader is designed to read and access data stored in a MongoDB database. Mongo readers typically authenticate with MongoDB using a username and password or other authentication mechanisms supported by MongoDB.
All component configurations are classified broadly into the following sections:
Meta Information
Please follow the demonstration to configure the component.
MongoDB Reader reads the data from the specified collection of Mongo Database. It has an option to filter data using spark SQL query.
Drag & Drop the MongoDB Reader on the Workflow Editor.
Click on the dragged reader component to open the component properties tabs below.
It is the default tab to open for the MongoDB reader while configuring the component.
Select an Invocation type from the drop-down menu to confirm the running mode of the reader component. Select the Real-Time or Batch option from the drop-down menu.
Deployment Type: It displays the deployment type for the component. This field comes pre-selected.
Container Image Version: It displays the image version for the docker container. This field comes pre-selected.
Failover Event: Select a failover Event from the drop-down menu.
Batch Size: Provide the maximum number of records to be processed in one execution cycle.
Please Note: The fields marked as (*) are mandatory fields.
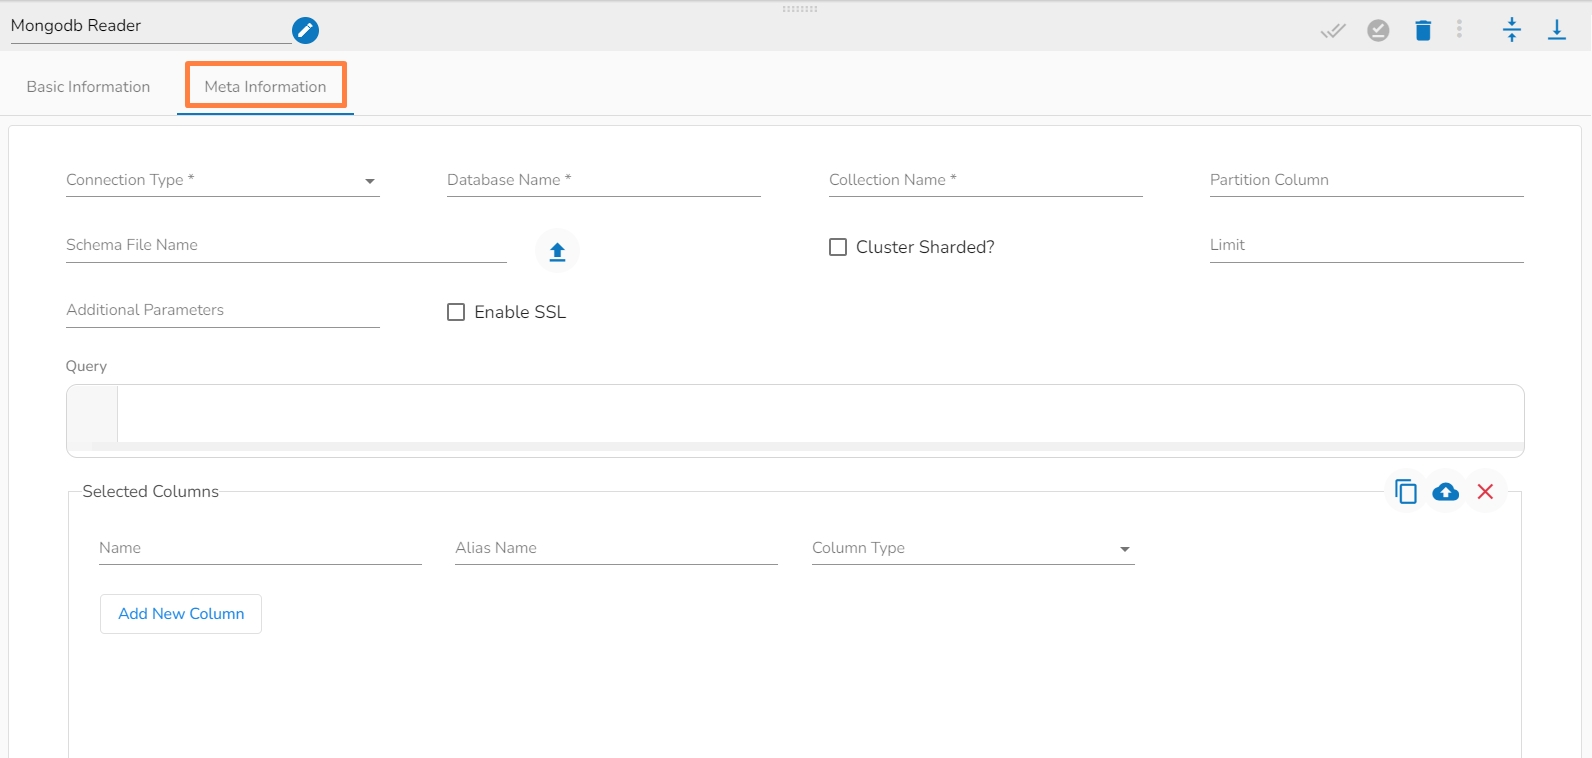
Connection Type: Select the connection type from the drop-down:
Standard
SRV
Connection String
Host IP Address (*): Hadoop IP address of the host.
Port(*): Port number (It appears only with the Standard Connection Type).
Username(*): Provide username.
Password(*): Provide a valid password to access the MongoDB.
Database Name(*): Provide the name of the database from where you wish to read data.
Collection Name(*): Provide the name of the collection.
Partition Column: specify a unique column name, whose value is a number .
Query: Enter a Spark SQL query. Take the mongo collection_name as the table name in Spark SQL query.
Limit: Set a limit for the number of records to be read from MongoDB collection.
Schema File Name: Upload Spark Schema file in JSON format.
Cluster Sharded: Enable this option if data has to be read from sharded clustered database. A sharded cluster in MongoDB is a distributed database architecture that allows for horizontal scaling and partitioning of data across multiple nodes or servers. The data is partitioned into smaller chunks, called shards, and distributed across multiple servers.
Additional Parameters: Provide the additional parameters to connect with MongoDB. This field is optional.
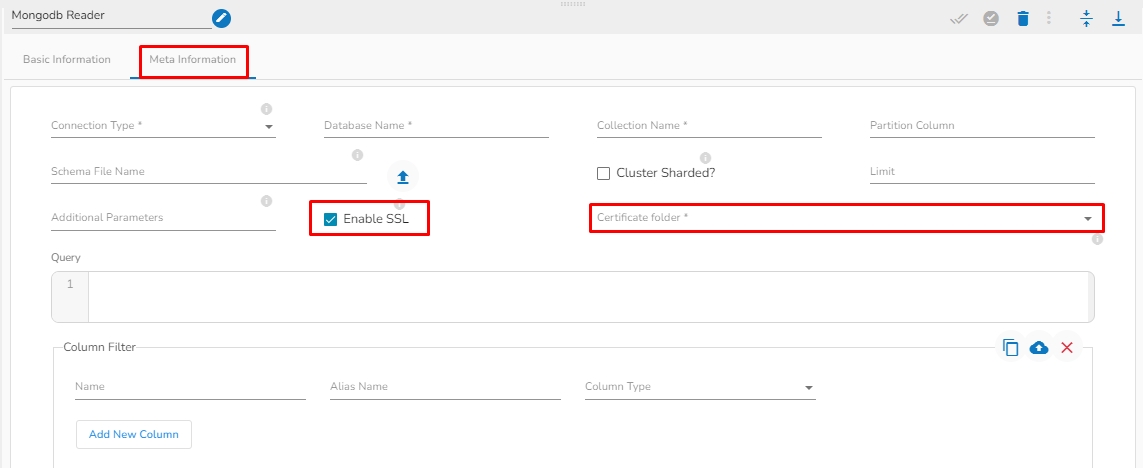
Enable SSL: Check this box to enable SSL for this components. MongoDB connection credentials will be different if this option is enabled.
Certificate Folder: This option will appear when the Enable SSL field is checked-in. The user has to select the certificate folder from drop down which contains the files which has been uploaded to the admin settings for connecting MongoDB with SSL. Please refer the below given images for the reference.
Sample Spark SQL query for MongoDB Reader:
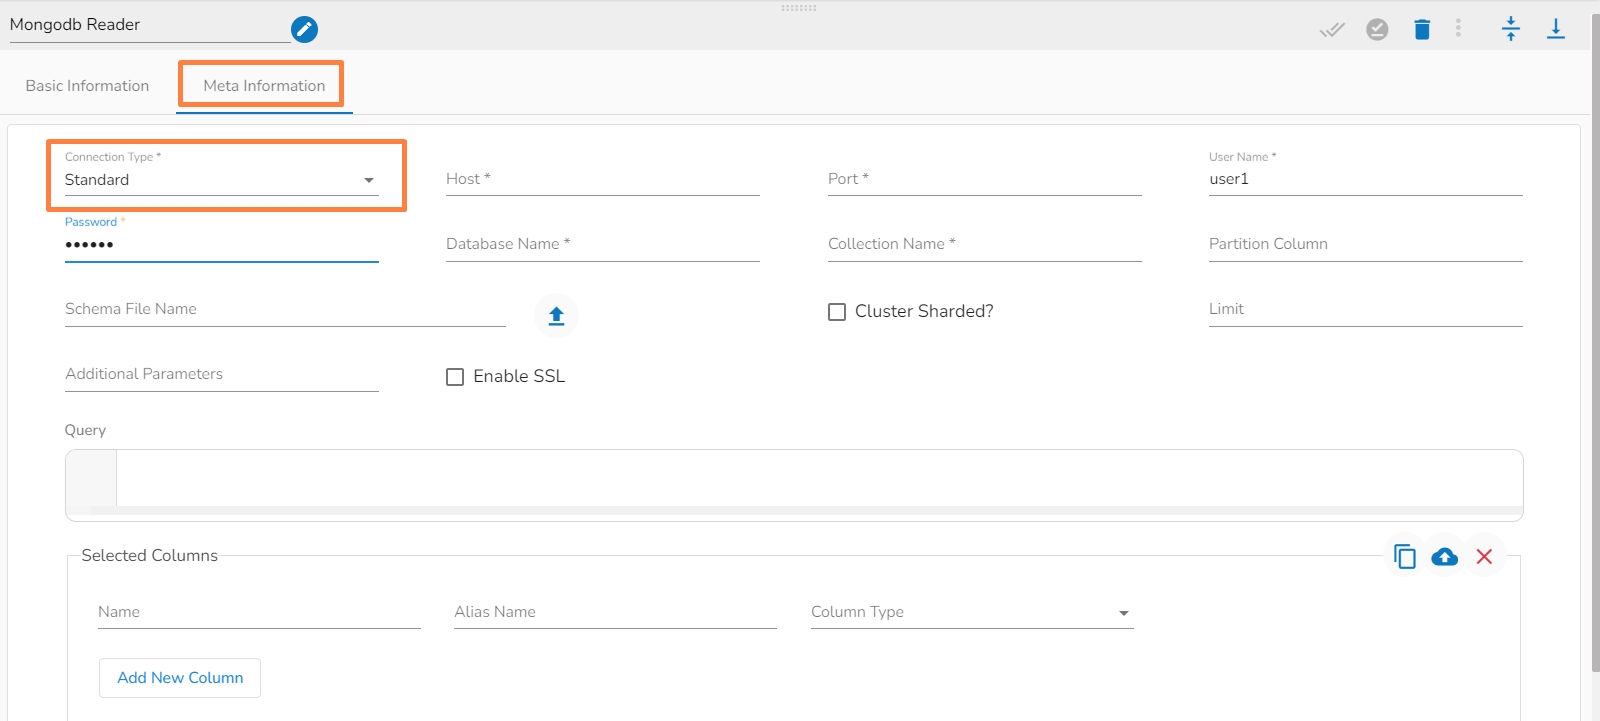
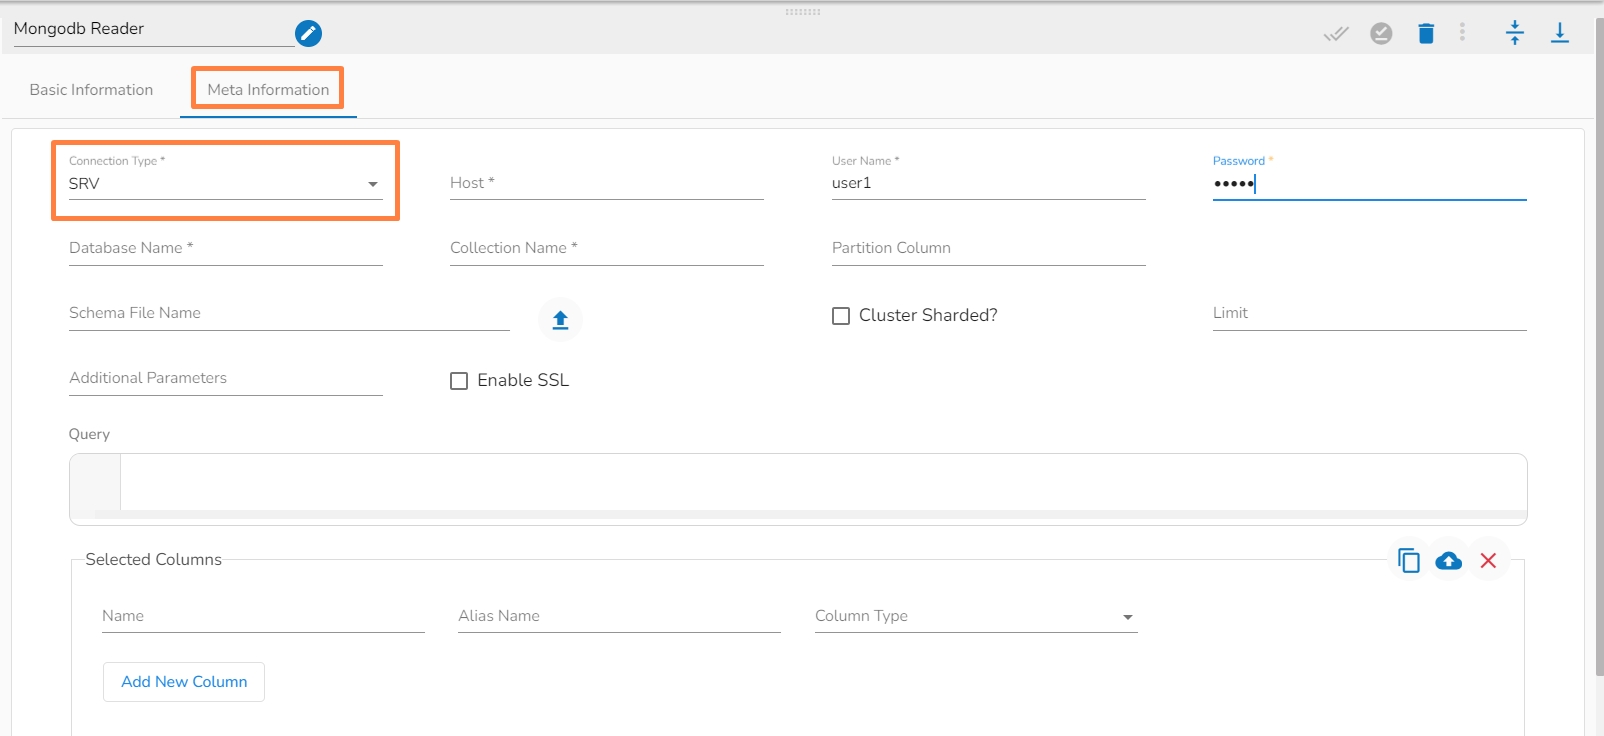
Please Note: The Meta Information fields vary based on the selected Connection Type option.
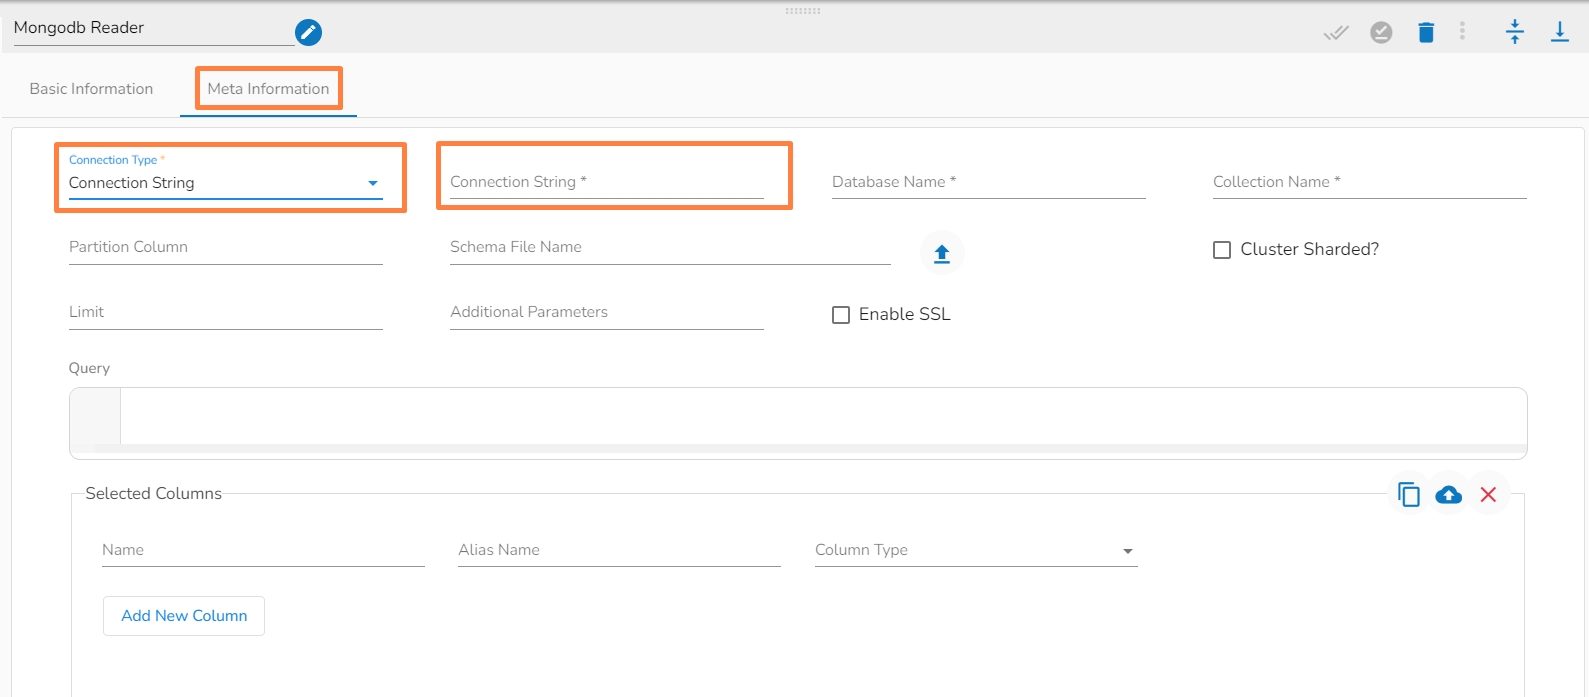
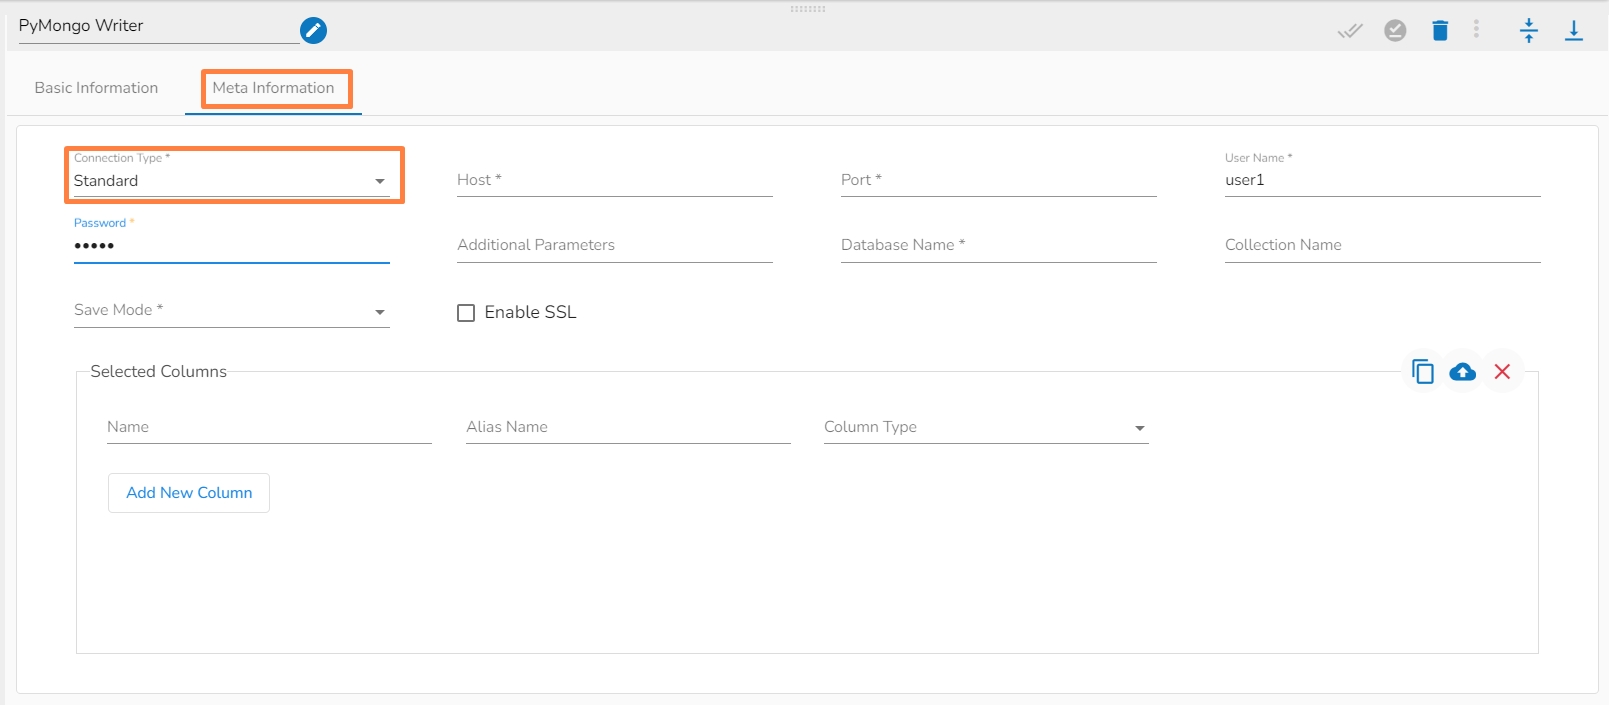
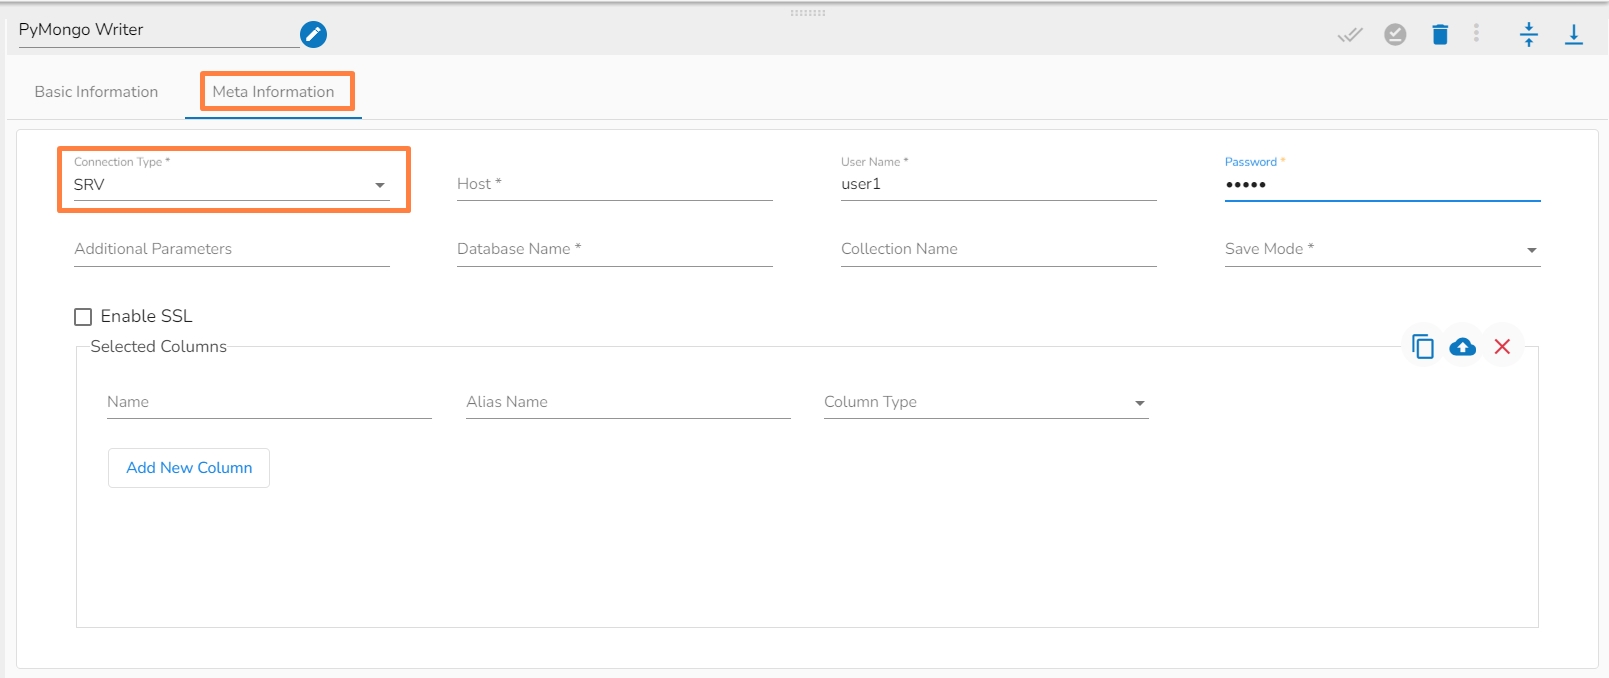
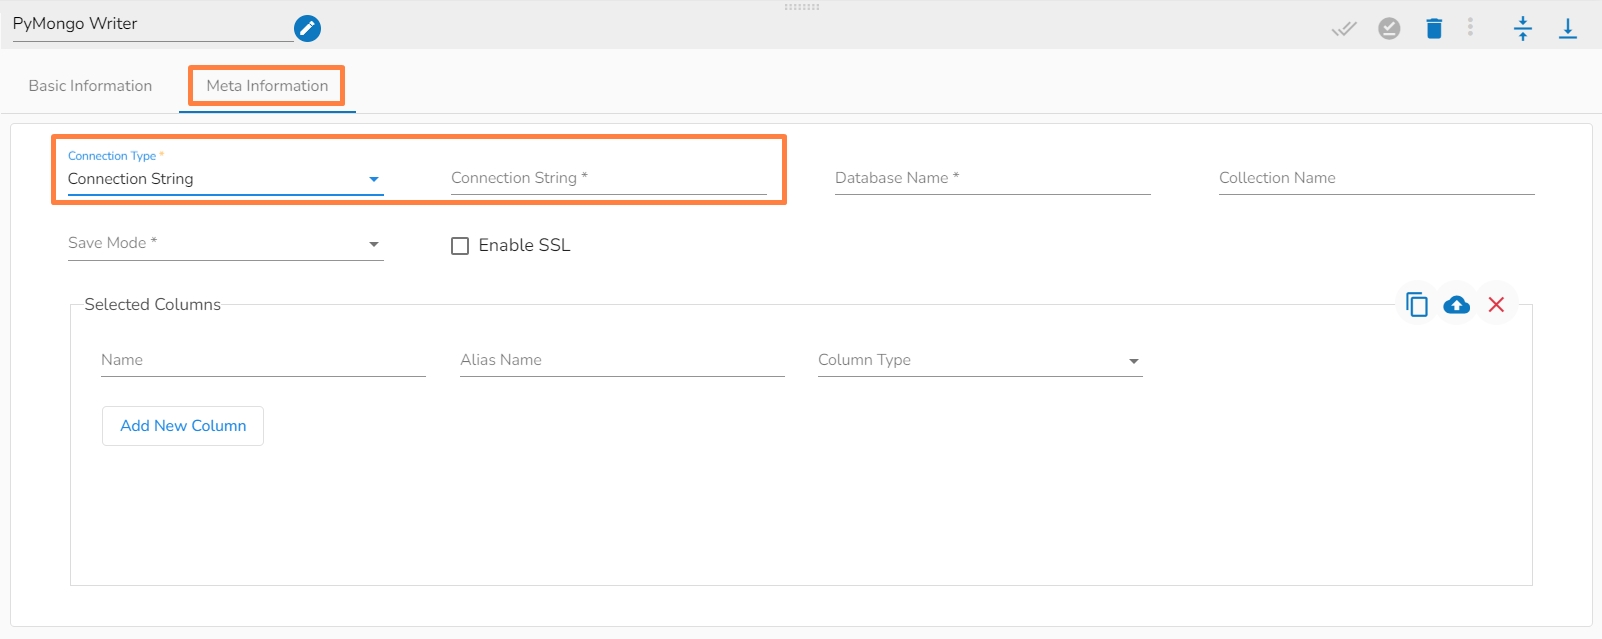
The following images display the various possibilities of the Meta Information for the MongoDB Reader:
i. Meta Information Tab with Standard as Connection Type.
ii. Meta Information Tab with SRV as Connection Type.
iii. Meta Information Tab with Connection String as Connection Type.
Column Filter: The users can select some specific columns from the table to read data instead of selecting a complete table; this can be achieved via the Column Filter section. Select the columns which you want to read and if you want to change the name of the column, then put that name in the alias name section otherwise keep the alias name the same as of column name and then select a Column Type from the drop-down menu.
or
Use the Download Data and Upload File options to select the desired columns.
1. Upload File: The user can upload the existing system files (CSV, JSON) using the Upload File icon (file size must be less than 2 MB).
2. Download Data (Schema): Users can download the schema structure in JSON format by using the Download Data icon.
After doing all the configurations click the Save Component in Storage icon provided in the reader configuration panel to save the component.
A notification message appears to inform about the component configuration success.
SFTP Reader is designed to read and access files stored on an SFTP server. SFTP readers typically authenticate with the SFTP server using a username and password or SSH key pair, which grants access to the files stored on the server
All component configurations are classified broadly into the following sections:
Meta Information
Please follow the demonstration to configure the SFTP Reader and its meta information.
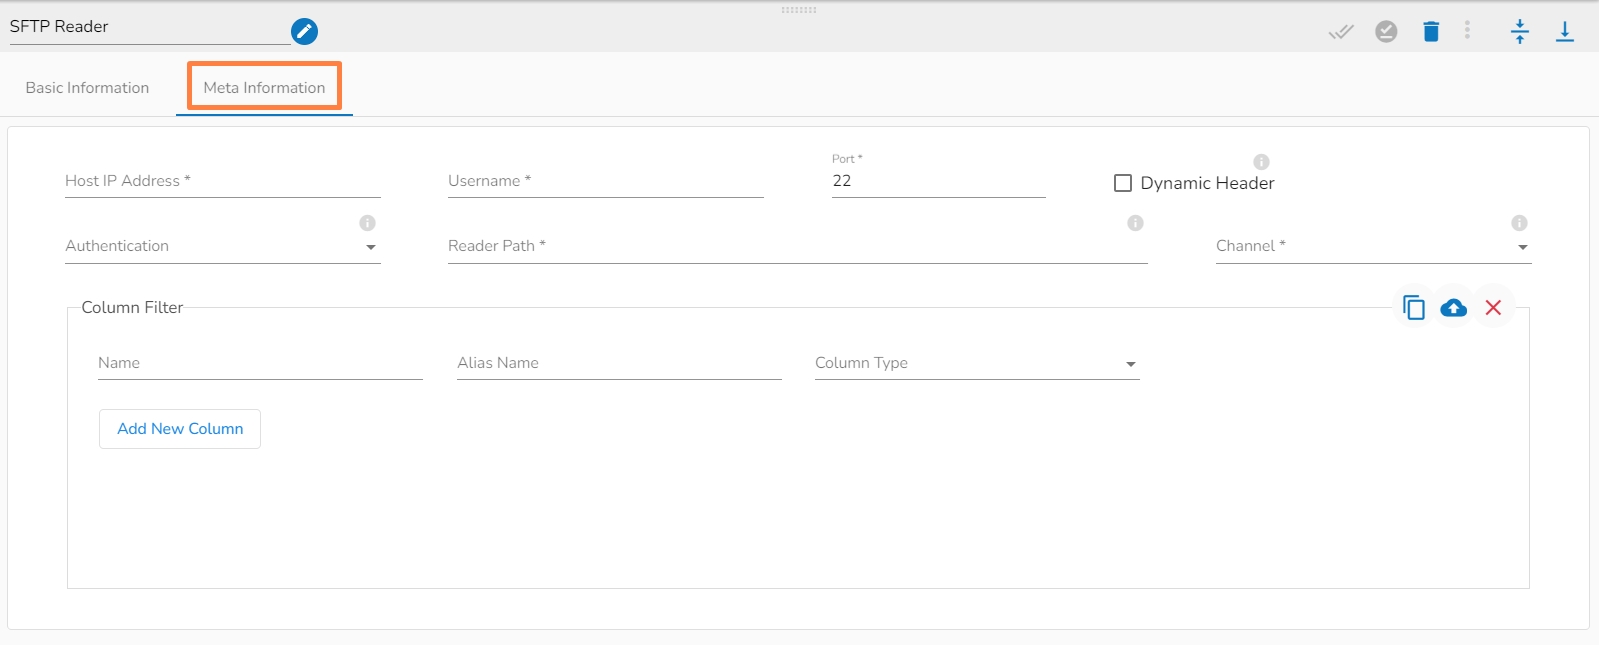
Please go through the below given steps to configure SFTP Reader component:
Host: Enter the host.
Username: Enter username for SFTP reader.
Port: Provide the Port number.
Dynamic Header: It can automatically detect the header row in a file and adjust the column names and number of columns as necessary.
Authentication: Select an authentication option using the drop-down list.
Password: Provide a password to authenticate the SFTP component
PEM/PPK File: Choose a file to authenticate the SFTP component. The user must upload a file if this authentication option is selected.
Reader Path: Enter the path from where the file has to be read.
Channel: Select a channel option from the drop-down menu (the supported channel is SFTP).
Column filter: Select the columns that you want to read and if you change the name of the column, then put that name in the alias name section otherwise keep the alias name the same as the column name and then select a Column Type from the drop-down menu.
Use the Download Data and Upload File options to select the desired columns.
Upload File: The user can upload the existing system files (CSV, JSON) using the Upload File icon.
Download Data (Schema): Users can download the schema structure in JSON format by using the Download Data icon.
There is a resource configuration tab while configuring the components.
The Data Pipeline contains an option to configure the resources i.e., Memory & CPU for each component that gets deployed.
There are two types of components-based deployment types:
Docker
Spark
After we save the component and pipeline, The component gets saved with the default configuration of the pipeline i.e. Low, Medium, and High. After the users save the pipeline, we can see the configuration tab in the component. There are multiple things:
There are Request and Limit configurations needed for the Docker components.
The users can see the CPU and Memory options to be configured.
CPU: This is the CPU config where we can specify the number of cores that we need to assign to the component.
Please Note: 1000 means 1 core in the configuration of docker components.
When we put 100 that means 0.1 core has been assigned to the component.
Memory: This option is to specify how much memory you want to dedicate to that specific component.
Please Note: 1024 means 1GB in the configuration of the docker components.
Instances: The number of instances is used for parallel processing. If the users. give N no of instances those many pods will be deployed.
Spark Component has the option to give the partition factor in the Basic Information tab. This is critical for parallel spark jobs.
Please follow the given example to achieve it:
E.g., If the users need to run 10 parallel spark processes to write the data where the number of inputs Kafka topic partition is 5 then, they will have to set the partition count to 2[i.e., 5*2=10 jobs]. Also, to make it work the number of cores * number of instances should be equal to 10.2 cores * 5
instances =10 jobs.
The configuration of the Spark Components is slightly different from the Docker components. When the spark components are deployed, there are two pods that come up:
Driver
Executor
Provide the Driver and Executor configurations separately.
Instances: The number of instances used for parallel processing. If we give N as the number of instances in the Executor configuration N executor pods will get deployed.
Please Note: Till the current release, the minimum requirement to deploy a driver is 0.1 Cores and 1 core for the executor. It can change with the upcoming versions of Spark.
This page pays attention to describe the Basic Info tab provided for the pipeline components. This tab has to be configured for all the components.
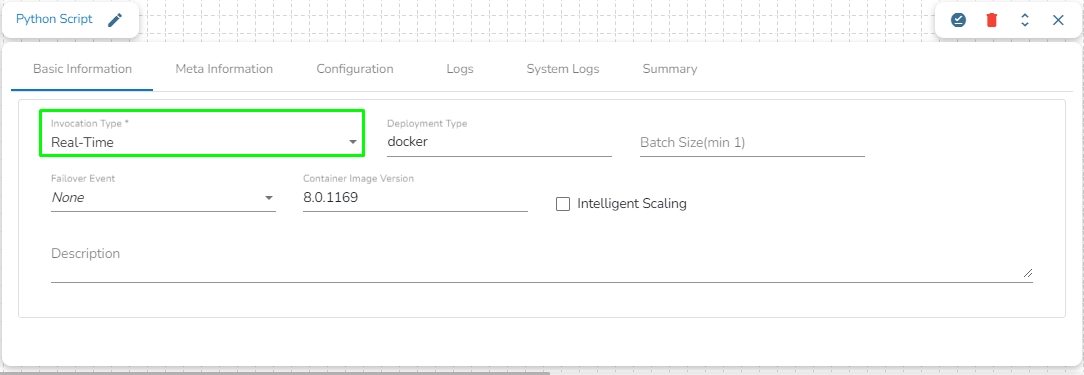
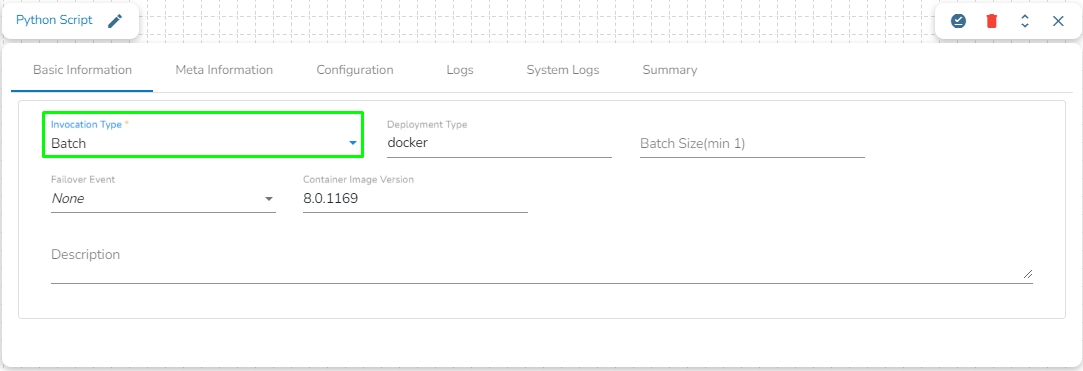
The Invocation-Type config decides the type of deployment of the component. There are following two types of invocations:
Real-Time
Batch
When the Component has the real-time invocation, the component never goes down when the pipeline is active. This is for situations where you want to keep the component ready all the time to consume data.
When "Realtime" is selected as the invocation type, we have an additional option to scale up the component called "Intelligent Scaling."
Please Note: The First Component of the pipeline must be in real-time invocation.
When the component has the batch invocation type then the component needs a trigger to initiate the process from the previous event. Once the process of the component is finished and there are no new events to process the component goes down.
These are really helpful in Batch or scheduled operations where the data is not streaming or real-time.
Please Note: When the users select the Batch invocation type, they get an additional option of the Grace Period (in sec). This grace period is the time that the component will take to go down gracefully. The default value for Grace Period is 60 seconds and it can be configured by the user.
The pipeline components process the data in micro-batches. This batch size is given to define the maximum number of records that you want to process in a single cycle of operation; This is really helpful if you want to control the number of records being processed by the component if the unit record size is huge. You can configure it in the base config of the components.
The below given illustration displays how to update the Batch Size configuration.
We can create a failover event and map it in the component base configuration, so that if the component fails it audits all the failure messages with the data (if available) and timestamp of the error.
Go through the illustration given below to understand the Failover Events.
Please refer to the following page to learn more about .
Mongo DB reader component contains both the deployment-types: Spark & Docker
Data writers specifically focus on the final stage of the pipeline, where the processed or transformed data is written to the target destination. This section explains all the supported Data Writers.
The Big Query Reader Component is designed for efficient data access and retrieval from Google Big Query, a robust data warehousing solution on Google Cloud. It enables applications to execute complex SQL queries and process large datasets seamlessly. This component simplifies data retrieval and processing, making it ideal for data analysis, reporting, and ETL workflows.
All component configurations are classified broadly into the following sections:
Navigate to the Data Pipeline Editor.
Expand the Reader section provided under the Component Pallet.
Drag and drop the Big Query Reader component to the Workflow Editor.
Click on the dragged Big Query Reader to get the component properties tabs.
It is the default tab to open for the component while configuring it.
Invocation Type: Select an invocation mode from the ‘Real-Time’ or ‘Batch’ using the drop-down menu.
Deployment Type: It displays the deployment type for the reader component. This field comes pre-selected.
Batch Size (min 1): Provide the maximum number of records to be processed in one execution cycle (Min limit for this field is 1).
Failover Event: Select a failover Event from the drop-down menu.
Container Image Version: It displays the image version for the docker container. This field comes pre-selected.
Open the Meta Information tab and fill in all the connection-specific details for the Big Query Reader.
Read using: The 'Service Account' option is available under this field, so select it.
Dataset Id: Mention the Dataset ID from Big Query which is to be read.
Table Id: Mention the Table ID from Big Query which is to be read.
Location (*): Mention the location according to your Project.
Limit: Set a limit for the number of records to be read.
Query: Enter an SQL Query.
A notification message appears to inform about the component configuration success.
Azure Metadata Reader is designed to read and access metadata associated with Azure resources. Azure Metadata Readers typically authenticate with Azure using Azure Active Directory credentials or other authentication mechanisms supported by Azure.
All component configurations are classified broadly into the following sections:
Meta Information
Please Note: Please go through the below given demonstration to configure Azure Metadata Reader in the pipeline.
Please Note: Before starting to use the Azure Reader component, please follow the steps below to obtain the Azure credentials from the Azure Portal:
Accessing Azure Blob Storage: Shared Access Signature (SAS), Secret Key, and Principal Secret
This document outlines three methods for accessing Azure Blob Storage: Shared Access Signatures (SAS), Secret Keys, and Principal Secrets.
Understanding Security Levels:
Shared Access Signature (SAS): This is the recommended approach due to its temporary nature and fine-grained control over access permissions. SAS tokens can be revoked, limiting potential damage if compromised.
Secret Key: Secret keys grant full control over your storage account. Use them with caution and only for programmatic access. Consider storing them securely in Azure Key Vault and avoid hardcoding them in scripts.
Principal Secret: This applies to Azure Active Directory (Azure AD) application access. Similar to secret keys, use them cautiously and store them securely (e.g., Azure Key Vault).
1. Shared Access Signature (SAS):
Benefits:
Secure: Temporary and revocable, minimizing risks.
Granular Control: Define specific permissions (read, write, list, etc.) for each SAS token.
Steps to Generate an SAS Token:
Navigate to Azure Portal: Open the Azure portal (https://azure.microsoft.com/en-us/get-started/azure-portal) and log in with your credentials.
Access Blob Storage Account: Locate "Storage accounts" in the left menu and select your storage account.
Configure SAS Settings: Find and click on "Shared access signature" in the settings. Define the permissions, expiry date, and other parameters for your needs.
Generate SAS Token: Click on "Generate SAS and connection string" to create the SAS token.
Copy and Use SAS Token: Copy the generated SAS token. Use this token to securely access your Blob Storage resources in your code.
2. Secret Key:
Use with Caution:
High-Risk: Grants full control over your storage account.
Secure Storage: Store them securely in Azure Key Vault, never hardcode them in scripts.
Steps to Obtain Secret Key:
Navigate to Azure Portal: Open the Azure portal and log in.
Access Blob Storage Account: Locate and select your storage account.
View Secret Keys: Click on "Access keys" to view your storage account keys. Do not store these directly in code. Consider Azure Key Vault for secure storage.
3. Principal Secret (Azure AD Application):
Use for Application Access:
Grants access to your storage account through an Azure AD application.
Secure Storage: Store them securely in Azure Key Vault, never hardcode them in scripts.
Steps to Obtain Principal Secret:
Navigate to Azure AD Portal: Open the Azure AD portal (https://azure.microsoft.com/en-us/get-started/azure-portal) and log in with your credentials.
Access App Registrations: Locate "App registrations" in the left menu.
Select Your Application: Find and click on the application for which you want to obtain the principal secret.
Access Certificates & Secrets: Inside your application, go to "Certificates & secrets" in the settings menu.
Generate New Client Secret (Principal Secret):
Under "Client secrets," click on "New client secret."
Enter a description, select the expiry duration, and click "Add" to generate the new client secret.
Copy the generated client secret immediately as it will be hidden afterward.
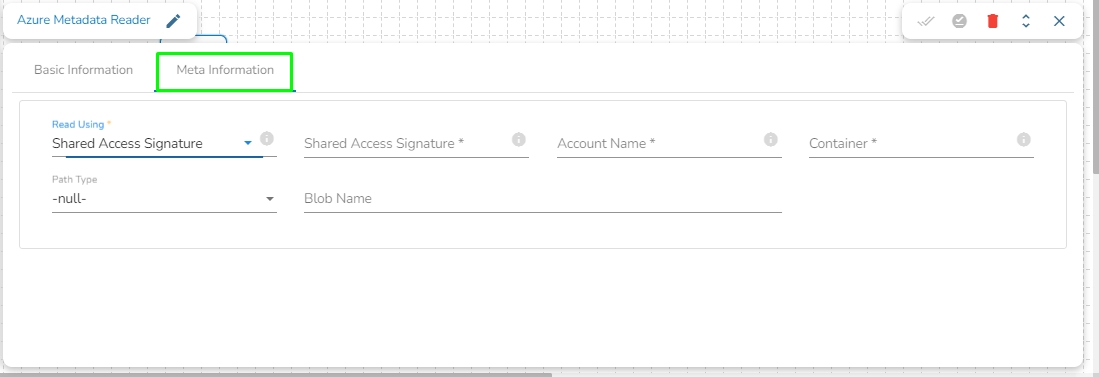
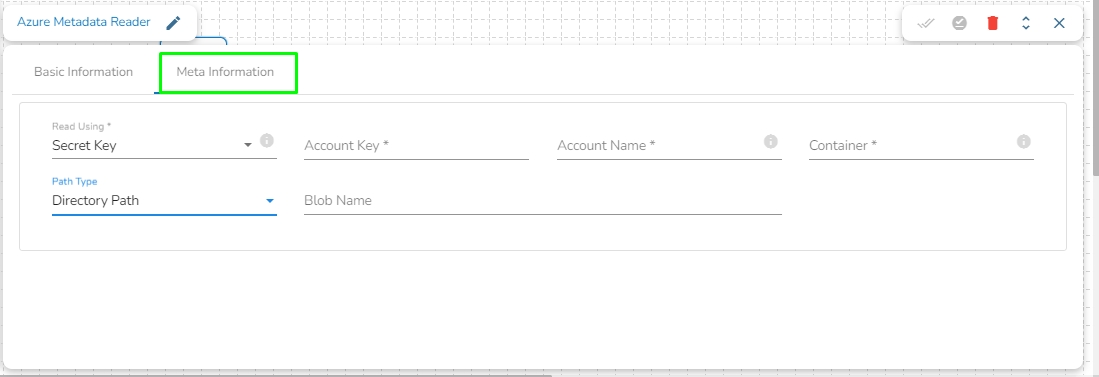
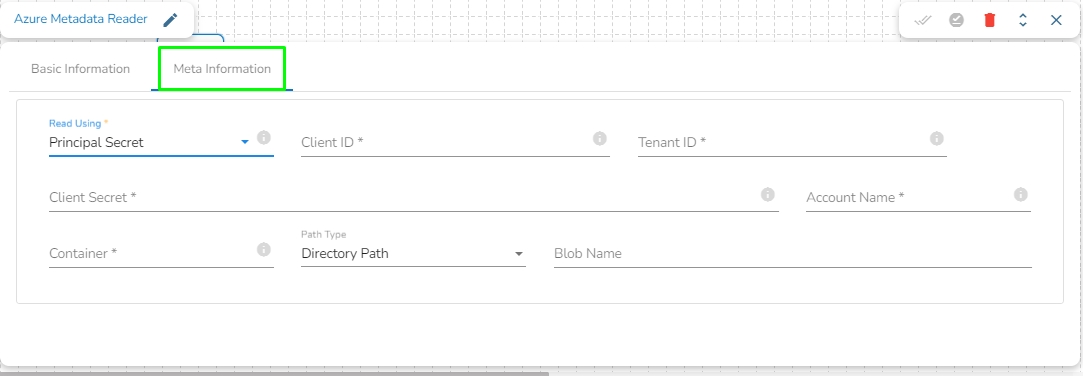
Read Using: There are three authentication methods available to connect with Azure in the Azure Blob Reader Component:
Shared Access Signature
Secret Key
Principal Secret
Provide the following details:
Shared Access Signature: This is a URI that grants restricted access rights to Azure Storage resources.
Account Name: Provide the Azure account name.
Container: Provide the container name from where the file is located and which has to be read.
Path type: There are options available under it:
Null: If Null is selected as the Path Type, the component will read the metadata of all the blobs from the given container. The user does not need to fill the Blob Name field in this option.
Directory Path: Enter the directory path to read the metadata of files located in the specified directory. For example: employee/joining_year=2010/department=BI/designation=Analyst/.
Blob Name: Specify the blob name to read the metadata from that particular blob.
Provide the following details:
Account Key: It is be used to authorize access to data in your storage account via Shared Key authorization.
Account Name: Provide the Azure account name.
Container: Provide the container name from where the file is located and which has to be read.
Path type: There are options available under it:
Null: If Null is selected as the Path Type, the component will read the metadata of all the blobs from the given container. The user does not need to fill the Blob Name field in this option.
Directory Path: Enter the directory to read the metadata of files located in the specified directory. For example: employee/joining_year=2010/department=BI/designation=Analyst/.
Blob Name: Specify the blob name to read the metadata from that particular blob.
Provide the following details:
Client ID: The client ID is the unique Application (client) ID assigned to your app by Azure AD when the app was registered.
Tenant ID: It is a globally unique identifier (GUID) that is different than your organization name or domain.
Client Secret: The client secret is the password of the service principal.
Account Name: Provide the Azure account name.
Container: Provide the container name from where the file is located and which has to be read.
Path type: There are options available under it:
Null: If Null is selected as the Path Type, the component will read the metadata of all the blobs from the given container. The user does not need to fill the Blob Name field in this option.
Directory Path: Enter the directory to read the metadata of files located in the specified directory. For example: employee/joining_year=2010/department=BI/designation=Analyst/.
Blob Name: Specify the blob name to read the metadata from that particular blob.
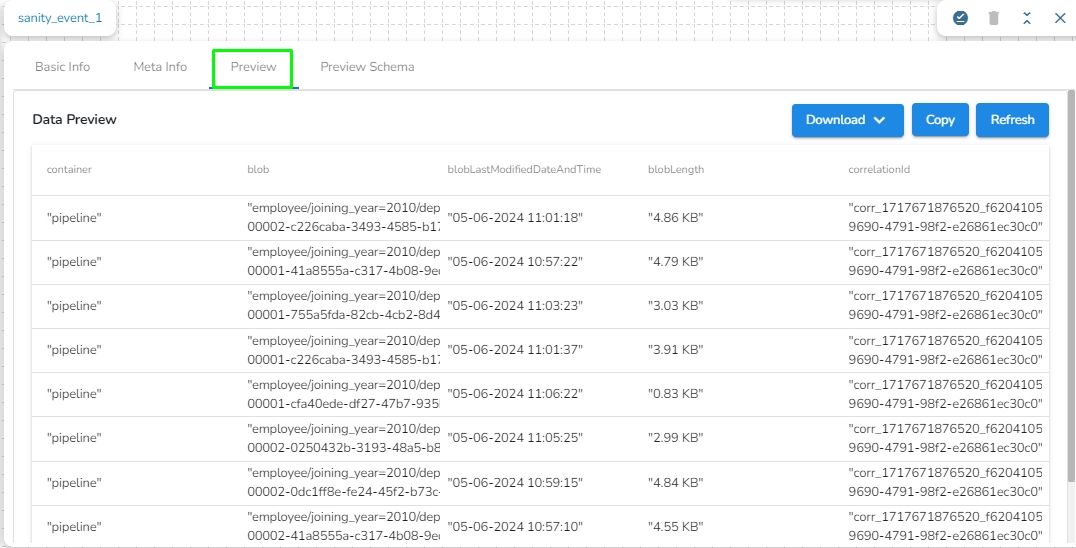
Once the component runs successfully, it will send the following metadata to the output event:
Container: Name of the container where the blob is present.
Blob: Name of the blob present in the specified path.
blobLastModifiedDateAndTime: Date and time when the blob was last modified.
blobLength: Size of the blob.
A MongoDB reader component is designed to read and access data stored in a MongoDB database. Mongo readers typically authenticate with MongoDB using a username and password or other authentication mechanisms supported by MongoDB.
This page covers the configuration steps for the Mongo DB Reader.All component configurations are classified broadly into the following sections:
Meta Information
MongoDB Reader reads data from the specified database’s Collection. It also has an option to filter the data using Mongo Query Language(MQL), Which will run the MQL directly on the MongoDB Server, and push the data to the out event.
Check out the below-given walk through about the MongoDB Reader Lite.
Drag & drop the Mongo Reader component to the Workflow Editor.
Click on the dragged reader component.
The component properties tabs open below.
It is the default tab to open for the Mongodb Reader Lite while configuring the component.
Select an Invocation Type from the drop-down menu to confirm the running mode of the reader component. Select Real-Time or Batch from the drop-down menu.
Deployment Type: It displays the deployment type for the component (This field comes pre-selected).
Container Image Version: It displays the image version for the docker container (This field comes pre-selected).
Failover Event: Select a failover Event from the drop-down menu.
Batch Size (min 10): Provide the maximum number of records to be processed in one execution cycle (Min limit for this field is 10).
Please Note: The Grace Period Field appears when the Batch is selected as the Invocation Type option in the Basic Information tab. You can now give a grace period for components to go down gracefully after that time by configuring this field.
Open the Meta Information tab and fill in all the connection-specific details of MongoDB Reader Lite. The Meta Information tab opens with the below given fields:
Please Note: The Meta Information fields may vary based on the selected Connection Type option.
Please Note: The fields marked as (*) are mandatory fields.
Connection Type: Select either of the options out of Standard, SRV, and Connection String as connection types.
Port number (*): Provide the Port number (It appears only with the Standard connection type).
Host IP Address (*): The IP address of the host.
Username (*): Provide a username.
Password (*): Provide a valid password to access the MongoDB.
Database Name (*): Provide the name of the database where you wish to write data.
Collection Name (*): Provide the name of the collection.
Fetch size: Specifies the number of documents to return in each batch of the response from the MongoDB collection. For ex: If 1000 is given in the fetch size field. Then it will read the 1000 data at one execution and it will process it further.
Additional Parameters: Provide details of the additional parameters.
Enable SSL: Check this box to enable SSL for this components. MongoDB connection credentials will be different if this option is enabled.
The user needs to upload the following files on the certificate upload page:
Certificate file (.pem format)]
Key file (.key format)
Certificate Folder: This option will appear when the Enable SSL field is checked-in. The user has to select the certificate folder from drop down which contains the files which has been uploaded to the admin settings for connecting MongoDB with SSL. Please refer the below given images for the reference.
Connection String (*): Provide a connection string (It appears only with the Connection String connection type).
Query: Provide a relevant query service. We can write the Mongo queries in the following manner:
Meta Information Tab with enabled the "Enable SSL" field:
After configuring the required configuration fields, click the Save Component in Storage icon provided in the reader configuration panel to save the component.
A confirmation message appears to notify the component properties are saved.
Click on the Update Pipeline icon to update the pipeline.
A confirmation message appears to inform the user.
Click on the Activate Pipeline icon.
The Confirm dialog box appears to ask the user permission.
Click the YES option.
A confirmation message appears to inform that the pipeline has been activated.
Click on the Toggle Log Panel icon.
The Log Panel opens displaying the Logs and Advance Logs tabs.
Please Note:
The Pod logs for the components appear in the Advanced Logs tab.
The overall component logs will be displayed in the Logs tab.
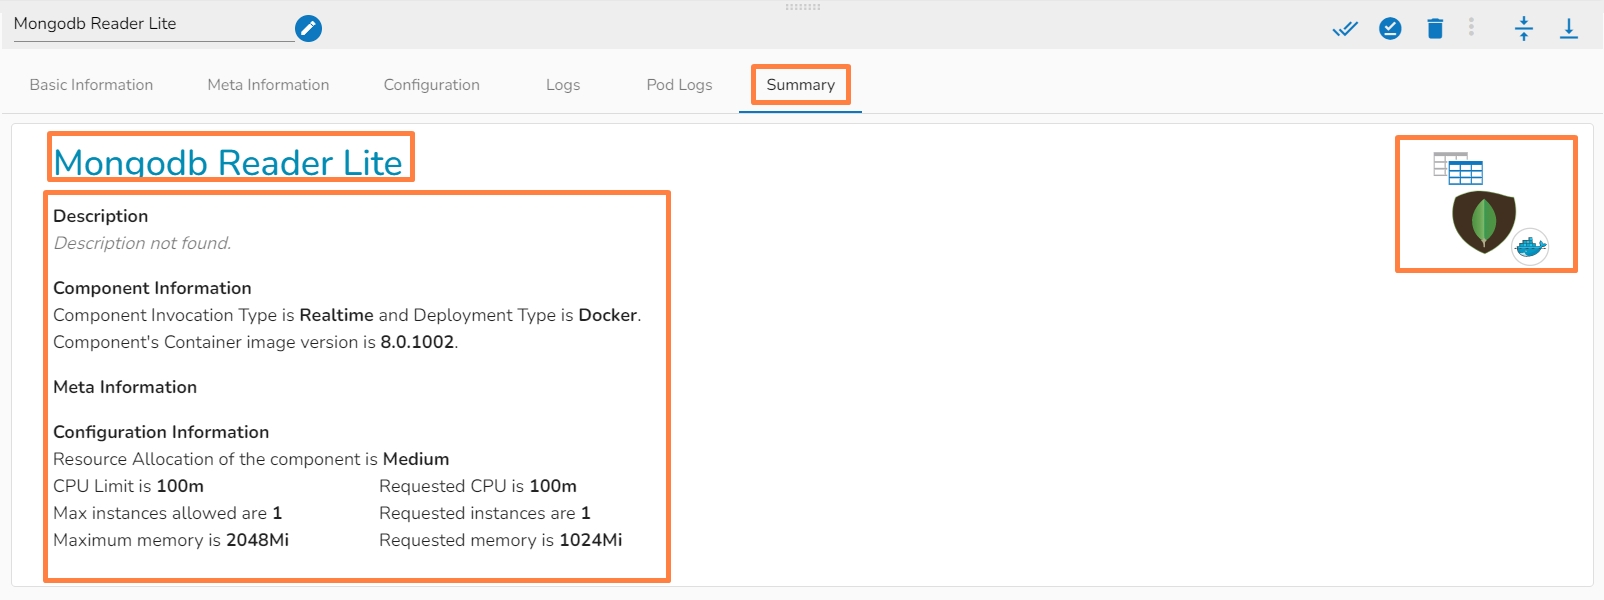
A configured component will display some more tabs such as the Configuration, Logs, and Pod Logs tabs (as displayed below for the Mongodb Reader Lite component).
This tab will show all the description about the component.
Azure Blob Reader is designed to read and access data stored in Azure Blob Storage. Azure Blob Readers typically authenticate with Azure Blob Storage using Azure Active Directory credentials or other authentication mechanisms supported by Azure. This is a spark based component.
All component configurations are classified broadly into the following sections:
Meta Information
Please Note: Please go through the below given demonstration to configure Azure Blob Reader in the pipeline.
Please Note: Before starting to use the Azure Reader component, please follow the steps below to obtain the Azure credentials from the Azure Portal:
Accessing Azure Blob Storage: Shared Access Signature (SAS), Secret Key, and Principal Secret
This document outlines three methods for accessing Azure Blob Storage: Shared Access Signatures (SAS), Secret Keys, and Principal Secrets.
Understanding Security Levels:
Shared Access Signature (SAS): This is the recommended approach due to its temporary nature and fine-grained control over access permissions. SAS tokens can be revoked, limiting potential damage if compromised.
Secret Key: Secret keys grant full control over your storage account. Use them with caution and only for programmatic access. Consider storing them securely in Azure Key Vault and avoid hardcoding them in scripts.
Principal Secret: This applies to Azure Active Directory (Azure AD) application access. Similar to secret keys, use them cautiously and store them securely (e.g., Azure Key Vault).
1. Shared Access Signature (SAS):
Benefits:
Secure: Temporary and revocable, minimizing risks.
Granular Control: Define specific permissions (read, write, list, etc.) for each SAS token.
Steps to Generate an SAS Token:
Navigate to Azure Portal: Open the Azure portal (https://azure.microsoft.com/en-us/get-started/azure-portal) and log in with your credentials.
Access Blob Storage Account: Locate "Storage accounts" in the left menu and select your storage account.
Configure SAS Settings: Find and click on "Shared access signature" in the settings. Define the permissions, expiry date, and other parameters for your needs.
Generate SAS Token: Click on "Generate SAS and connection string" to create the SAS token.
Copy and Use SAS Token: Copy the generated SAS token. Use this token to securely access your Blob Storage resources in your code.
2. Secret Key:
Use with Caution:
High-Risk: Grants full control over your storage account.
Secure Storage: Store them securely in Azure Key Vault, never hardcode them in scripts.
Steps to Obtain Secret Key:
Navigate to Azure Portal: Open the Azure portal and log in.
Access Blob Storage Account: Locate and select your storage account.
View Secret Keys: Click on "Access keys" to view your storage account keys. Do not store these directly in code. Consider Azure Key Vault for secure storage.
3. Principal Secret (Azure AD Application):
Use for Application Access:
Grants access to your storage account through an Azure AD application.
Secure Storage: Store them securely in Azure Key Vault, never hardcode them in scripts.
Steps to Obtain Principal Secret:
Navigate to Azure AD Portal: Open the Azure AD portal (https://azure.microsoft.com/en-us/get-started/azure-portal) and log in with your credentials.
Access App Registrations: Locate "App registrations" in the left menu.
Select Your Application: Find and click on the application for which you want to obtain the principal secret.
Access Certificates & Secrets: Inside your application, go to "Certificates & secrets" in the settings menu.
Generate New Client Secret (Principal Secret):
Under "Client secrets," click on "New client secret."
Enter a description, select the expiry duration, and click "Add" to generate the new client secret.
Copy the generated client secret immediately as it will be hidden afterward.
Read Using: There are three authentication methods available to connect with Azure in the Azure Blob Reader Component:
Shared Access Signature
Secret Key
Principal Secret
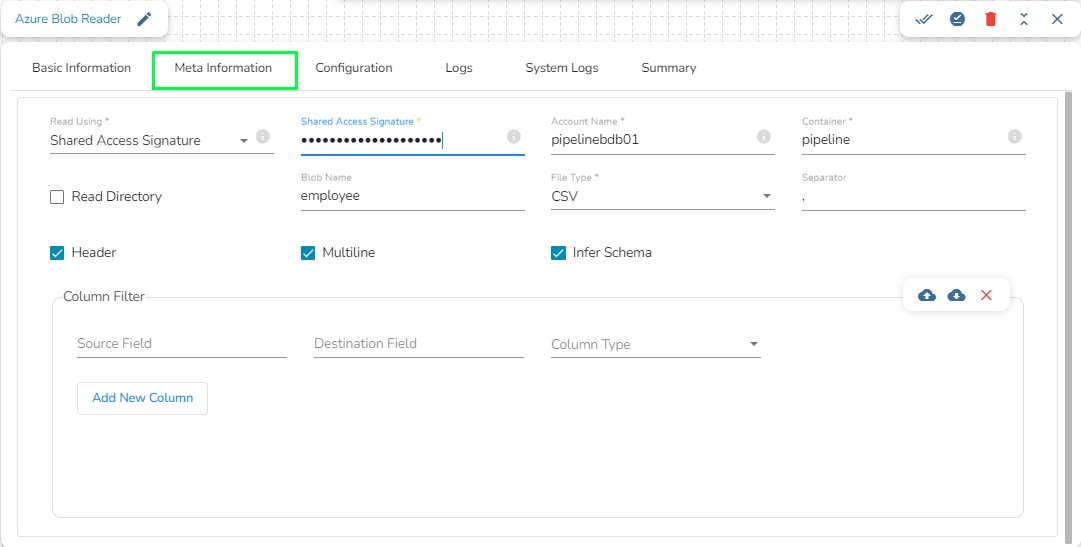
Provide the following details:
Shared Access Signature: This is a URI that grants restricted access rights to Azure Storage resources.
Account Name: Provide the Azure account name.
Container: Provide the container name from where the file is located and which has to be read.
File Type: There are five (5) types of file extensions available:
CSV
JSON
PARQUET
AVRO
XML
Read Directory: This field will be checked by default. If this option is enabled, the component will read data from all the blobs present in the container.
Blob Name: This field will display only if the Read Directory field is disabled. Enter the specific name of the blob whose data has to be read.
Limit: Enter a number to limit the number of records that has to be read by the component.
Column Filter: Enter the column names here. Only the specified columns will be fetched from Azure Blob. In this field, the user needs to fill in the following information:
Source Field: Enter the name of the column from the blob. The user can add multiple columns by clicking on the "Add New Column" option.
Destination Field: Enter the alias name for the source field.
Column Type: Enter the data type of the column.
Upload: This option allows the user to upload a data file in CSV, JSON, or EXCEL format. The column names will be automatically fetched from the uploaded data file and filled out in the Name, Alias, and Column Type fields.
Download Data: This option will download the data filled in the Column Filter field in JSON format.
Delete Data: This option will clear all the information filled in the Column Filter field.
Query: Enter a Spark SQL query in this field. Use inputDf as the table name.
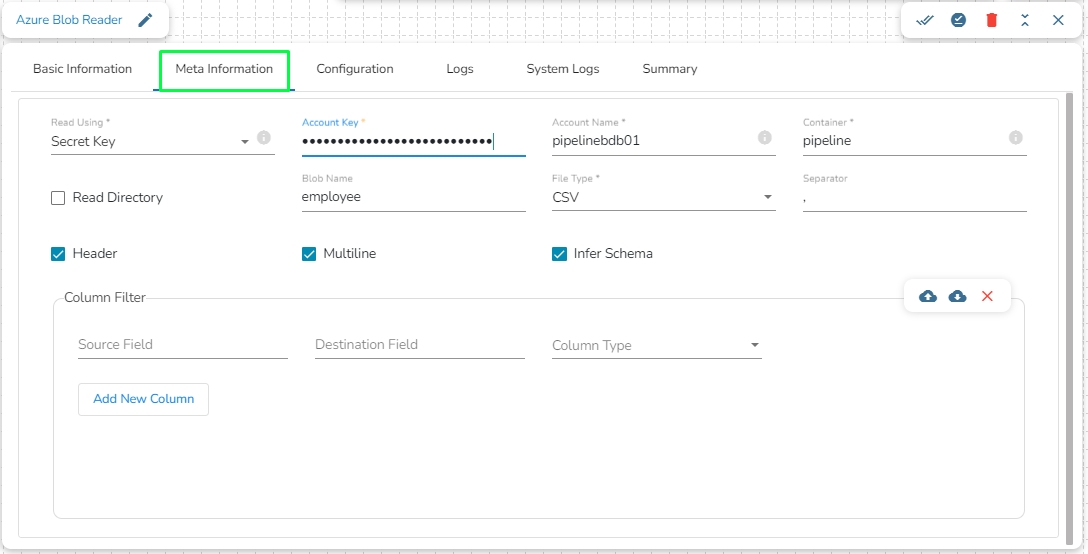
Provide the following details:
Account Key: Used to authorize access to data in your storage account via Shared Key authorization.
Account Name: Provide the Azure account name.
Container: Provide the container name from where the file is located and which has to be read.
File Type: There are five (5) types of file extensions available:
CSV
JSON
PARQUET
AVRO
XML
Read Directory: This field will be checked by default. If this option is enabled, the component will read data from all the blobs present in the container.
Blob Name: This field will display only if the Read Directory field is disabled. Enter the specific name of the blob whose data has to be read.
Limit: Enter a number to limit the number of records that has to be read by the component.
Column Filter: Enter the column names here. Only the specified columns will be fetched from Azure Blob. In this field, the user needs to fill in the following information:
Source Field: Enter the name of the column from the blob. The user can add multiple columns by clicking on the "Add New Column" option.
Destination Field: Enter the alias name for the source field.
Column Type: Enter the data type of the column.
Upload: This option allows the user to upload a data file in CSV, JSON, or EXCEL format. The column names will be automatically fetched from the uploaded data file and filled out in the Name, Alias, and Column Type fields.
Download Data: This option will download the data filled in the Column Filter field in JSON format.
Delete Data: This option will clear all the information filled in the Column Filter field.
Query: Enter a Spark SQL query in this field. Use inputDf as the table name.
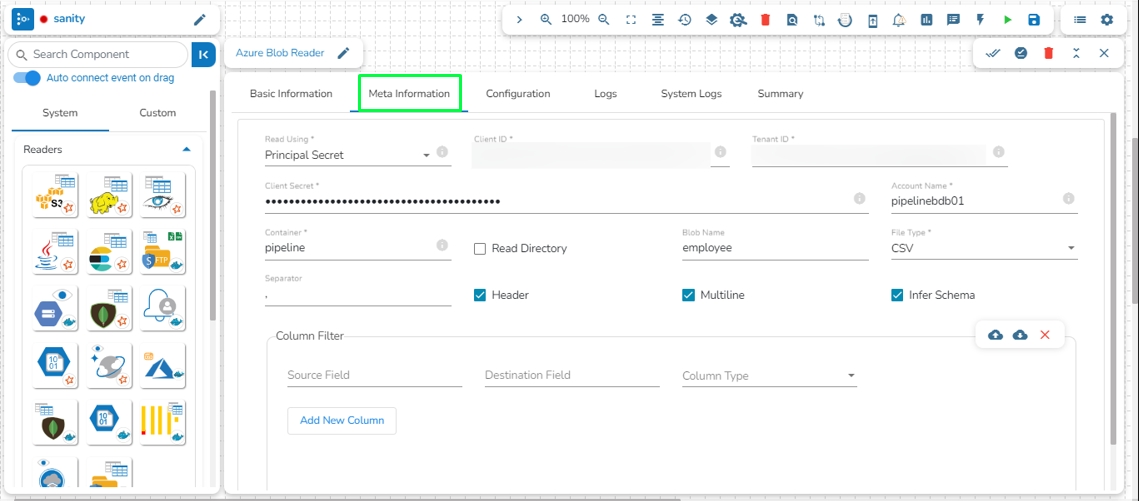
Provide the following details:
Client ID: The unique Application (client) ID assigned to your app by Azure AD when the app was registered.
Tenant ID: A globally unique identifier (GUID) that is different from your organization name or domain.
Client Secret: The password of the service principal.
Account Name: Provide the Azure account name.
File Type: There are five (5) types of file extensions available:
CSV
JSON
PARQUET
AVRO
XML
Read Directory: This field will be checked by default. If this option is enabled, the component will read data from all the blobs present in the container.
Blob Name: This field will display only if the Read Directory field is disabled. Enter the specific name of the blob whose data has to be read.
Limit: Enter a number to limit the number of records that has to be read by the component.
Column Filter: Enter the column names here. Only the specified columns will be fetched from Azure Blob. In this field, the user needs to fill in the following information:
Source Field: Enter the name of the column from the blob. The user can add multiple columns by clicking on the "Add New Column" option.
Destination Field: Enter the alias name for the source field.
Column Type: Enter the data type of the column.
Upload: This option allows the user to upload a data file in CSV, JSON, or EXCEL format. The column names will be automatically fetched from the uploaded data file and filled out in the Name, Alias, and Column Type fields.
Download Data: This option will download the data filled in the Column Filter field in JSON format.
Delete Data: This option will clear all the information filled in the Column Filter field.
Query: Enter a Spark SQL query in this field. Use inputDf as the table name.
Note: The following fields will be displayed after selecting the following file types:
CSV: The Header and Infer Schema fields get displayed with CSV as the selected File Type. Enable Header option to get the Header of the reading file and enable Infer Schema option to get true schema of the column in the CSV file.
JSON: The Multiline and Charset fields get displayed with JSON as the selected File Type.
Multiline: This option handles JSON files that contain records spanning multiple lines. Enabling this ensures the JSON parser reads multiline records correctly.
Charset: Specify the character set used in the JSON file. This defines the character encoding of the JSON file, such as UTF-8 or ISO-8859-1, ensuring correct interpretation of the file content.
PARQUET: No extra field gets displayed with PARQUET as the selected File Type.
AVRO: This File Type provides two drop-down menus.
Compression: Select an option out of the Deflate and Snappy options.
Deflate: A compression algorithm that balances between compression speed and compression ratio, often resulting in smaller file sizes.
Snappy: This compression type is select by default. A fast compression and decompression algorithm developed by Google, optimized for speed rather than maximum compression ratio.
Compression Level: This field appears if Deflate compression is selected. It provides a drop-down menu with levels ranging from 0 to 9, indicating the compression intensity.
The Connection Validation option helps the users to validate the connection details of the db/cloud storages.
This option is available for all the components to validate the connection before deploying the components to avoid connection-related errors. This will also work with environment variables.
Check out a sample illustration of connection validation.
A Sandbox reader is used to read and access data within a configured sandbox environment.
All component configurations are classified broadly into the following sections:
Meta Information
Before using the Sandbox Reader component for reading a file, the user needs to upload a file in Data Sandbox under the Data Center module.
Please go through the given walk-through for uploading the file in the Data Sandbox under the Data Center module.
Check out the given video on how to configure a Sandbox Reader component.
Navigate to the Data Pipeline Editor.
Expand the Readers section provided under the Component Pallet.
Drag and drop the Sandbox Reader component to the Workflow Editor.
Click on the dragged Sandbox Reader to get the component properties tabs.
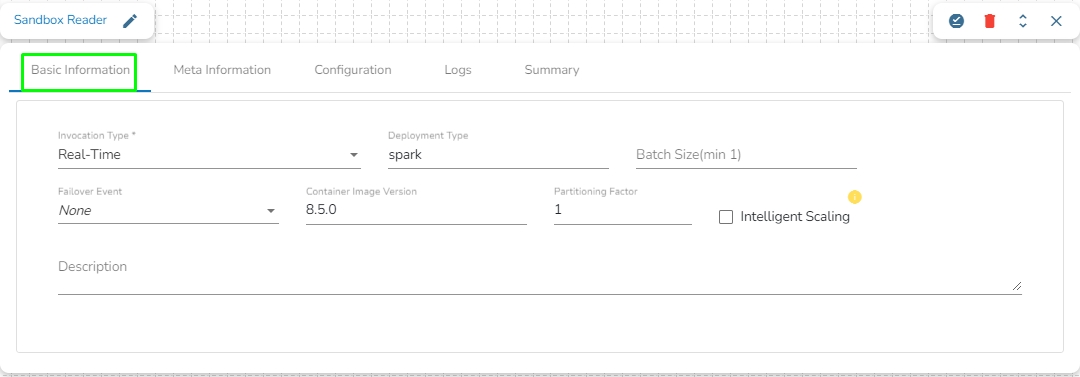
It is the default tab to open for the component while configuring it.
Invocation Type: Select an invocation mode from the Real-Time or Batch options by using the drop-down menu.
Deployment Type: It displays the deployment type for the reader component. This field comes pre-selected.
Container Image Version: It displays the image version for the docker container. This field comes pre-selected.
Failover Event: Select a failover Event from the drop-down menu.
Batch Size (min 10): Provide the maximum number of records to be processed in one execution cycle (Minimum limit for this field is 10).
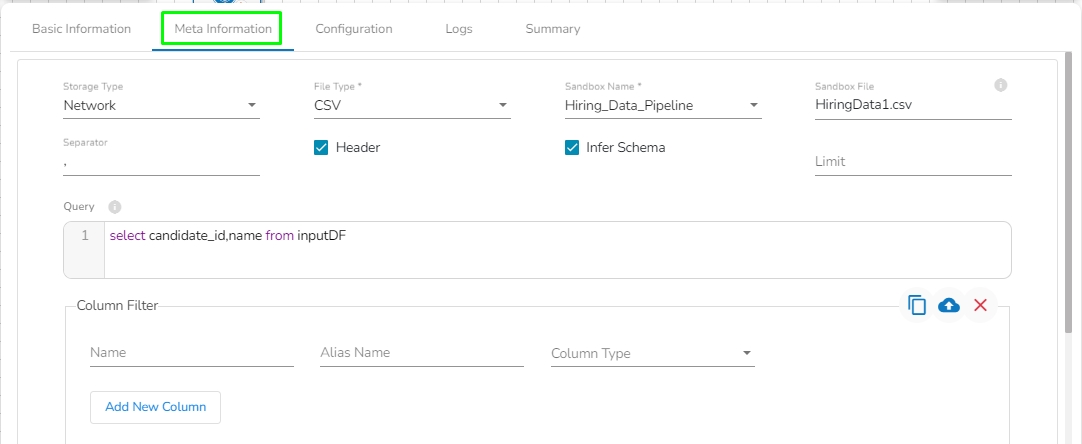
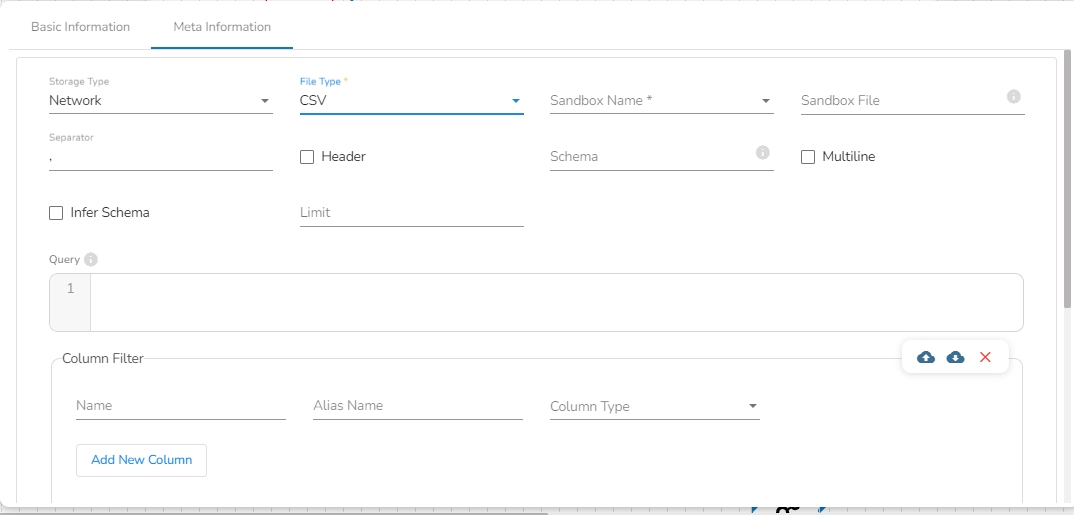
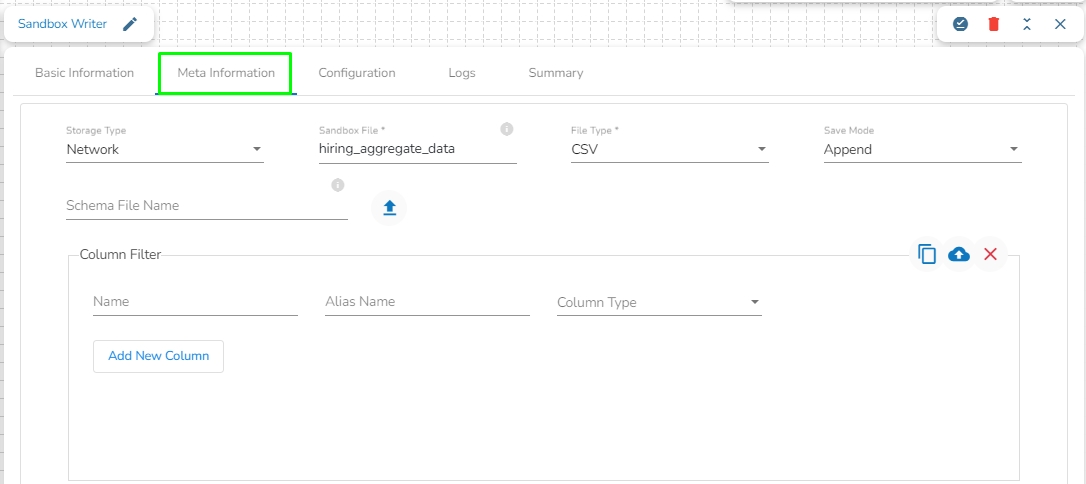
Storage Type: The user will find two options here:
Network: This option will be selected by default. In this option, the following fields will be displayed:
File Type: Select the type of the file to be read. Supported file types include CSV, JSON, PARQUET, AVRO, XML, and ORC.
Schema: Enter the Spark schema of the file in JSON format.
Sandbox Folder Path: Enter the Sandbox folder name where the data is stored in part files.
Limit: Enter the number of records to be read.
Platform: In this option, the following fields will be displayed:
File Type: Select the type of the file to be read. The supported file types are CSV, JSON, PARQUET, AVRO, XML, and ORC.
Sandbox Name: This field will display once the user selects the file type. It will show all the Sandbox names for the selected file type, and the user has to select the Sandbox name from the drop-down.
Sandbox File: This field displays the name of the sandbox file to be read. It will automatically fill when the user selects the sandbox name.
Limit: Enter the number of records to be read.
Query: Enter a spark SQL query. Take inputDf as a table name.
Column Filter: There is also a section for the selected columns in the Meta Information tab if the user can select some specific columns from the table to read data instead of selecting a complete table so this can be achieved by using the Column Filter section. Select the columns that you want to read and if you want to change the name of the column, then put that name in the alias name section otherwise keep the alias name the same as of column name and then select a Column Type from the drop-down menu.
Use the Download Data and Upload File options to select the desired columns.
Upload File: The user can upload the existing system files (CSV, JSON) using the Upload File icon (file size must be less than 2 MB).
Download Data (Schema): Users can download the schema structure in JSON format by using the Download Data icon.
or
Use the Download Data and Upload File options to select the desired columns.
Partition Columns: To read a specific partition, enter the name of the partitioned column.
Sample Query for Sandbox Reader:
Please Note:
(*) the symbol indicates that the field is mandatory.
Either table or query must be specified for the data readers except for SFTP Reader.
Column Filter- There should not be a data type mismatch in the Column Type for all the Reader components.
Fields in the Meta Information tab may vary based on the selected File Type. All the possibilities are mentioned below:
CSV: The following fields will display when CSV is selected as File Type:
Header: Enable the Header option to retrieve the header of the reading file.
Infer Schema: Enable the Infer Schema option to obtain the true schema of the columns in the CSV file.
Multiline: Enable the Multiline option to read multiline strings in the data.
Schema: This field will be visible only when the Header option is enabled. Enter the Spark schema in JSON format in the schema field to filter out the bad records. To filter the bad records, the user needs to map the failover Kafka event in the Failover Event field in the Basic Information tab.
JSON: The Multiline and Charset fields are displayed with JSON as the selected File Type. Check in the Multiline option to see, if there is any multiline string in the file.
PARQUET: No extra field gets displayed with PARQUET as the selected File Type.
AVRO: This File Type provides two drop-down menus.
Compression: Select an option out of the Deflate and Snappy options.
Compression Level: This field appears for the Deflate compression option. It provides 0 to 9 levels via a drop-down menu.
XML: Select this option to read the XML file. If this option is selected, the following fields will be displayed:
Infer schema: Enable this option to get the true schema of the column.
Path: Provide the path of the file.
Root Tag: Provide the root tag from the XML files.
Row Tags: Provide the row tags from the XML files.
Join Row Tags: Enable this option to join multiple row tags.
ORC: Select this option to read the ORC file. If this option is selected, the following fields will be displayed:
Push Down: In ORC (Optimized Row Columnar) file format, "push down" typically refers to the ability to push down predicate filters to the storage layer for processing. There will be two options in it:
True: When push-down is set to True, it indicates predicate filters can be pushed down to the ORC storage layer for filtering rows at the storage level. This can improve query performance by reducing the amount of data that needs to be read into memory for processing.
False: When push down is set to False, predicate filters are not pushed down to the ORC storage layer. Instead, filtering is performed after the data has been read into memory by the processing engine. This may result in more data being read and potentially slower query performance compared to when push-down is enabled.
The DB writer is a spark-based writer component which gives you capability to write data to multiple database sources.
All component configurations are classified broadly into the following sections:
Meta Information
Please check out the given demonstration to configure the component.
Please Note:
The ClickHouse driver in the Spark components will use the HTTP Port and not the TCP port.
It is always recommended to create the table before activating the pipeline to avoid errors as RDBMS has a strict schema and can result in errors.
When using the Redshift driver with a Boolean datatype in JDBC, the table is not created unless you pass the create table query. Alternatively, you can use a column filter to convert a Boolean value to a String for the desired operation.
Database name: Enter the Database name.
Table name: Provide a table name where the data has to be written.
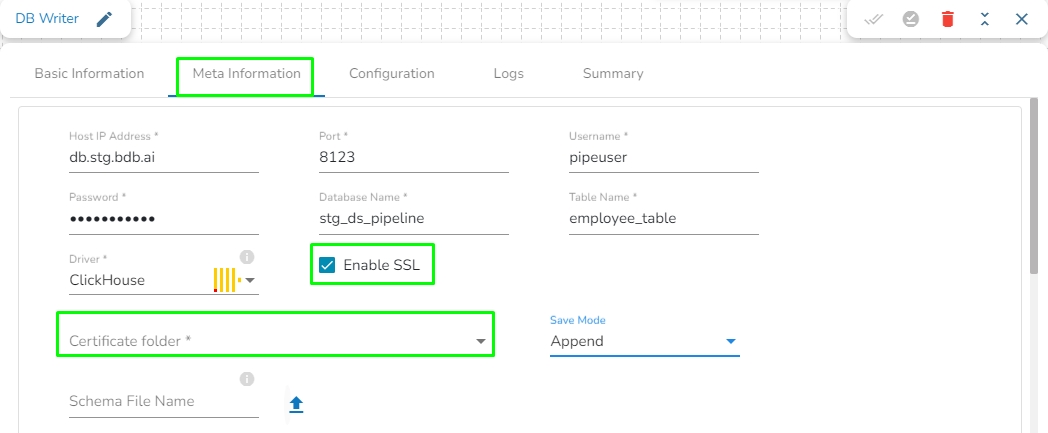
Enable SSL: Check this box to enable SSL for this components. Enable SSL feature in DB reader component will appear only for three(3) drivers: MongoDB, PostgreSQL and ClickHouse.
Certificate Folder: This option will appear when the Enable SSL field is checked-in. The user has to select the certificate folder from drop down which contains the files which has been uploaded to the admin settings. Please refer the below given images for the reference.
Schema File Name: Upload a Spark schema file of the data which has to be written in JSON format.
Save Mode: Select the save mode from the drop-down menu:
Append: It will append the data in the table.
Overwrite: It will overwrite the data in the table.
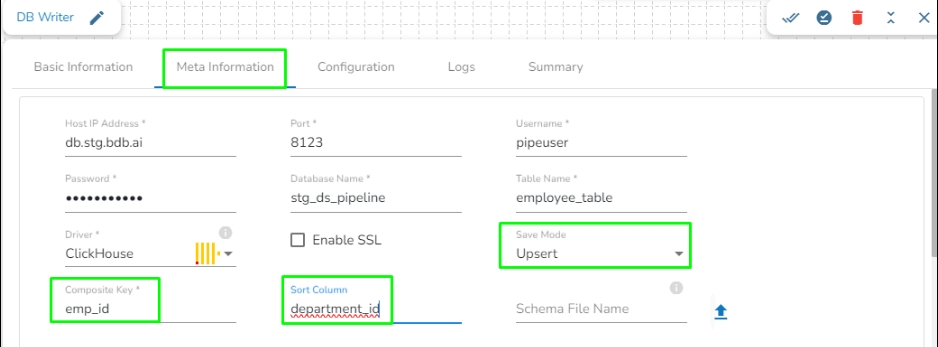
Upsert: This operation allows the users to insert a new record or update existing data into a table. For configuring this, we need to provide the Composite Key.
Sort Column: This field will appear only when Upsert is selected as Save mode. If there are multiple records with the same composite key but different values in the batch, the system identifies the record with the latest value based on the Sort column. The Sort column defines the ordering of records, and the record with the highest value in the sort column is considered the latest.
Column Filter: Enter the column names here. Only the specified columns will be fetched from the data from the previous connected event to the DB Writer. In this field, the user needs to fill in the following information:
Name: Enter the name of the column which has to be written from the previous event. The user can add multiple columns by clicking on the "Add New Column" option.
Alias: Enter the alias name for the selected column name.
Column Type: Enter the data type of the column.
Upload: This option allows the user to upload a data file in CSV, JSON, or EXCEL format. The column names will be automatically fetched from the uploaded data file and filled out in the Name, Alias, and Column Type fields.
Download Data: This option will download the data filled in the Column Filter field in JSON format.
Delete Data: This option will clear all the information filled in the Column Filter field.
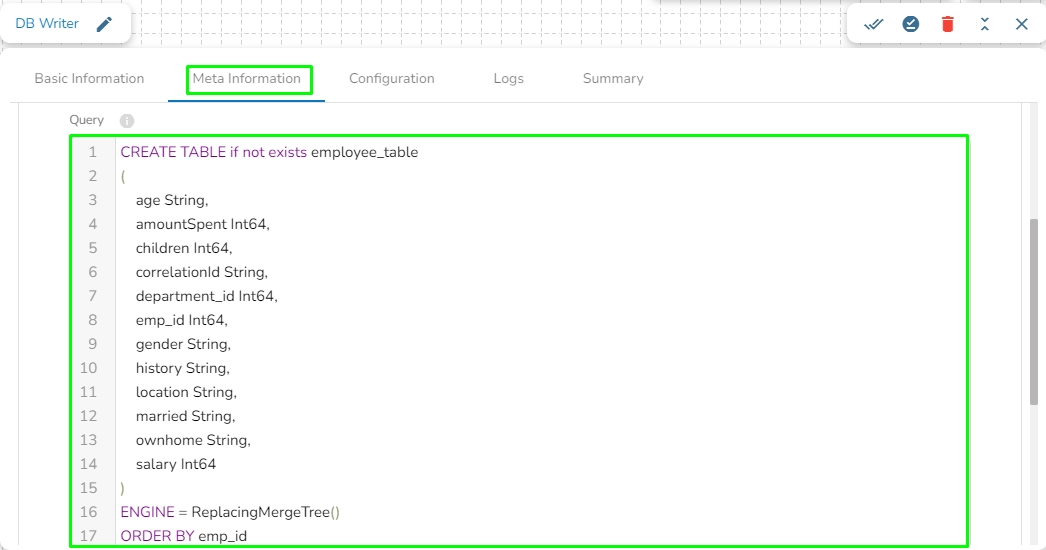
Query: In this field, we can write a DDL for creating the table in database where the in-event data has to be written. For example, please refer the below image:
Please Note:
In DB Writer component, the Save Mode for ClickHouse driver is as follows:
Append: It will create a table in ClickHouse database with a table engine StripeLog.
Upsert: It will create a table in ClickHouse database with a table engine ReplacingMergeTree.
If the user is using Append as the Save mode in ClickHouse Writer (Docker component) and Data Sync (ClickHouse driver), it will create a table in the ClickHouse database with a table engine Memory.
Currently, the Sort column field is only available for the following drivers in the DB Writer: MSSQL, PostgreSQL, Oracle, Snowflake, and ClickHouse.
An S3 Writer is designed to write data to an S3 bucket in AWS. S3 Writer typically authenticate with S3 using AWS credentials, such as an access key ID and secret access key, to gain access to the S3 bucket and its contents.
All component configurations are classified broadly into the following sections:
Meta Information
Check out the steps given in the demonstration to configure the S3 Writer component.
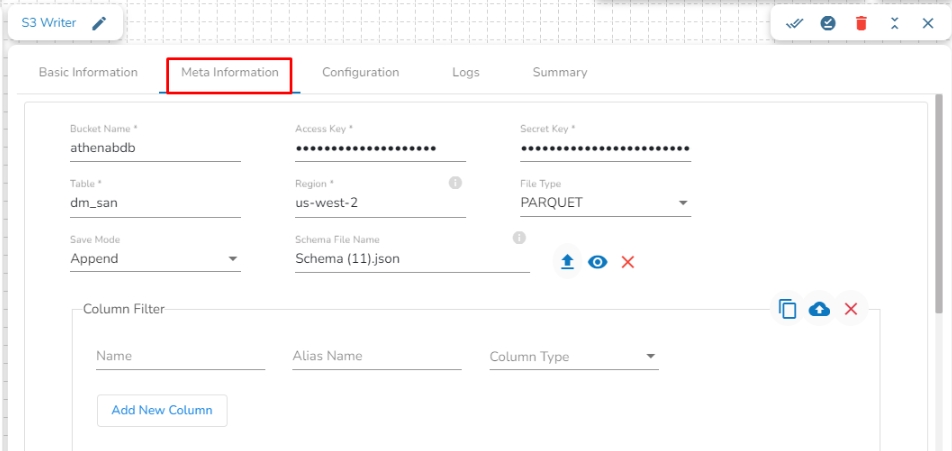
Bucket Name: Enter the S3 Bucket name.
Access Key: Access key shared by AWS to login.
Secret Key: Secret key shared by AWS to login.
Table: Mention the Table or object name where the data has to be written in the S3 location.
Region: Provide the S3 region where the Bucket is created.
File Type: Select a file type from the drop-down menu (CSV, JSON, PARQUET, AVRO, ORC are the supported file types).
Save Mode: Select the save mode from the drop-down menu:
Append: It will append the data in the blob.
Overwrite: It will overwrite the data in the blob.
Schema File Name: Upload a Spark schema file of the data which has to be written in JSON format.
Column Filter: Enter the column names here. Only the specified columns will be fetched from the data from the previous connected event to the S3 Writer. In this field, the user needs to fill in the following information:
Name: Enter the name of the column which has to be written from the previous event. The user can add multiple columns by clicking on the "Add New Column" option.
Alias: Enter the alias name for the selected column name.
Column Type: Enter the data type of the column.
Upload: This option allows the user to upload a data file in CSV, JSON, or EXCEL format. The column names will be automatically fetched from the uploaded data file and filled out in the Name, Alias, and Column Type fields.
Download Data: This option will download the data filled in the Column Filter field in JSON format.
Delete Data: This option will clear all the information filled in the Column Filter field.
Partition Columns: This feature enables users to partition the data when writing to Azure Blob. Users can specify multiple columns for partitioning by clicking the "Add Column Name" option. For example, If data is partitioned by a date column, a separate folder will be created for each unique date in an Amazon S3 bucket. The data storage might look like this:
ClickHouse reader is designed to read and access data stored in a ClickHouse database. ClickHouse readers typically authenticate with ClickHouse using a username and password or other authentication mechanisms supported by ClickHouse.
Along with the Spark Driver in RDBMS reader we have Docker Reader that supports TCP port All component configurations are classified broadly into the following sections:
All component configurations are classified broadly into the following sections:
Meta Information
Check out the given illustration to understand the configuration steps for the ClickHouse Reader component.
Host IP Address: Enter the Host IP Address.
Port: Enter the port for the given IP Address.
User name: Enter the user name for the provided database.
Password: Enter the password for the provided database.
Database name: Enter the Database name.
Table name: Provide a single or multiple table names. If multiple table name has be given, then enter the table names separated by comma(,). Settings: Option that allows you to customize various configuration settings for a specific query.
Enable SSL: Enabling SSL with ClickHouse Reader involves configuring the reader to use the Secure Sockets Layer (SSL) protocol for secure communication between the reader and the ClickHouse server.
Query: Write SQL query to filter out desired data from ClickHouse Database.
Please Note:
The Meta Information tab has got an SSL field for the ClickHouse Reader component. The user needs to configure the SSL.
ClickHouse reader docker component supports only TCP port.
Amazon Athena is an interactive query service that makes it easy to analyze data directly in Amazon Simple Storage Service (Amazon S3) using standard SQL. With a few actions in the AWS Management Console, you can point Athena at your data stored in Amazon S3 and begin using standard SQL to run ad-hoc queries and get results in seconds.
Athena Query Executer component enables users to read data directly from the external table created in AWS Athena.
Please Note: Please go through the below given demonstration to configure Athena Query component in the pipeline.
Region: Enter the region name where the bucket is located.
Access Key: Enter the AWS Access Key of the AWS account which has to be used.
Secret Key: Enter the AWS Secret Key of the AWS account which has to be used.
Table Name: Enter the name of the external table created in Athena.
Database Name: Name of the database in Athena in which the table has been created.
Limit: Enter the number of records to be read from the table.
Data Source: Enter the Data Source name configured in Athena. Data Source in Athena refers to the location where your data resides, typically an S3 bucket.
Workgroup: Enter the Workgroup name configured in Athena. The Workgroup in Athena is a resource type used to separate query execution and query history between Users, Teams, or Applications running under the same AWS account.
Query location: Enter the path where the results of queries done in the Athena query editor are saved in CSV format. You can find this path under the "Settings" tab in the Athena query editor in the AWS console, labeled as "Query Result Location".
Query: Enter the Spark SQL query.
Sample Spark SQL query that can be used in Athena Query Executer:
Azure Blob Reader is designed to read and access data stored in Azure Blob Storage. Azure Blob Readers typically authenticate with Azure Blob Storage using Azure Active Directory credentials or other authentication mechanisms supported by Azure.
This is a docker based component.
All component configurations are classified broadly into the following sections:
Meta Information
Please Note: Please go through the below given demonstration to configure Azure Blob Reader in the pipeline.
Please Note: Before starting to use the Azure Reader component, please follow the steps below to obtain the Azure credentials from the Azure Portal:
Accessing Azure Blob Storage: Shared Access Signature (SAS), Secret Key, and Principal Secret
This document outlines three methods for accessing Azure Blob Storage: Shared Access Signatures (SAS), Secret Keys, and Principal Secrets.
Understanding Security Levels:
Shared Access Signature (SAS): This is the recommended approach due to its temporary nature and fine-grained control over access permissions. SAS tokens can be revoked, limiting potential damage if compromised.
Secret Key: Secret keys grant full control over your storage account. Use them with caution and only for programmatic access. Consider storing them securely in Azure Key Vault and avoid hardcoding them in scripts.
Principal Secret: This applies to Azure Active Directory (Azure AD) application access. Similar to secret keys, use them cautiously and store them securely (e.g., Azure Key Vault).
1. Shared Access Signature (SAS):
Benefits:
Secure: Temporary and revocable, minimizing risks.
Granular Control: Define specific permissions (read, write, list, etc.) for each SAS token.
Steps to Generate an SAS Token:
Access Blob Storage Account: Locate "Storage accounts" in the left menu and select your storage account.
Configure SAS Settings: Find and click on "Shared access signature" in the settings. Define the permissions, expiry date, and other parameters for your needs.
Generate SAS Token: Click on "Generate SAS and connection string" to create the SAS token.
Copy and Use SAS Token: Copy the generated SAS token. Use this token to securely access your Blob Storage resources in your code.
2. Secret Key:
Use with Caution:
High-Risk: Grants full control over your storage account.
Secure Storage: Store them securely in Azure Key Vault, never hardcode them in scripts.
Steps to Obtain Secret Key:
Navigate to Azure Portal: Open the Azure portal and log in.
Access Blob Storage Account: Locate and select your storage account.
View Secret Keys: Click on "Access keys" to view your storage account keys. Do not store these directly in code. Consider Azure Key Vault for secure storage.
3. Principal Secret (Azure AD Application):
Use for Application Access:
Grants access to your storage account through an Azure AD application.
Secure Storage: Store them securely in Azure Key Vault, never hardcode them in scripts.
Steps to Obtain Principal Secret:
Access App Registrations: Locate "App registrations" in the left menu.
Select Your Application: Find and click on the application for which you want to obtain the principal secret.
Access Certificates & Secrets: Inside your application, go to "Certificates & secrets" in the settings menu.
Generate New Client Secret (Principal Secret):
Under "Client secrets," click on "New client secret."
Enter a description, select the expiry duration, and click "Add" to generate the new client secret.
Copy the generated client secret immediately as it will be hidden afterward.
Read Using: There are three authentication methods available to connect with Azure in the Azure Blob Reader Component:
Shared Access Signature
Secret Key
Principal Secret
Provide the following details:
Shared Access Signature: This is a URI that grants restricted access rights to Azure Storage resources.
Account Name: Provide the Azure account name.
Container: Provide the container name from where the file is located and which has to be read.
File Type: There are five (5) types of file extensions available:
CSV
JSON
PARQUET
AVRO
XML
Read Directory: This field will be checked by default. If this option is enabled, the component will read data from all the blobs present in the container.
Blob Name: This field will display only if the Read Directory field is disabled. Enter the specific name of the blob whose data has to be read.
Column Filter: Enter the column names here. Only the specified columns will be fetched from Azure Blob. In this field, the user needs to fill in the following information:
Source Field: Enter the name of the column from the blob. The user can add multiple columns by clicking on the "Add New Column" option.
Destination Field: Enter the alias name for the source field.
Column Type: Enter the data type of the column.
Upload: This option allows the user to upload a data file in CSV, JSON, or EXCEL format. The column names will be automatically fetched from the uploaded data file and filled out in the Name, Alias, and Column Type fields.
Download Data: This option will download the data filled in the Column Filter field in JSON format.
Delete Data: This option will clear all the information filled in the Column Filter field.
Provide the following details:
Account Key: Used to authorize access to data in your storage account via Shared Key authorization.
Account Name: Provide the Azure account name.
Container: Provide the container name from where the file is located and which has to be read.
File Type: There are five (5) types of file extensions available:
CSV
JSON
PARQUET
AVRO
Read Directory: This field will be checked by default. If this option is enabled, the component will read data from all the blobs present in the container.
Blob Name: This field will display only if the Read Directory field is disabled. Enter the specific name of the blob whose data has to be read.
Column Filter: Enter the column names here. Only the specified columns will be fetched from Azure Blob. In this field, the user needs to fill in the following information:
Source Field: Enter the name of the column from the blob. The user can add multiple columns by clicking on the "Add New Column" option.
Destination Field: Enter the alias name for the source field.
Column Type: Enter the data type of the column.
Upload: This option allows the user to upload a data file in CSV, JSON, or EXCEL format. The column names will be automatically fetched from the uploaded data file and filled out in the Name, Alias, and Column Type fields.
Download Data: This option will download the data filled in the Column Filter field in JSON format.
Delete Data: This option will clear all the information filled in the Column Filter field.
Provide the following details:
Client ID: The unique Application (client) ID assigned to your app by Azure AD when the app was registered.
Tenant ID: A globally unique identifier (GUID) that is different from your organization name or domain.
Client Secret: The password of the service principal.
Account Name: Provide the Azure account name.
File Type: There are five (5) types of file extensions available:
CSV
JSON
PARQUET
AVRO
Read Directory: This field will be checked by default. If this option is enabled, the component will read data from all the blobs present in the container.
Blob Name: This field will display only if the Read Directory field is disabled. Enter the specific name of the blob whose data has to be read.
Column Filter: Enter the column names here. Only the specified columns will be fetched from Azure Blob. In this field, the user needs to fill in the following information:
Source Field: Enter the name of the column from the blob. The user can add multiple columns by clicking on the "Add New Column" option.
Destination Field: Enter the alias name for the source field.
Column Type: Enter the data type of the column.
Upload: This option allows the user to upload a data file in CSV, JSON, or EXCEL format. The column names will be automatically fetched from the uploaded data file and filled out in the Name, Alias, and Column Type fields.
Download Data: This option will download the data filled in the Column Filter field in JSON format.
Delete Data: This option will clear all the information filled in the Column Filter field.
Note: The following fields will be displayed after selecting the following file types:
CSV: The Header and Infer Schema fields get displayed with CSV as the selected File Type. Enable Header option to get the Header of the reading file and enable Infer Schema option to get true schema of the column in the CSV file.
JSON: The Multiline and Charset fields get displayed with JSON as the selected File Type.
Multiline: This option handles JSON files that contain records spanning multiple lines. Enabling this ensures the JSON parser reads multiline records correctly.
Charset: Specify the character set used in the JSON file. This defines the character encoding of the JSON file, such as UTF-8 or ISO-8859-1, ensuring correct interpretation of the file content.
PARQUET: No extra field gets displayed with PARQUET as the selected File Type.
AVRO: This File Type provides two drop-down menus.
Compression: Select an option out of the Deflate and Snappy options.
Deflate: A compression algorithm that balances between compression speed and compression ratio, often resulting in smaller file sizes.
Snappy: This compression type is select by default. A fast compression and decompression algorithm developed by Google, optimized for speed rather than maximum compression ratio.
Compression Level: This field appears if Deflate compression is selected. It provides a drop-down menu with levels ranging from 0 to 9, indicating the compression intensity.
Upload JSON(*): Upload credential file downloaded from Google Big Query using the Upload icon. You may need to download a JSON from Big Query to upload it here.
Click the Save Component in Storage icon after doing all the configurations to save the reader component.
Navigate to Azure Portal: Open the Azure portal () and log in with your credentials.
Navigate to Azure AD Portal: Open the Azure AD portal () and log in with your credentials.
We have given two different writers for writing data to MongoDB. The available deployment types for the same are: Spark and Docker.
These are the real-time / Streaming component that ingests data or monitor for change in data objects from different sources to the pipeline.
These components utilize machine learning algorithms and techniques to analyze and model the data.
An Elasticsearch writer component is designed to write the data stored in an Elasticsearch index. Elasticsearch writers typically authenticate with Elasticsearch using username and password credentials, which grant access to the Elasticsearch cluster and its indexes.
All component configurations are classified broadly into the following sections:
Meta Information
Follow the given steps in the demonstration to configure the ES Writer component.
Please follow the below mentioned steps to configure the meta information of ES writer:
Host IP Address: Enter the host IP Address for Elastic Search.
Port: Enter the port to connect with Elastic Search.
Index ID: Enter the Index ID to read a document in elastic search. In Elasticsearch, an index is a collection of documents that share similar characteristics, and each document within an index has a unique identifier known as the index ID. The index ID is a unique string that is automatically generated by Elasticsearch and is used to identify and retrieve a specific document from the index.
Mapping ID: Provide the Mapping ID. In Elasticsearch, a mapping ID is a unique identifier for a mapping definition that defines the schema of the documents in an index. It is used to differentiate between different types of data within an index and to control how Elasticsearch indexes and searches data.
Resource Type: Provide the resource type. In Elasticsearch, a resource type is a way to group related documents together within an index. Resource types are defined at the time of index creation, and they provide a way to logically separate different types of documents that may be stored within the same index.
Username: Enter the username for elastic search.
Password: Enter the password for elastic search.
Schema File Name: Upload spark schema file in JSON format.
Save Mode: Select the Save mode from the drop down.
Append
Selected columns: The user can select the specific column, provide some alias name and select the desired data type of that column.
HDFS stands for Hadoop Distributed File System. It is a distributed file system designed to store and manage large data sets in a reliable, fault-tolerant, and scalable way. HDFS is a core component of the Apache Hadoop ecosystem and is used by many big data applications.
This component writes the data in HDFS(Hadoop Distributed File System).
All component configurations are classified broadly into 3 sections
Meta Information
Follow the given steps in the demonstration to configure the HDFS Writer component.
Host IP Address: Enter the host IP address for HDFS.
Port: Enter the Port.
Table: Enter the table name where the data has to be written.
Zone: Enter the Zone for HDFS in which the data has to be written. Zone is a special directory whose contents will be transparently encrypted upon write and transparently decrypted upon read.
File Format: Select a file format in which the data has to be written.
CSV
JSON
PARQUET
AVRO
ORC
Save Mode: Select a Save Mode.
Schema file name: Upload Spark schema file in JSON format.
Partition Columns: Provide a unique Key column name to partition data in Spark.
A Sandbox writer is used to write the data within a configured sandbox environment.
All component configurations are classified broadly into the following sections:
Meta Information
Check out the given Walk-through on the Sandbox Writer component.
Please follow the below mentioned steps to configure the Meta Information Tab of Sandbox Writer:
Storage Type: The user will find two options here:
Network: This option will be selected by default. In this mode, a folder corresponding to the Sandbox file name provided by the user will be created at the Sandbox location. Data will be written into part files within this folder, with each part file containing data based on the specified batch size.
Platform: If the user selects the "Platform" option, a single file containing the entire dataset will be created at the Sandbox location, using the Sandbox file name provided by the user.
Sandbox File: Enter the file name.
File Type: Select the file type in which the data has to be written. There are 4 files types supported here:
CSV
JSON
Text
ORC
Save Mode: Select the save mode from the drop-down menu:
Append: It will append the data in the blob.
Overwrite: It will overwrite the data in the blob.
Schema File Name: Upload a Spark schema file of the data which has to be written in JSON format.
Column Filter: Enter the column names here. Only the specified columns will be fetched from the data from the previous connected event to the Sandbox Writer. In this field, the user needs to fill in the following information:
Name: Enter the name of the column which has to be written from the previous event. The user can add multiple columns by clicking on the "Add New Column" option.
Alias: Enter the alias name for the selected column name. The column name given here will be written in the Sandbox file.
Column Type: Enter the data type of the column.
Upload: This option allows the user to upload a data file in CSV, JSON, or EXCEL format. The column names will be automatically fetched from the uploaded data file and filled out in the Name, Alias, and Column Type fields.
Download Data: This option will download the data filled in the Column Filter field in JSON format.
Delete Data: This option will clear all the information filled in the Column Filter field.
Along with the Spark Driver in RDBMS Writer we have Docker writer that supports TCP port.
ClickHouse writer component is designed to write or store data in a ClickHouse database. ClickHouse writers typically authenticate with ClickHouse using a username and password or other authentication mechanisms supported by ClickHouse.
All component configurations are classified broadly into the following sections:
Meta Information
Please go through the given walk-through to understand the configuration steps for the ClickHouse Writer pipeline component.
Host IP Address: Enter the Host IP Address.
Port: Enter the port for the given IP Address.
User name: Enter the user name for the provided database.
Password: Enter the password for the provided database.
Database name: Enter the Database name.
Table name: Provide a single or multiple table names. If multiple table name has be given, then enter the table names separated by comma(,). Settings: Option that allows you to customize various configuration settings for a specific query.
Enable SSL: Enabling SSL with ClickHouse writer involves configuring the writer to use the Secure Sockets Layer (SSL) protocol for secure communication between the writer and the ClickHouse server.
Save Mode: Select the Save mode from the drop down.
Column Filter: There is also a section for the selected columns in the Meta Information tab if the user can select some specific columns from the table to read data instead of selecting a complete table so this can be achieved by using the Column Filter section. Select the columns which you want to read and if you want to change the name of the column, then put that name in the alias name section otherwise keep the alias name the same as of column name and then select a Column Type from the drop-down menu.
Use Download Data and Upload File options to select the desired columns.
Upload File: The user can upload the existing system files (CSV, JSON) using the Upload File icon (file size must be less than 2 MB).
Download Data: Users can download the schema structure in JSON format by using the Download Data icon.
Please Note:
ClickHouse Writer component supports only TCP port.
If the user is using Append as the Save mode in ClickHouse Writer (Docker component) and Data Sync (ClickHouse driver), it will create a table in the ClickHouse database with a table engine Memory.
Azure Writer component is designed to write or store data in Microsoft Azure's storage services, such as Azure Blob Storage. Azure Writers typically authenticate with Azure using Azure Active Directory credentials or other authentication mechanisms supported by Azure.
All component configurations are classified broadly into the following sections:
Meta Information
Please go through the demonstration to configure Azure Writer in the pipeline.
Please Note: Before starting to use the Azure Reader component, please follow the steps below to obtain the Azure credentials from the Azure Portal:
Accessing Azure Blob Storage: Shared Access Signature (SAS), Secret Key, and Principal Secret
This document outlines three methods for accessing Azure Blob Storage: Shared Access Signatures (SAS), Secret Keys, and Principal Secrets.
Understanding Security Levels:
Shared Access Signature (SAS): This approach is recommended due to its temporary nature and fine-grained control over access permissions. SAS tokens can be revoked, limiting potential damage if compromised.
Secret Key: Secret keys grant full control over your storage account. Use them with caution and only for programmatic access. Consider storing them securely in Azure Key Vault and avoid hardcoding them in scripts.
Principal Secret: This applies to Azure Active Directory (Azure AD) application access. Similar to secret keys, use them cautiously and store them securely (e.g., Azure Key Vault).
1. Shared Access Signature (SAS):
Benefits:
Secure: Temporary and revocable, minimizing risks.
Granular Control: Define specific permissions (read, write, list, etc.) for each SAS token.
Steps to Generate an SAS Token:
Navigate to Azure Portal: Open the Azure portal (https://azure.microsoft.com/en-us/get-started/azure-portal) and log in with your credentials.
Access Blob Storage Account: Locate Storage accounts from the left menu and select your storage account.
Configure SAS Settings: Find and click on "Shared access signature" in the settings. Define the permissions, expiry date, and other parameters for your needs.
Generate SAS Token: Click on "Generate SAS and connection string" to create the SAS token.
Copy and Use SAS Token: Copy the generated SAS token. Use this token to access your Blob Storage resources in your code securely.
2. Secret Key:
Use with Caution:
High-Risk: Grants full control over your storage account.
Secure Storage: Store them securely in Azure Key Vault, never hardcode them in scripts.
Steps to Obtain Secret Key:
Navigate to Azure Portal: Open the Azure portal and log in.
Access Blob Storage Account: Locate and select your storage account.
View Secret Keys: Click the Access keys to view your storage account keys. Do not store these directly in code. Consider Azure Key Vault for secure storage.
3. Principal Secret (Azure AD Application):
Use for Application Access:
Grants access to your storage account through an Azure AD application.
Secure Storage: Store them securely in Azure Key Vault, never hardcode them in scripts.
Steps to Obtain Principal Secret:
Navigate to Azure AD Portal: Open the Azure AD portal (https://azure.microsoft.com/en-us/get-started/azure-portal) and log in with your credentials.
Access App Registrations: Locate "App registrations" in the left menu.
Select Your Application: Find and click on the application you want to obtain the principal secret.
Access Certificates & Secrets: Go to Certificates & secrets in the Settings menu inside your application.
Generate New Client Secret (Principal Secret):
Click on the New client secret option under the Client secrets section.
Enter a description, select the expiry duration, and click the Add option to generate the new client secret.
Copy the generated client secret immediately as it will be hidden afterward.
Write Using: There are three authentication methods available to connect with Azure in the Azure Writer Component:
Shared Access Signature
Secret Key
Principal Secret
Provide the following details:
Shared Access Signature: This is a URI that grants restricted access rights to Azure Storage resources.
Account Name: Provide the Azure account name.
Container: Provide the container name from where the blob is located. A container is a logical unit of storage in Azure Blob Storage that can hold blobs. It is similar to a directory or folder in a file system, and it can be used to organize and manage blobs.
Blob Name: Enter the blob name. A blob is a type of object storage used to store unstructured data, such as text or binary data, like images or videos.
File Format: Four (4) types of file types are available. Select the file format in which the data has to be written:
CSV
JSON
PARQUET
AVRO
Save Mode: Select the save mode from the drop-down menu:
Append: It will append the data in the blob.
Overwrite: It will overwrite the data in the blob.
Schema File Name: Upload a Spark schema file of the data that has to be written in JSON format.
Column Filter: Enter the column names here. Only the specified columns will be fetched from the data from the previous connected event to the Azure Writer. In this field, the user needs to fill in the following information:
Name: Enter the name of the column that has to be written from the previous event. The user can add multiple columns by clicking on the "Add New Column" option.
Alias: Enter the alias name for the selected column name.
Column Type: Enter the data type of the column.
Upload: This option allows the user to upload a data file in CSV, JSON, or EXCEL format. The column names will be automatically fetched from the uploaded data file and filled out in the Name, Alias, and Column Type fields.
Download Data: This option will download the data filled in the Column Filter field in the JSON format.
Delete Data: This option will clear all the information filled in the Column Filter field.
Partition Column: This feature enables users to partition the data when writing to Azure Blob. Users can specify multiple columns for partitioning by clicking the "Add Column Name" option.
Provide the following details:
Account Key: Enter the Azure account key. In Azure, an account key is a security credential that is used to authenticate access to storage resources, such as blobs, files, queues, or tables, in an Azure storage account.
Account Name: Provide the Azure account name.
Container: Provide the container name from where the blob is located. A container is a logical unit of storage in Azure Blob Storage that can hold blobs. It is similar to a directory or folder in a file system, and it can be used to organize and manage blobs.
Blob Name: Enter the Blob name. A blob is a type of object storage that is used to store unstructured data, such as text or binary data, like images or videos.
File Format: There are four (4) types of file extensions available:
CSV
JSON
PARQUET
AVRO
Save Mode: Select the save mode from the drop-down menu:
Append: It will append the data in the blob.
Overwrite: It will overwrite the data in the blob.
Schema File Name: Upload a Spark schema file of the data which has to be written in JSON format.
Column Filter: Enter the column names here. Only the specified columns will be fetched from the data from the previous connected event to the Azure Writer. In this field, the user needs to fill in the following information:
Name: Enter the name of the column which has to be written from the previous event. The user can add multiple columns by clicking on the "Add New Column" option.
Alias: Enter the alias name for the selected column name. The column name given here will be written in the container.
Column Type: Enter the data type of the column.
Upload: This option allows users to upload a data file in CSV, JSON, or EXCEL format. The column names will be automatically fetched from the uploaded data file and filled out in the Name, Alias, and Column Type fields.
Download Data: This option will download the data filled in the Column Filter field in the JSON format.
Delete Data: This option will clear all the information filled in the Column Filter field.
Partition Column: This feature enables users to partition the data when writing to Azure Blob. Users can specify multiple columns for partitioning by clicking the "Add Column Name" option.
Provide the following details:
Client ID: Provide Azure Client ID. The client ID is the unique Application (client) ID assigned to your app by Azure AD when the app was registered.
Tenant ID: Provide the Azure Tenant ID. Tenant ID (also known as Directory ID) is a unique identifier that is assigned to an Azure AD tenant and represents an organization or a developer account. It is used to identify the organization or developer account that the application is associated with.
Client Secret: Enter the Azure Client Secret. Client Secret (also known as Application Secret or App Secret) is a secure password or key that is used to authenticate an application to Azure AD.
Account Name: Provide the Azure account name.
Container: Provide the container name from where the blob is located. A container is a logical unit of storage in Azure Blob Storage that can hold blobs. It is similar to a directory or folder in a file system, and it can be used to organize and manage blobs.
Blob Name: Enter the Blob name. A blob is a type of object storage that is used to store unstructured data, such as text or binary data, like images or videos.
File Format: There are four (4) types of file extensions available under it:
CSV
JSON
PARQUET
AVRO
Save Mode: Select the save mode from the drop-down menu:
Append: It will append the data in the blob.
Overwrite: It will overwrite the data in the blob.
Schema File Name: Upload a Spark schema file of the data which has to be written in JSON format.
Column Filter: Enter the column names here. Only the specified columns will be fetched from the data from the previous connected event to the Azure Writer. In this field, the user needs to fill in the following information:
Name: Enter the column name that must be written from the previous event. The user can add multiple columns by clicking the Add New Column option.
Alias: Enter the alias name for the selected column name. The column name given here will be written in the container.
Column Type: Enter the data type of the column.
Upload: This option allows the user to upload a data file in CSV, JSON, or EXCEL format. The column names will be automatically fetched from the uploaded data file and filled out in the Name, Alias, and Column Type fields.
Download Data: This option will download the data filled in the Column Filter field in JSON format.
Delete Data: This option will clear all the information filled in the Column Filter field.
Partition Column: This feature enables users to partition the data when writing to Azure Blob. Users can specify multiple columns for partitioning by clicking the "Add Column Name" option.
The video writer component is designed to write .mp4 format video to a SFTP location by combining the frames that can be consumed using the video consumer component.
All component configurations are classified broadly into the following sections:
Meta Information
Please follow the given demonstration to configure the Video Writer component.
Please Note:
The Pipeline testing suite and Data Metrices options in Monitoring pipeline page are not available for this component.
The video Writer component supports only .mp4 file format. Its writes video frame by frame to SFTP.
Drag & drop the Video Stream Consumer component to the Workflow Editor.
Click the dragged Video Stream Consumer component to open the component properties tabs.
It is the default tab to open for the component.
Invocation Type: Select an Invocation type from the drop-down menu to confirm the running mode of the reader component. Select ‘Real-Time’ or ‘Batch’ from the drop-down menu.
Deployment Type: It displays the deployment type for the component. This field comes pre-selected.
Batch Size (min 10): Provide the maximum number of records to be processed in one execution cycle (Min limit for this field is 10).
Failover Event: Select a failover Event from the drop-down menu.
Container Image Version: It displays the image version for the docker container. This field comes pre-selected.
Description: Description of the component. It is optional.
Please Note: If the selected Invocation Type option is Batch, then, Grace Period (in a sec)* field appears to provide the grace period for the component to go down gracefully after that time.
Selecting Real-time as the Invocation Type option will display the Intelligent Scaling option.
Select the Meta Information tab and provide the mandatory fields to configure the dragged Video Stream Consumer component.
Host IP Address (*)- Provide IP or URL
The input in Host IP Address in the Meta Information tab changes based on the selection of the Channel. There are two options available:
Live: This allows writing the data to the desired location when live data is coming continuously.
Media File: It will read only stored video file and writes them to desired SFTP location.
Username (*)- Provide username
Port (*)- Provide the Port number
Authentication- Select any one authentication option out of Password or PEM PPK File
Stream(*)- The supported streaming methods are Live and Media files.
Partition Time(*)- It defines the length of video the component will consume at once in seconds. This field will appear only if the LIVE option is selected in Stream field.
Writer Path (*)- Provide the desired path in SFTP location where the video has to be written.
File Name(*)- Give any filename with a format mp4(sample_filename.mp4).
Frame Rate – Provide the rate of frames to be consumed.
Please Note: The fields for the Meta Information tab change based on the selection of the Authentication option.
While using the authentication option as a Password it adds a password field in the Meta information.
While choosing the PEM/PPK File authentication option, the user needs to select a file using the Choose File option.
Click the Save Component in Storage icon for the Video Writer component.
The message appears to notify that the component properties are saved.
The Video Writer component gets configured to pass the data in the Pipeline Workflow.
The PyMongo writer component is designed to write the data in the Mongo collection. It is a docker based component.
All component configurations are classified broadly into the following sections:
Meta Information
Please follow the demonstration to configure the component.
The PyMongo Writer writes the data to the Mongo Database.
Drag & drop the PyMongo Writer component to the Pipeline Workflow Editor.
Click the dragged PyMongo Writer component to open the component properties tabs below.
It is the default tab to open for the PyMongo Writer while configuring the component.
Select an Invocation type from the drop-down menu to confirm the running mode of the reader component. Select ‘Real-Time’ or ‘Batch’ from the drop-down menu.
Deployment Type: It displays the deployment type for the component. This field comes preselected.
Container Image Version: It displays the image version for the docker container. This field comes pre-selected.
Failover Event: Select a failover Event from the drop-down menu.
Batch Size: Provide the maximum number of records to be processed in one execution cycle.
Open the Meta Information tab and configure all the connection-specific details for the PyMongo Writer.
Connection Type: Select either of the options out of ‘Standard’, ‘SRV’, and ‘Connection String’ connection types.
Port number(*): Provide the Port number (It appears only with the ‘Standard’ connection type).
Host IP Address(*): IP address of the host.
Username(*): Provide username.
Password(*): Provide a valid password to access the MongoDB.
Database Name(*): Provide the name of the database where you wish to write data.
Collection Name (*): Provide the name of the collection.
Save Mode: Select an option from the drop-down menu (the supported options are Upsert and Append).
Enable SSL: Check-in this box to enable SSL feature for PyMongo writer.
Please Note: Credentials will be different if this option is enabled.
Composite Keys (*): This field appears only when the selected save mode is ‘Upsert’. The user can enter multiple composite keys separated by commas on which the 'Upsert' operation has to be done.
Additional Parameters: Provide details of the additional parameters.
Connection String (*): Provide a connection string.
The Meta Information fields vary based on the selected Connection Type option.
The users can select some specific columns to change the column name or data type while writing it to the collection. Users have to type the name of the column in the name field that has to be modified. If you went to change the name of the column, then put the name of your choice in the alias name section otherwise keep it the same as of column name. Then select the Column Type from the drop-down menu into which you want to change the datatype of that particular column. Once this is done, while writing the selected column data type and column name will be converted to your given choice.
or
Use the Download Data and Upload File options to select the desired columns.
Upload File: The user can upload the existing system files (CSV, JSON) using the Upload File icon (file size must be less than 2 MB).
Download Data (Schema): Users can download the schema structure in JSON format by using the Download Data icon.
Click the Save Component in Storage icon for the PyMongo Writer component.
A message appears to notify the successful update of the component.
Click on the Activate Pipeline icon.
The pipeline will be activated and the PyMongo writer component will write the in-event data to the given MongoDB collection.
The MongoDB writer component is designed to write the data in the MongoDB collection.
All component configurations are classified broadly into the following sections:
Meta Information
Follow the given steps in the demonstration to configure the Mongo (Spark) Writer component.
Please Note: In the Connection Type field, you can choose one of the three options: SRV, Standard, and Connection String.
Please Note: The fields marked as (*) are mandatory fields.
Connection Type: Select the connection type from the drop-down:
Standard
SRV
Connection String
Host IP Address (*): Hadoop IP address of the host.
Port(*): Port number (It appears only with the Standard Connection Type).
Username(*): Provide username.
Password(*): Provide a valid password to access the MongoDB.
Database Name(*): Provide the name of the database from where you wish to read data.
Collection Name(*): Provide the name of the collection.
Schema File Name: Upload Spark Schema file in JSON format.
Additional Parameters: Provide the additional parameters to connect with MongoDB. This field is optional.
Enable SSL: Check this box to enable SSL for this components. MongoDB connection credentials will be different if this option is enabled.
Certificate Folder: This option will appear when the Enable SSL field is checked-in. The user has to select the certificate folder from drop down which contains the files which has been uploaded to the admin settings for connecting MongoDB with SSL. Please refer the below given images for the reference.
Save Mode: Select the Save mode from the drop down.
Append: This operation adds the data to the collection.
Ignore: "Ignore" is an operation that skips the insertion of a record if a duplicate record already exists in the database. This means that the new record will not be added, and the database will remain unchanged. "Ignore" is useful when you want to prevent duplicate entries in a database.
Upsert: It is a combination of update and insert options. It is an operation that updates a record if it already exists in the database or inserts a new record if it does not exist. This means that "upsert" updates an existing record with new data or creates a new record if the record does not exist in the database.
The DSL (Data Science Lab) Runner is utilized to manage and execute data science experiments that have been created within the DS Lab module and imported into the pipeline.
All component configurations are classified broadly into 3 section:
Meta Information
Drag the DS Lab Runner component to the Pipeline Workflow canvas.
The DS Lab Model runner requires input data from an Event and sends the processed data to another Event. So, create two events and drag them onto the Workspace.
Connect the input and output events with the DS Lab Runner component as displayed below.
The data in the input event can come from any Ingestion, readers, any script from DS Lab Module or shared events.
Click the DS Lab Model runner component to get the component properties tabs below.
It is the default tab to open for the component.
Select an Invocation type from the drop-down menu to confirm the running mode of the reader component. Select the Real-Time or Batch option from the drop-down menu.
Please Note: If the selected Invocation Type option is Batch, then Grace Period (in sec)* field appears to provide the grace period for component to go down gracefully after that time.
Deployment Type: It displays the deployment type for the component. This field comes pre-selected.
Batch Size (min 10): Provide the maximum number of records to be processed in one execution cycle (Min limit for this field is 10).
Failover Event: Select a failover Event from the drop-down menu.
Container Image Version: It displays the image version for the docker container. This field comes pre-selected.
Description: Description of the component. It is optional.
Please Note: The DS Lab Runner contains two execution types in its Meta Information tab.
Please follow the demonstration to use the DS Lab Runner as a Model Runner.
Please follow the below steps to configure the Meta Information when the Model Runner is selected as execution type:
Project Name: Name of the project where you have created your model in DS Lab Module.
Model Name: Name of the saved model in Project under the DS Lab module.
Please follow the demonstration to configure the component for Execution Type as Script Runner as Execution Type.
Please follow the below-given steps to configure the Meta Information when the Script Runner is selected as Execution Type:
Function Input Type: Select the input type from the drop-down. There are two options in this field:
DataFrame
List of dictionary
Project Name: Provide the name of the Project that contains a model in the DS Lab Module.
Script Name: Select the script that has been exported from the notebook in the DS Lab module. The script written in the DS Lab module should be inside a function.
External Library: If any external libraries are used in the script we can mention them here. We can mention multiple libraries by giving a comma (,) in between the names.
Start Function: Select the function name in which the script has been written.
Input Data: If any parameter has been given in the function, then the parameter name is provided as Key, and the value of the parameters has to be provided as value in this field.
A success notification message appears when the component gets saved.
The DS Lab Runner component reads the data coming to the input event, runs the model, and gives the output data with predicted columns to the output event.
The GCS Monitor continuously monitors a specific folder. When a new file is detected in the monitored folder, the GCS Monitor reads the file's name and triggers an event. Subsequently, the GCS Monitor copies the detected file to a designated location as defined and then removes it from the monitored folder. This process is repeated for each file that is found.
It is the default tab to open for the component while configuring it.
Invocation Type: Select an invocation mode as Real-Time.
Deployment Type: It displays the deployment type for the reader component. This field comes pre-selected.
Container Image Version: It displays the image version for the docker container. This field comes pre-selected.
Failover Event: Select a failover Event from the drop-down menu.
Batch Size (min 10): Provide the maximum number of records to be processed in one execution cycle (Min limit for this field is 10).
Bucket Name: Enter the source bucket name.
Directory Path: Fill in the monitor folder path using a forward-slash (/). For example, "monitor/".
Copy Directory Path: Specify the copy folder name where you want to copy the uploaded file. For example, "monitor_copy/".
Choose File: Upload a Service Account Key(s) file.
File Name: After the Service Account Key file is uploaded, the file name is auto-generated based on the uploaded file.
Copy Bucket Name: Fill in the destination bucket name where you need to copy the files.
Sqoop Executer is a tool designed to efficiently transfer data between Hadoop (Hive/HDFS) and structured data stores such as relational databases (e.g., MySQL, Oracle, SQL Server).
All component configurations are classified broadly into the following sections:
Meta Information
It is the default tab to open for the component while configuring it.
Invocation Type: Select an invocation mode out of ‘Real-Time’ or ‘Batch’ using the drop-down menu.
Deployment Type: It displays the deployment type for the reader component. This field comes pre-selected.
Container Image Version: It displays the image version for the docker container. This field comes pre-selected.
Failover Event: Select a failover Event from the drop-down menu.
Batch Size (min 10): Provide the maximum number of records to be processed in one execution cycle (Min limit for this field is 10).
Username: Enter the username for connecting to a relational database.
Host: Provide a host or IP address of the machine where your relational database server is running.
Port: Provide a Port number (the default number for these fields is 22).
Authentication: Select an authentication type from the drop-down:
Password: Enter the password.
PEM/PPK File: choose a file and provide the file name if the user selects this authentication option.
Command: Enter the relevant Sqoop command. In Apache Sqoop, a command is a specific action or operation that you perform using the Sqoop tool. Sqoop provides a set of commands to facilitate the transfer of data between Hadoop (or more generally, a Hadoop ecosystem component) and a relational database. These commands are used in Sqoop command-line operations to interact with databases, import data, export data, and perform various data transfer tasks.
Some of the common Sqoop commands include:
Import command: This command is used to import data from a relational database into Hadoop. You can specify source and target tables, database connection details, and various import options.
Export Command: This command is used to export data from Hadoop to a relational database. You can specify source and target tables, database connection details, and export options.
Eval Command: This command allows you to evaluate SQL queries and expressions without importing or exporting data. It's useful for testing SQL queries before running import/export commands.
List Databases Command: This command lists the available databases on the source database server.
The AutoML Runner is designed to automate the entire workflow of creating, training, and deploying machine learning models. It seamlessly integrates with the DS Lab module and allows for the importation of models into the pipeline.
All component configurations are classified broadly into 3 sections.
Meta Information
Drag and drop the Auto ML Runner component to the Workflow Editor.
The Auto ML Runner requires input data from an Event and sends the processed data to another Event. Create two Events and drag them on the Workspace.
Connect the input and output events with the Auto ML Runner component as displayed below.
The data in the input event can come from any Ingestion, Readers, Any script from DS Lab Module or shared events.
Click the Auto ML Runner component to get the component properties tabs below.
It is the default tab to open for the component.
Select an Invocation type from the drop-down menu to confirm the running mode of the reader component. Select either Real-Time or Batch option from the drop-down menu.
Please Note: If the selected Invocation Type option is Batch, then Grace Period (in sec)* field appears to provide the grace period for component to go down gracefully after that time.
Deployment Type: It displays the deployment type for the component. This field comes pre-selected.
Container Image Version: It displays the image version for the docker container. This field comes pre-selected.
Failover Event: Select a failover Event from the drop-down menu.
Batch Size (min 10): Provide the maximum number of records to be processed in one execution cycle (Min limit for this field is 10).
Project Name: Name of the project where you have created your model in DS Lab Module.
Model Name: Name of the saved model in project in the DS Lab module.
A success notification message appears when the component gets saved.
The Auto ML Runner component reads the data coming to the input event, runs the model and gives the output data with predicted columns to the output event.
Script: The Exported script appears under this space. For more information about exporting the script from the DSLab module, please refer to the following link: .
Click the Save Component in the Storage icon.
Click the Save Component in Storage icon.

The role of data producers is to ensure a continuous flow of data into the pipeline, providing the necessary raw material for subsequent processing and analysis.
MQTT(Message Queuing Telemetry Transport) is a lightweight, publish-subscribe, machine to machine network protocol for message queue/message queuing service. It is designed for connections with remote locations that have devices with resource constraints or limited network bandwidth, such as in the Internet of Things.
All component configurations are classified broadly into the following sections:
Meta Information
Follow the given demonstration to configure the MQTT component.
Host IP Address: Provide the IP Address of MQTT broker.
Username: Enter the username.
Port: Enter the port for the given IP address.
Authenticator: There are 2 options in it, select any one to authenticate.
Password: Enter the password to authenticate.
PEM/PPK File: Upload the PEM/PPK File to authenticate.
Quality of service(QoS): Enter the values either 0, 1 or 2. The Quality of Service (QoS) level is an agreement between the sender of a message and the receiver of a message that defines the guarantee of delivery for a specific message. There are 3 QoS levels in MQTT:
At most once (0): The minimal QoS level is zero. This service level guarantees a best-effort delivery. There is no guarantee of delivery. The recipient does not acknowledge receipt of the message and the message is not stored and re-transmitted by the sender.
At least once (1): QoS level 1 guarantees that a message is delivered at least one time to the receiver. The sender stores the message until it gets a PUBACK packet from the receiver that acknowledges receipt of the message.
Exactly once (2): QoS 2 is the highest level of service in MQTT. This level guarantees that each message is received only once by the intended recipients. QoS 2 is the safest and slowest quality of service level. The guarantee is provided by at least two request/response flows (a four-part handshake) between the sender and the receiver. The sender and receiver use the packet identifier of the original PUBLISH message to coordinate delivery of the message.
MQTT topic: Enter the name of the MQTT topic from where the messages have been published and to which the messages have to be consumed.
Please Note: Kindly perform the following tasks to run a Pipeline workflow with the MQTT consumer component:
After configuring the component click the Save Component in Storage option for the component.
Update the Pipeline workflow and activate the pipeline to see the MQTT consumer working in a Pipeline Workflow. The user can get details through the Logs panel when the Pipeline workflow starts loading data.
SFTP (Secure File Transfer Protocol) Monitor is used to monitor and manage files transfer over SFTP servers. It is designed to keep track of file transfers over SFTP.
All component configurations are classified broadly into the following sections:
Meta Information
Drag and Drop the SFTP Monitor consumer component which is inside the consumer section of the system component part to the Workflow Editor.
Click the dragged ingestion component to get the component properties tabs.
The Basic Information Tab is the default tab for the component.
Select the Invocation Type (at present only the Real-Time option is provided).
Deployment Type: It comes preselected based on the component.
Container Image Version: It comes preselected based on the component.
Failover Event: Select a failover event from the drop-down menu.
Batch Size (min 10): Provide the maximum number of records to be processed in one execution cycle (Min limit for this field is 10).
Configure the Meta Information tab for the dragged SFTP Monitor component.
Host: Broker IP or URL
Username: If authentication is required then give username
Port: Provide the Port number
Authentication: Select an authentication option using the drop-down list.
Password: Provide a password to authenticate SFTP Monitor.
PEM/PPK File: Choose a file to authenticate the SFTP Monitor component. The user needs to upload a file if this authentication option has been selected.
Directory Path: Fill the monitor folder path using forward-slash (/). E.g., /home/monitor
Copy Directory Path: Fill in the copy folder name where you want to copy the uploaded file. E.g., /home/monitor_copy
Please Note: Don't use a nested directory structure in the directory path and copy directory path. Else the component won't behave in an expected manner.
Don't use the dirpath and copy-path as follows: dirpath: home/monitor/datacopy-dir:home/monitor/data/copy_data
Channel: Select a channel option from the drop-down menu (the supported channel is SFTP).
Click the Save Component in Storage icon to save configured details of the SFTP Monitor component.
A notification message appears to confirm the same.
Please Note:
a. The SFTP Monitor component monitors the file coming to the monitored path and copies the file in the Copy Path location for SFTP Reader to read.
b. The SFTP Monitor component requires an Event to send output.
c. The SFTP Monitor send the file name to the out event along with File size, last modified time and ingestion time (Refer the below image).
d. Only one SFTP monitor will read and move the file if multiple monitors are set up to monitor the same file path at the same time.
EventHub subscriber typically consumes event data from an EventHub by creating an event processor client that reads the event data from the EventHub.
All component configurations are classified broadly into the following sections:
Meta Information
Follow the provided demonstration to configure the Eventhub Subscriber component.
There are two read using methods:
Connection String
Principal Secret
Connection String: It is a string of parameters that are used to establish a connection to an Azure EventHub
Consumer Group: It is a logical grouping of event consumers (subscribers) that read and process events from the same partition of an event hub.
EventHub Name: It refers to the specific Event Hub within the Event Hubs namespace to which data is being sent or received.
Checkpoint Location: It is a location in the event stream that represents the last event that has been successfully processed by the subscriber.
Enqueued time: It indicates the time when the event was added to the partition, which is typically the time when the event occurred or was generated.
Subscriber namespace: It is a logical entity that is used to group related subscribers and manage access control to EventHubs within the namespace.
Client ID: The ID of the Azure AD application that has been registered in the Azure portal and that will be used to authenticate the subscriber. This can be found in the Azure portal under the "App registrations" section.
Tenant ID: The ID of the Azure AD tenant that contains the Azure AD application and service principal that will be used to authenticate the subscriber.
Client secret: The secret value that is associated with the Azure AD application and that will be used to authenticate the subscriber.
Consumer group: It is a logical grouping of event consumers (subscribers) that read and process events from the same partition of an event hub.
EventHub Name: It refers to the specific Event Hub within the Event Hubs namespace to which data is being sent or received.
Checkpoint Location: It is a location in the event stream that represents the last event that has been successfully processed by the subscriber.
Enqueued time: It indicates the time when the event was added to the partition, which is typically the time when the event occurred or was generated.
Subscriber namespace: It is a logical entity that is used to group related subscribers and manage access control to EventHubs within the namespace.
Video stream consumer is designed to consume .mp4 video from realtime source or stored video in some SFTP location in form of frames.
All component configurations are classified broadly into the following sections:
Meta Information
Please follow the given demonstration to configure the Video Stream Consumer component.
Please Note:
Video Stream component supports only .mp4 file format. It reads/consumes video frame by frame.
The Testing Pipeline functionality and Data Metrices option (from Monitoring Pipeline functionality) are not available for this component.
Drag & drop the Video Stream Consumer component to the Workflow Editor.
Click the dragged Video Stream Consumer component to open the component properties tabs.
It is the default tab to open for the component.
Invocation Type: Select an Invocation type from the drop-down menu to confirm the running mode of the reader component. Select ‘Real-Time’ or ‘Batch’ from the drop-down menu.
Deployment Type: It displays the deployment type for the component. This field comes pre-selected.
Batch Size (min 10): Provide the maximum number of records to be processed in one execution cycle (Min limit for this field is 10).
Failover Event: Select a failover Event from the drop-down menu.
Container Image Version: It displays the image version for the docker container. This field comes pre-selected.
Description: Description of the component (It is optional).
Please Note: If the selected Invocation Type option is Batch, then, Grace Period (in sec)* field appears to provide the grace period for component to go down gracefully after that time.
Selecting Real-time as the Invocation Type option will display the Intelligent Scaling option.
Select the Meta Information tab and provide the mandatory fields to configure the dragged Video Stream Consumer component.
Host IP Address (*)- Provide IP or URL
The input in the Host IP Address field in the Meta Information tab changes based on the selection of Channel. There are two options available:
SFTP: It allows us to consume stored videos from SFTP location. Provide SFTP connection details.
URL: It allows us to consume live data from different sources such as cameras. We can provide the connection details for live video coming.
Username (*)- Provide username
Port (*)- Provide Port number
Authentication- Select any one authentication option out of Password or PEM PPK File
Reader Path (*)- Provide reader path
Channel (*)- The supported channels are SFTP and URL
Resolution (*)- Select an option defining the video resolution out of the given options.
Frame Rate – Provide rate of frames to be consumed.
Please Note: The fields for the Meta Information tab change based on the selection of the Authentication option.
While using authentication option as Password it adds a password column in the Meta information.
While choosing the PEM/PPK File authentication option, the user needs to select a file using the Choose File option.
Please Note: SFTP uses IP in the Host IP Address and URL one uses URL in Host IP Address.
Click the Save Component in Storage icon for the Video Stream Consumer component.
A message appears to notify that the component properties are saved.
The Video Stream Consumer component gets configured to pass the data in the Pipeline Workflow.
Please Note: The Video Stream Consumer supports only the Video URL.
This component is used to fetch the tweets of any hashtag from Twitter.
All component configurations are classified broadly into the following sections:
Meta Information
Follow the demonstration to configure the Twitter Scrapper component.
Configuring the meta information tab for Twitter Scrapper:
Consumer API Key: Provide the Consumer API Key for the Twitter Scrapper.
Consumer API Secret Key: This Key acts as password for this component.
Filter text: Enter the hashtag from where the Tweets are to be fetched.
Twitter Data Type: This field contains two options:
History: It will fetch all the past Tweets.
Real-time: It will fetch the real-time Tweets.
API ingestion and Webhooks are two methods used to receive data from a third-party service or system.
All component configurations are classified broadly into 3 section
Meta Information
Follow the steps given in the demonstration to configure the API Ingestion component.
Ingestion type: Select API ingestion as ingestion type from drop down. (API Ingestion or Webhook)
Ingestion Id: It will be predefined in the component.
Ingestion Secret: It will be predefined in the component.
Once the pipeline gets saved, the Component Instance Id URL gets generated in the meta information tab of the component as shown in the above image.
Connect a out event with the component and activate the pipeline.
Open the Postman tool / other tools where you want to configure the API/webhook endpoint.
Create a new request and select the POST as request method from drop down and provide the generated Component Instance Id URL in the URL section of the Postman tool.
Navigate to the Headers section in the Postman tool and provide the Ingestion Id (key : ingestionId)and Ingestion Secret (key : ingestionSecret) which is pre-defined in the Meta Information of the API Ingestion component.
Navigate to the Body section in the Postman and select raw tab and select the JSON option from the drop-down as the data type.
Now, enter the JSON data in the space provided and click on send button.
The API Ingestion component will process the JSON data entered in the Postman tool and it will send the JSON data to the out event.
Please refer the below-given image to configure the Postman tool for API Ingestion component:
OPC UA (OPC Unified Architecture) is a communication protocol and standard used for collecting and transmitting data from industrial devices and systems to a data processing or analytics platform. OPC UA is commonly employed in data pipelines for handling data from industrial and manufacturing environments, making it an integral part of industrial data pipelines.
All component configurations are classified broadly into the following sections:
Meta Information
It is the default tab to open for the component while configuring it.
Invocation Type: Select an invocation mode out of ‘Real-Time’ or ‘Batch’ using the drop-down menu.
Deployment Type: It displays the deployment type for the reader component. This field comes pre-selected.
Container Image Version: It displays the image version for the docker container. This field comes pre-selected.
Failover Event: Select a failover Event from the drop-down menu.
Batch Size (min 10): Provide the maximum number of records to be processed in one execution cycle (Min limit for this field is 10).
URL: Provide URL link. In OPC UA (OPC Unified Architecture), a URL (Uniform Resource Locator) is used to specify the address or location of an OPC UA server or endpoint. URLs in OPC UA are typically used to establish connections to servers and access the services provided by those servers.
Message Security Mode: Select a message security mode from the drop-down menu (The supported options are ‘Sign’ and ‘SignAndEncrypt’).
Security Policy: Select a policy using the drop-down menu. Three types of security policies are supported:
Basic256: Basic256 is a security profile that provides encryption and signature capabilities for OPC UA communication. It uses a 256-bit encryption key. All messages exchanged between clients and servers are encrypted using a 256-bit encryption key, providing data confidentiality. Messages are digitally signed to ensure data integrity and authenticity. Signature algorithms ensure that the message has not been tampered with during transmission. Basic256 uses symmetric encryption, meaning both parties share the same secret key for encryption and decryption.
Basic256Sha256: Basic256Sha256 is an enhanced security profile that builds upon the features of Basic256. It offers stronger security by using SHA-256 cryptographic algorithms for key generation and message digests.
Basic128Rsa15: Basic128Rsa15 is a security profile that uses 128-bit encryption and RSA-15 key exchange. It is considered less secure compared to Basic256 and Basic256Sha256. Basic128Rsa15 uses 128-bit encryption for data confidentiality. It relies on the RSA-15 key exchange mechanism, which is considered less secure than newer RSA and elliptic curve methods.
Certificate File Name: This name gets reflected based on the Choose File option provided for the Certificate file.
Choose File: Browse a certificate file by using this option.
PEM File Name: This name gets reflected based on the Choose File option provided for the PEM file.
Choose File: Browse a PEM file by using this option.
Source Node: Enter the source node. The "Source Node" refers to the entity or component within the OPC UA server that is the source or originator of an event or notification. It represents the object or node that generates an event when a specific condition or state change occurs.
Event Node: Enter the event node. The "Event Node" refers to the specific node in the OPC UA AddressSpace that represents an event or notification that can be subscribed to by OPC UA clients. It is a node that defines the structure and properties of the event, including the event's name, severity, and other attributes.
The EventHub Publisher leverages the scalability and throughput capabilities of Event Hubs to ensure efficient and reliable event transmission.
All component configurations are classified broadly into 3 section
Meta Information
Please follow the steps given in the walk-through to configure the Eventhub Publisher component.
There are two read using methods:
Connection String
Principal Secret
Connection String: It is a string of parameters that are used to establish a connection to an Azure EventHub.
Consumer Group: It is a logical grouping of event consumers (subscribers) that read and process events from the same partition of an event hub.
EventHub Name: It refers to the specific Event Hub within the Event Hubs namespace to which data is being sent or received.
Checkpoint Location: It is a location in the event stream that represents the last event that has been successfully processed by the subscriber.
Enqueued time: It indicates the time when the event was added to the partition, which is typically the time when the event occurred or was generated.
Publisher namespace: It is a logical entity that is used to group related publishers and manage access control to EventHubs within the namespace.
Client ID: The ID of the Azure AD application that has been registered in the Azure portal and that will be used to authenticate the publisher. This can be found in the Azure portal under the "App registrations" section.
Tenant ID: The ID of the Azure AD tenant that contains the Azure AD application and service principal that will be used to authenticate the publisher.
Client secret: The secret value that is associated with the Azure AD application and that will be used to authenticate the publisher.
Consumer group: It is a logical grouping of event producer(publisher) that read and process events from the same partition of an event hub.
EventHub Name: It refers to the specific Event Hub within the Event Hubs namespace to which data is being sent or received.
Checkpoint Location: It is a location in the event stream that represents the last event that has been successfully processed by the publisher.
Enqueued time: It indicates the time when the event was added to the partition, which is typically the time when the event occurred or was generated.
Publisher namespace: It is a logical entity that is used to group related publishers and manage access control to EventHubs within the namespace.
A WebSocket producer component is a software component that is used to send data over a WebSocket connection.
All component configurations are classified broadly into the following sections:
Meta Information
Follow the steps given in the demonstration to configure the WebSocket component.
This component can be used to produce data to the internal WebSocket to consume live data. The WebSocket Producer helps the user to get the message received by the Kafka topic.
Steps to configure the component:
Drag & Drop the WebSocket Producer component on the Workflow Editor.
The producer component requires an input event (to get the data) and produces the data to the WebSocket location based on guid, ingestion Id, and ingestion Secret.
Create an event and drag them to the Workspace.
Connect the input event (The data in the input event can come from any Reader, Consumer, or Shared event).
Click on the dragged WebSocket Producer component to open the component properties tabs below.
Basic Information: It is the default tab to open for the WebSocket Producer while configuring the component.
Invocation Type: Select an Invocation type from the drop-down menu to confirm the running mode of the WebSocket Producer component. The supported invocation type is ‘Real-Time’.
Deployment Type: It displays the deployment type for the component. This field comes pre-selected.
Container Image Version: It displays the image version for the docker container. This field comes pre-selected.
Failover Event: Select a failover event from the drop-down menu.
Batch Size (min 10): Provide the maximum number of records to be processed in one execution cycle (Min limit for this field is 10).
Intelligent Scaling: Component pods scale up automatically based on the given max instance if the component lag is more than 60% and the pod goes down if the component lag is less than 10%.
Open the Meta Information tab and configure the required fields:
GUID: It will be displayed after saving the component and updating the pipeline.
Ingestion Id: It will auto-generate with a new component.
Ingestion Secret: It will be auto-generated with a new component and regenerate after clicking on the Refresh Ingestion icon.
Click the Save Component in Storage icon provided in the WebSocket Producer configuration panel to save the component.
A message appears to notify the successful update of the component.
Click on the Update Pipeline icon to update the pipeline.
RabbitMQ is an open-source message-broker software that enables communication between different applications or services. It implements the Advanced Message Queuing Protocol (AMQP) which is a standard protocol for messaging middleware. RabbitMQ is designed to handle large volumes of message traffic and to support multiple messaging patterns such as point-to-point, publish/subscribe, and request/reply. In a RabbitMQ system, messages are produced by a sender application and sent to a message queue. Consumers subscribe to the queue to receive messages and process them accordingly. RabbitMQ provides reliable message delivery, scalability, and fault tolerance through features such as message acknowledgement, durable queues, and clustering.
A RabbitMQ consumer is a client application or process that subscribes to a queue and receives messages in a push mode, using RabbitMQ client libraries and various subscription options.
All component configurations are classified broadly into the following sections:
Meta Information
Follow the steps given in the demonstration to configure the Rabbit MQ Consumer component.
Host: Enter the host for RabbitMQ.
Port: Enter the port.
Username: Enter the username for RabbitMQ.
Password: Enter the password to authenticate with RabbitMQ consumer.
Queue: Provide queue for RabbitMQ consumer. A queue is a buffer that holds messages produced by publishers until they are consumed by subscribers. Queues are the basic building blocks of a RabbitMQ messaging system and are used to store messages that are waiting to be processed.
The Kafka Consumer component consumes the data from the given Kafka topic. It can consume the data from the same environment and external environment with CSV, JSON, XML, and Avro formats. This comes under the Consumer component group.
All component configurations are classified broadly into the following sections:
Meta Information
Check out the steps provided in the demonstration to configure the Kafka Consumer component.
Please Note: It currently supports SSL and Plaintext as Security types.
This Component can read the data from external Brokers as well with SSL as the security type and host Aliases:
Click on the dragged Kafka Consumer component to get the component properties tabs.
Configure the Basic Information tab.
Select an Invocation type from the drop-down menu to confirm the running mode of the component. Select the Real-Time option from the drop-down menu.
Deployment Type: It displays the deployment type for the component. This field comes pre-selected.
Container Image Version: It displays the image version for the docker container. This field comes pre-selected.
Failover Event: Select a failover Event from the drop-down menu.
Batch Size (min 10): Provide the maximum number of records to be processed in one execution cycle (Min limit for this field is 10
Enable Auto-Scaling: Component pod scale up automatically based on a given max instance, if component lag is more than 60%.
Topic Name: Specify the topic name that the user wants to consume data from Kafka.
Start From: The user will find four options here. Please refer at the bottom of the page for a detailed explanation along with an example.
Processed:
It Represents the offset that has been successfully processed by the consumer.
This is the offset of the last record that has been successfully read and processed by the consumer.
By selecting this option, the consumer initiates data consumption from the point where it previously successfully processed, ensuring continuity in the consumption process.
Beginning:
It Indicates the earliest available offset in a Kafka topic.
When a consumer starts reading from the beginning, it means it will read from the first offset available in the topic, effectively reading all messages from the start.
Latest:
It represents the offset at the end of the topic, indicating the latest available message.
When a consumer starts reading from the latest offset, it means it will only read new messages that are produced after the consumer starts.
Timestamp:
It refers to the timestamp associated with a message. Consumers can seek to a specific timestamp to read messages that were produced up to that timestamp.
To utilize this option, users are required to specify both the Start Time and End Time, indicating the range for which they intend to consume data. This allows consumers to retrieve messages within the defined time range for processing.
Is External: The user can consume external topic data from the external bootstrap server by enabling the Is External option. The Bootstrap Server and Config fields will display after enabling the Is External option.
Bootstrap Server: Enter external bootstrap details.
Config: Enter configuration details of external details.
Input Record Type: It contains the following input record types:
CSV: The user can consume CSV data using this option. The Headers and Separator fields will display if the user selects choose CSV input record type.
Header: In this field, the user can enter column names of CSV data that consume from the Kafka topic.
Separator: In this field, the user can enter separators like comma (,) that are used in the CSV data.
JSON: The user can consume JSON data using this option.
XML: The user can consume parquet data using this option.
AVRO: The user can consume Avro data using this option.
Security Type: It contains the following security types:
Plain Text: Choose the Plain Text option if there environment without SSL.
Host Aliases: This option contains the following fields:
IP: Provide the IP address.
Host Names: Provide the Host Names.
SSL: Choose the SSL option if there environment with SSL. It will display the following fields:
Trust Store Location: Provide the trust store path.
Trust Store Password: Provide the trust store password.
Key Store Location: Provide the key store path.
Key Store Password: Provide the key store password.
SSL Key Password: Provide the SSL key password.
Host Aliases: This option contains the following fields:
IP: Provide the IP.
Host Names: Provide the host names.
Please Note: The Host Aliases can be used with the SSL and Plain text Security types.
Processed:
If a consumer has successfully processed up to offset 2, it means it has processed all messages up to and including the one at offset 2 (timestamp 2024-02-27 01:00 PM). Now, the consumer will resume processing from offset 3 onwards.
Beginning:
If a consumer starts reading from the beginning, it will read messages starting from offset 0. It will process messages with timestamps from 2024-02-27 10:00 AM onward.
Latest:
If a consumer starts reading from the latest offset, it will only read new messages produced after the consumer starts. Let's say the consumer starts at timestamp 2024-02-27 02:00 PM; it will read only the message at offset 3.
Timestamp:
If a consumer seeks to a specific timestamp, for example, 2024-02-27 11:45 AM, it will read messages with offsets 2 and 3, effectively including the messages with timestamps 2024-02-27 01:00 PM and 2024-02-27 02:30 PM, while excluding the messages with timestamps 2024-02-27 10:00 AM and 2024-02-27 11:30 AM.
Mongo ChangeStream allow applications to access real-time data changes without the complexity. Applications can use change streams to subscribe to all data changes on a single collection, a database, or an entire deployment, and immediately react to them. Because change streams use the aggregation framework, applications can also filter for specific changes.
All component configurations are classified broadly into 3 section:
Meta Information
Follow the given walk-through to configure the Mongo Change Stream component.
Connection type: Select the connection type from the drop-down menu and provide the required credentials.
Database name: Enter the database name.
Collection name: Enter the collection name from the given database.
Operation type: Select the operation type from the drop-down menu. There are four types of operations supported here: Insert, Update, Delete, and Replace.
Enable SSL: Check this box to enable SSL for this components. Credentials will be different for this.
Activate the pipeline, make any operation from the above given operation types in the Mongo collection.
Whatever operation has been done in the Mongo collection, the Mongo ChangeStream component will fetch that change and send it to the next Event in the Pipeline Workflow.
Enable SSL: Check this box to enable SSL for this components. MongoDB connection credentials will be different if this option is enabled.
Certificate Folder: This option will appear when the Enable SSL field is checked-in. The user has to select the certificate folder from drop down which contains the files which has been uploaded to the admin settings. Please refer the below given images for the reference.
In AWS, SNS (Simple Notification Service) is a fully managed messaging service that enables you to send notifications and messages to distributed systems and components. SNS Monitor is a feature or functionality related to SNS that allows users to monitor the activity, health, and performance of their SNS topics and messages. It provides metrics and insights into the delivery status, throughput, success rates, and other relevant information about the messages sent through SNS topics.
All component configurations are classified broadly into 3 section:
Meta Information
Access Key: Enter the AWS access key.
Secret Key: Enter the AWS secret key.
Region: Select the region of the SNS topic.
SQS URL: Enter the SQS URL obtained after creating an SQS queue, which will fetch the notification and send it to the out event if there is any modification in the S3 bucket.
Please Note:
Follow the below-given steps to set up monitoring for an S3 bucket using AWS SNS monitor:
Create an SNS topic in your AWS account.
Create an SQS queue that will subscribe to the SNS topic you created earlier.
After setting up the SQS queue, obtain the SQS URL associated with it.
With the SNS topic and SQS queue configured, you need to create an event notification for the S3 bucket that needs to be monitored.
This event notification will be configured to send notifications to the specified SNS topic.
Whenever there is a modification in the S3 bucket, the SNS topic will trigger notifications, which will be fetched by the SQS queue using its URL.
Finally, these notifications will be sent to the out Event, allowing you to monitor activity within the S3 bucket effectively.
Please go through the below given steps to create an SNS topic, SQS queue and Event Notification.
Sign in to the AWS console.
Navigate to the "Services" option or use the search option at the top and select "Simple Notification Service (SNS)".
Once redirected to the SNS page, go to the "Topics" option and click on "Create topic".
Enter a name and display name for the topic, and optionally, provide a description.
Click on "Create topic" to create the SNS topic.
Once the topic is created, go to the "Subscriptions" tab and click on "Create subscription".
Choose "Amazon SQS" as the protocol.
Select the desired SQS queue from the drop-down list or create a new queue if needed.
Click on "Create subscription" to link the SQS queue to the SNS topic.
After successfully creating the subscription, the SQS URL will be displayed. This URL can be used to receive messages from the SNS topic.
Sign in to the AWS console.
Navigate to the "Services" option or use the search option at the top and select "Simple Queue Service (SQS)".
Once redirected to the SQS page, where the list of available queues will be displayed, go to the "Topics" option and click on "Create queue".
Enter the queue name and configure any required settings such as message retention period, visibility timeout, etc.
Click on the "Create queue" button to create the queue.
After successfully creating the queue, select the queue from the list.
In the queue details page, navigate to the "Queue Actions" dropdown menu and select "Subscribe to SNS topic".
Choose the SNS topic to which you want to subscribe from the dropdown menu.
Configure any required parameters such as filter policies and delivery retry policies.
Click on the "Subscribe" button to create the subscription.
Once the subscription is created successfully, the SQS URL will be displayed in the subscription details.
The Obtained URL can be used in the SQS URL field in the AWS SNS monitor component.
Once the SNS and SQS are configured, the user has to create an event notification in a bucket to monitor the activity of the S3 bucket using the AWS SNS monitor component in the pipeline. This involves setting up event notifications within an S3 bucket to trigger notifications whenever certain events occur, such as object creation, deletion, or modification. By configuring these event notifications, users can ensure that relevant events in the S3 bucket are captured and forwarded to the specified SNS topic for further processing or monitoring. This integration allows for seamless monitoring of S3 bucket activities using the AWS SNS monitor component within the pipeline.
Sign in to the AWS Management Console.
Navigate to the "Services" option and select "S3" from the list of available services.
Once redirected to the S3 dashboard, locate and click on the desired bucket for which you want to create an event notification.
In the bucket properties, navigate to the "Properties" tab.
Scroll down to the "Events" section and click on "Create event notification".
Provide a name for the event notification configuration.
Choose the events that the user wants to trigger notifications for, such as "All object create events", "All object delete events", or specific events based on prefixes or suffixes.
Specify the destination for the event notification. Select "Amazon SNS" as the destination type.
Choose the SNS topic to which the user wants to publish the event notifications.
Optionally, configure any additional settings such as filters based on object key prefixes or suffixes.
Review the configuration and click "Save" or "Create" to create the event notification.
Once saved, the event notification will be configured for the selected S3 bucket, and notifications will be sent to the specified SNS topic whenever the configured events occur within the bucket. Subsequently, these notifications will be fetched by the SQS URL subscribed to that SNS topic.
Go through the below given demonstration to create SNS topic, SQS ques and Event notification in AWS.
Please Note: The user should ensure that the AWS Bucket, SNS topic, and SQS topic are in the same region to create an event notification.
Click on save component icon to save the component.
Click on save pipeline icon to save the pipeline.
Drag and drop the Kafka Consumer Component to the Workflow Editor.
RabbitMQ producer plays a vital role in enabling reliable message-based communication and data flow within a data pipeline.
RabbitMQ is an open-source message-broker software that enables communication between different applications or services. It implements the Advanced Message Queuing Protocol (AMQP) which is a standard protocol for messaging middleware. RabbitMQ is designed to handle large volumes of message traffic and to support multiple messaging patterns such as point-to-point, publish/subscribe, and request/reply. In a RabbitMQ system, messages are produced by a sender application and sent to a message queue. Consumers subscribe to the queue to receive messages and process them accordingly. RabbitMQ provides reliable message delivery, scalability, and fault tolerance through features such as message acknowledgement, durable queues, and clustering.
In RabbitMQ, a producer is also referred to as a "publisher" because it publishes messages to a particular exchange. The exchange then routes the message to one or more queues, which can be consumed by one or more consumers (or "subscribers").
All component configurations are classified broadly into following section
Meta Information
Host: Enter the host for RabbitMQ.
Port: Enter the port.
Username: Enter the username for RabbitMQ.
Password: Enter the password to authenticate with RabbitMQ Producer.
Queue: In RabbitMQ, a queue is a buffer that holds messages that are waiting to be processed by a consumer (or multiple consumers). In the context of a RabbitMQ producer, a queue is a destination where messages are sent for eventual consumption by one or more consumers.
Virtual host: Provide a virtual host. In RabbitMQ, a virtual host is a logical grouping of resources such as queues, exchanges, and bindings, which allows you to isolate and segregate different parts of your messaging system.
Exchange: Provide a Exchange. An exchange is a named entity in RabbitMQ that receives messages from producers and routes them to queues based on a set of rules called bindings. An exchange can have several types, including "direct", "fanout", "topic", and "headers", each of which defines a different set of routing rules.
Query Type: Select the query type from the drop-down. There are three(3) options available in it:
Classic: Classic queues are the most basic type of queue in RabbitMQ, and they work in a "first in, first out" (FIFO) manner. In classic queues, messages are stored on a single node, and consumers can retrieve messages from the head of the queue.
Stream: In stream queues, messages are stored across multiple nodes in a cluster, with each message being replicated across multiple nodes for fault tolerance. Stream queues allow for messages to be processed in parallel and can handle much higher message rates than classic queues.
Quorum: In quorum queues, messages are stored across multiple nodes in a cluster, with each message being replicated across a configurable number of nodes for fault tolerance. Quorum queues provide better performance than classic queues and better durability than stream queues.
Exchange Type: Select the query type from the drop-down. There are Four(4) exchange type supported:
Direct: A direct exchange type in RabbitMQ is one of the four possible exchange types that can be used to route messages between producers and consumers. In a direct exchange, messages are routed to one or more queues based on an exact match between the routing key specified by the producer and the binding key used by the queue. That is, the routing key must match the binding key exactly for the message to be routed to the queue.
Fanout: A fanout exchange routes all messages it receives to all bound queues indiscriminately. That is, it broadcasts every message it receives to all connected consumers, regardless of any routing keys or binding keys.
Topic: This type of exchange routes messages to one or more queues based on a matching routing pattern. Potential subtopics include how to create and bind to a topic exchange, how to use wildcards to match routing patterns, and how to publish and consume messages from a topic exchange. Two fields will be displayed when Direct, Fanout and Topic is selected as Exchange type:
Bind Key: Provide the Bind key. The binding key is used on the consumer (queue) side to determine how messages are routed from an exchange to a specific queue.
Publish Key: Enter the Publish key. The Publish key is used by the producer (publisher) when sending a message to an exchange.
Header: This type of exchange routes messages based on header attributes instead of routing keys. Potential subtopics include how to create and bind to a headers exchange, how to publish messages with specific header attributes, and how to consume messages from a headers exchange. X-Match: This field will only appear if Header is selected as Exchange type. There are two options in it:
Any: When X-match is set to any, the message will be delivered to a queue if it matches any of the header fields in the binding. This means that if a binding has multiple headers, the message will be delivered if it matches at least one of them.
All: When X-match is set to all, the message will only be delivered to a queue if it matches all of the header fields in the binding. This means that if a binding has multiple headers, the message will only be delivered if it matches all of them.
Binding Headers: This field will only appear if Header is selected as Exchange type. Enter the Binding headers key and value. Binding headers are used to create a binding between an exchange and a queue based on header attributes. You can specify a set of headers in a binding, and only messages that have matching headers will be routed to the bound queue.
Publishing Headers: This field will only appear if Header is selected as Exchange type. Enter the Publishing headers key and value. Publishing headers are used to attach header attributes to messages when they are published to an exchange.
The EventHub Publisher serves as a bridge between the transformed data within the pipeline and the Azure Event Hubs service. It ensures the efficient and reliable transmission of data.
EventGrid producer component is designed to publish events to Azure EventGrid, which is a fully-managed event routing service provided by Microsoft Azure.
All component configurations are classified broadly in the following sections.
Meta Information
Follow the demonstration to configure the EventGrid Producer component.
Topic endpoint: It is a unique endpoint provided by Azure EventGrid that an EventGrid producer component can use to publish events to a specific topic.
Topic Secret Key: It is a security token that is used to authenticate and authorize access to an Azure EventGrid topic by an EventGrid producer component.
The Kafka producer acts as a data source within the pipeline, generating and publishing messages to Kafka for subsequent processing and consumption.
The Kafka producer plays a crucial role in the Data Pipeline module enabling reliable and scalable data ingestion into the Kafka cluster, where messages can be processed, transformed, and consumed by downstream components or applications.
Kafka's distributed and fault-tolerant architecture allows for scalable and efficient data streaming, making it suitable for various real-time data processing and analytics use cases.
This component is to produce messages to internal/external Kafka topics.
All component configurations are classified broadly into the following sections:
Meta Information
Follow the given demonstration to configure the Kafka Producer component.
Kafka Producer component consumes the data from the previous event and produce the data on a given Kafka topic. It can produce the data in same environment and external environment with CSV, JSON, XML and Avro format. This data can be further consumed by Kafka consumer in the data pipeline.
Drag and drop the Kafka Producer Component to the Workflow Editor.
Click on the dragged Kafka Producer component to get the component properties tabs.
Configure the Basic Information tab.
Select an Invocation type from the drop-down menu to confirm the running mode of the component. Select ‘Real-Time’ from the drop-down menu.
Deployment Type: It displays the deployment type for the component. This field comes pre-selected.
Container Image Version: It displays the image version for the docker container. This field comes pre-selected.
Failover Event: Select a failover Event from the drop-down menu.
Batch Size (min 10): Provide maximum number of records to be processed in one execution cycle (Min limit for this field is 10.
Click on the Meta Information tab to open the properties fields and configure the Meta Information tab by providing the required fields.
Topic Name: Specify topic name where user want to produce data.
Is External: User can produce the data to external Kafka topic by enabling 'Is External' option. ‘Bootstrap Server’ and ‘Config’ fields will display after enable 'Is External' option.
Bootstrap Server: Enter external bootstrap details.
Config: Enter configuration details.
Input Record Type: It contain following input record type:
CSV: User can produce CSV data using this option. ‘Headers’ and ‘Separator’ fields will display if user select choose CSV input record type.
Header: In this field user can enter column names of CSV data that produce to the Kafka topic.
Separator: In this field user can enter separators like comma (,) that used for CSV data.
JSON: User can produce JSON data using this option.
XML: User can produce XML data using this option.
AVRO: User can produce AVRO data using this option. ‘Registry’, ‘Subject’ and ‘Schema’ fields will display if user selects AVRO as the input record type.
Registry: Enter registry details.
Subject: Enter subject details.
Schema: Enter schema.
Host Aliases: In Apache Kafka, a host alias (also known as a hostname alias) is an alternative name that can be used to refer to a Kafka broker in a cluster. Host aliases are useful when you need to refer to a broker using a name other than its actual hostname.
IP: Enter the IP.
Host Names: Enter the host names.
After doing all the configurations click the Save Component in Storage icon provides in the configuration panel to save the component.
A notification message appears to inform about the component configuration saved.
The File Splitter component is designed to split one or more files based on specified conditions.
All component configurations are classified broadly into 3 section
Meta Information
Follow the given steps in the demonstration to configure the File Splitter component.
Split Type: The condition based on which the files are splitted. We have 5 supported file split type:
By File Format
By File Name
By RegExp
By Excel Sheet Name
By Excel Sheet Number
No. of Outputs: Select the total number of output(1-5)
Details: Mapping of each output to out-event.
Out Event: Event/Topic selected automatically.
File Type: Select the right file format for each of the file (PDF,CSV,EXCEL,OTHERS).
Please Note: The user will not be able to copy and paste File Splitter component in the pipeline as the Copy option has been disabled for File Splitter.
Rule splitter component is designed to splits a set of data based on given conditions into smaller and more manageable data subsets.
All component configurations are classified broadly into 3 section
Meta Information
Follow the steps given in the demonstration to configure the Rule Splitter component.
Number of outputs: The total number of sets you want to split your data into(1-7).
Event Relation
Out Event: Automatically mapped based on number of outputs(Make sure to connect this component to same count of events to that of a numbers of outputs).
Conditions: Set of rules based on which the split will happen.
Column Name: Provide column name to apply the condition on.
Condition: Select the condition from the dropdown.
We have 8 supported conditions:
>(Greater than)
<(Less than)
>=(Greater than equal to)
<=(Less than equal to)
==(Equal to)
!=(Not equal to)
BETWEEN
LIKE
Value: Give the value.
Datatype: Specify the datatype of the column you have provided.
Rule Condition: In case of multiple column conditions select from dropdown(AND,OR).
Please Note: The user will not be able to copy and paste Rule Splitter component in the pipeline as the Copy option has been disabled for Rule Splitter.
A stored procedure is a named group of SQL statements that are precompiled and stored in a database. A stored procedure runner component is designed to run pre-compiled set of instructions that is stored in a database and can be executed by a database management system on demand.
All component configurations are classified broadly into 3 section
Meta Information
Follow the given steps in the demonstration to configure the Stored Producer Runner component.
Host IP Address: Enter the Host IP Address for the selected driver.
Port: Enter the port for the given IP Address.
User name: Enter the user name for the provided database.
Password: Enter the password for the provided database.
Database name: Enter the Database name.
Procedure name: Provide the stored procedure name.
Driver: Select the driver from the drop down. There are 4 drivers supported here: MYSQL, MSSQL, Oracle, PostgreSQL.
Input Parameters: These are values passed into the stored procedure from an external application or script(with name, value and type).
Output Parameters: These are values returned by the stored procedure to the calling application or script(with name and type).
The Synthetic Data Generator component is designed to generate the desired data by using the Draft07 schema of the data that needs to be generated.
The user can upload the data in CSV or XLSX format and it will generate the draft07 schema for the same data.
Check out steps to create and use the Synthetic Data Generator component in a Pipeline workflow.
Drag and drop the Synthetic Data Generator Component to the Workflow Editor.
Click on the dragged Synthetic Data Generator component to get the component properties tabs.
Configure the Basic Information tab.
Select an Invocation type from the drop-down menu to confirm the running mode of the component. Select the Real-Time option from the drop-down menu.
Deployment Type: It displays the deployment type for the component. This field comes pre-selected.
Container Image Version: It displays the image version for the docker container. This field comes pre-selected.
Failover Event: Select a failover Event from the drop-down menu .
Batch Size (min 10): Provide maximum number of records to be processed in one execution cycle (Min limit for this field is 10.
Configure the following information:
Iteration: Number of iterations for producing the data.
Delay (sec): Delay between each iteration in seconds.
Batch Size: Number of data to be produced in each iteration.
Upload Sample File: Upload the file containing data. CSV and XLSX file formats are supported. Once the file is uploaded, the draft07 schema for the uploaded file will be generated in the Schema tab. The supported files are CSV, Excel, and JSON formats.
Schema: Draft07 schema will display under this tab in the editable format.
Upload Schema: The user can directly upload the draft07 schema in JSON format from here. Also, the user can directly paste the draft07 schema in the schema tab.
After doing all the configurations click the Save Component in Storage icon provided in the configuration panel to save the component.
A notification message appears to inform about the component configuration saved.
Please Note: Total number of generated data= Number of iterations * batch size
Please find a Sample Schema file given below for the users to explore the component.
Please Note: Weights can be given in order to handle the bias across the data generated:
The addition on weights should be exactly 1
"age": { "type": "string", "enum": ["Young", "Middle","Old"], "weights":[0.6,0.2,0.2]}
Type: "string"
Properties:
maxLength: Maximum length of the string.
minLength: Minimum length of the string.
enum: A list of values that the number can take.
weights: Weights for each value in the enum list.
format: Available formats include 'date', 'date-time', 'name', 'country', 'state', 'email', 'uri', and 'address'.
For 'date' and 'date-time' formats, the following properties can be set:
minimum: Minimum date or date-time value.
maximum: Maximum date or date-time value.
interval: For 'date' format, the interval is the number of days. For 'date-time' format, the interval is the time difference in seconds.
occurrence: Indicates how many times a date/date-time needs to repeat in the data. It should only be employed with the 'interval' and 'start' keyword.
A new format has been introduced for the string type: 'current_datetime'. This format generates records with the current date-time.
Type: "number"
Properties:
minimum: The minimum value for the number.
maximum: The maximum value for the number.
exclusiveMinimum: Indicates whether the minimum value is exclusive.
exclusiveMaximum: Indicates whether the maximum value is exclusive.
unique: Determines if the field should generate unique values (True/False).
start: Associated with unique values, this property determines the starting point for unique values.
enum: A list of values that the number can take.
weights: Weights for each value in the Enum list.
Type: "float"
Properties:
minimum: The minimum float value.
maximum: The maximum float value.
Please Note: Draft-07 schemas allow for the use of if-then-else conditions on fields, enabling complex validations and logical checks. Additionally, mathematical computations can be performed by specifying conditions within the schema.
Sample Draft-07 schema with if-then-else condition
Example: Here number3 value will be calculated based on
"$eval": "data.number1 + data.number2 * 2" condition.
Please Note : Conditional statement can also be applied on date and datetime columns using if-then-else. Please go through the below given schema for reference.
This above given JSON schema defines an object with two properties: "task_end_date" and "task_start_date", both of which are expected to be strings in date format. The schema includes a conditional validation rule using the "if-then" structure. If both "task_end_date" and "task_start_date" properties are present and in date format, then an additional constraint is applied. Specifically, the "task_end_date" must have a minimum value that is greater than or equal to the value of "task_start_date." This schema is useful for ensuring that task end dates are always set to a date that is on or after the task's start date when working with JSON data.
The Flatten JSON component takes complex JSON data structures and flattens them into a more simplified and tabular format.
All component configurations are classified broadly into 3 section
Meta Information
Follow the given steps in the demonstration to configure the Flatten JSON component.
Column Filter: Enter column name to read and optionally specify an alias name and column type from the drop-down menu.
Use Download Data and Upload File options to select the desired columns.
Upload File: The user can upload the existing system files (CSV, JSON) using the Upload File icon (file size must be less than 2 MB).
Download Data: Users can download the schema structure in JSON format by using the Download Data icon.
SQL transformer applies SQL operations to transform and manipulate data, providing flexibility and expressiveness in data transformations within a data pipeline.
The SQL component serves as a bridge between the extracted data and the desired transformed data, leveraging the power of SQL queries and database systems to enable efficient data processing and manipulation.
It also provides an option of using aggregation functions on the complete streaming data processed by the component. The user can use SQL transformations on Spark data frames with the help of this component.
All component configurations are classified broadly into the following sections:
Meta Information
Follow the given steps in the demonstration to configure the SQL transformation component.
Please Note: The schema file that can be uploaded here is a JSON spark schema.
Query Type: There are two options available under this field:
Batch Query: When this option is selected, then there is no need to upload a schema file.
Aggregate Query: When this option is selected, it is mandatory to upload the spark schema file in JSON format of the in-event data.
Schema File name: Upload the spark schema file in JSON format when the Aggregate query is selected in the query type field.
Table name: Provide the table name
Query: Write an SQL query in this field.
Selected Columns: select the column name from the table, and provide the Alias name and the desired data type for that column.
Please Note: When Usging Aggregation Mode
Data Writing:
When configured for Aggregate Query mode and connected to DB Sync, the SQL component will not write data to the DB Sync event.
Monitoring:
In Aggregate mode, monitoring details for the SQL component will not be available on the monitoring page.
Running Aggregate Queries Freshly:
If you set the SQL component to Aggregate Query mode and want to run it afresh, clearing the existing event data is recommended. To achieve this:
Copy the component.
Paste the copied component to create a fresh instance.
Running the copied component ensures the query runs without including aggregations from previous runs.
All component configurations are classified broadly into 3 section
Meta Information
Data Loss Protection component in pipeline used to protect or mask the incoming data by using the several techniques so that the loss of important data can be ignored.
Please follow the steps provided in the demonstration to configure the Data Loss Protection component.
Column name: Enter the column name whose data has to be protected.
Rule type: Select the rule type to hide the data. There are four types of rules available by which the data can be protected.
Redaction: Redaction is a data masking technique that enables you to mask data by removing or substituting all or part of the field value.
Masking: By selecting this method, the data can be masked by the given character. Once this option is selected, the following value needs to be given:
Masking character: Enter the character by which the data will be masked.
Characters to ignore: Enter the character which should be ignored while masking the data.
Type: Select either Full or Partial for masking the data.
Hashing: Hashing is using a special cryptographic function to transform one set of data into another of fixed length by using a mathematical process. Once this option is selected, then select the Hash type from the drop down to protect the data. There are 3 options available under the Hash type:
sha 256
sha 384
sha 512
Date generalization: For this rule, select a column which is having only date values. There are four(4) options under this rule:
Year
Month
Quarter
Week
Enrich your data from the master table/collection with few simple steps. This component helps users to enrich the incoming data from an in-Event by querying lookup table in the RDBMS and MongoDB reader components. All component configurations are classified broadly into the following sections:
Meta Information
Follow the steps given in the demonstration to configure the Enrichment component.
Please Note: If the selected driver is MongoDB, then write Mongo Aggregation query in Master table query field. Please refer the below given demonstration to configure the Enrichment component for MongoDB driver.
Drag and drop the Enrichment Component to the Workflow Editor.
Create two Events and drag them to the Workspace.
Connect the input event and the output event (The data in the input event can come from any Ingestion, Reader, or shared events).
Click the Enrichment Component to get the component properties tabs.
The Basic Information tab opens by default.
Select an Invocation type from the drop-down menu to confirm the running mode of the reader component. Select either Real-Time or Batch option from the drop-down menu.
Deployment Type: It displays the deployment type for the component. This field comes pre-selected.
Container Image Version: It displays the image version for the docker container. This field comes pre-selected.
Failover Event: Select a failover Event from the drop-down menu.
Batch Size: Provide the maximum number of records that you want to be processed in one execution cycle.
Open the Meta Information tab and fill in all the connection-specific details for the Enrichment Component.
Driver (*): Select Database type (MYSQL, MSSQL, Oracle, Postgres, MongoDB, ClickHouse, Snowflake)
Port (*): Host server port number
Host IP Address (*): IP Address
Username (*): Username for Authentication.
Password (*): Password for Authentication.
Database Name (*): Provide the Database name.
Enable SSL: Check this box to enable SSL for this components. Enable SSL feature in DB reader component will appear only for three(3) drivers: Mongodb, PostgreSQL and ClickHouse.
Certificate Folder: This option will appear when the Enable SSL field is checked-in. The user has to select the certificate folder from drop down which contains the files which has been uploaded to the admin settings. Please refer the below given images for the reference.
Table Name: Provide the table name to read the data.
Refresh rate in Secs: The value of this field has to be provided in seconds. It refreshes the master table and fetches the changes in every cycle of the given value. For example, if Refresh rate value is given as 3600 seconds, it will refresh the master table in every 3600 seconds and fetch the changes (Default value for this field is 3600 seconds).
Please Note: The Refresh rate value can be changed according to your use-case.
Connection Type: This option will show if the user selects MongoDB from the Driver field. A User can configure the MongoDB driver via two connection types (Standard or SRV) that are explained below:
Standard - Port field does appear with the Standard connection type option.
SRV - Port field does not appear with the SRV connection type option.
Conditions: Select conditions type (Remove or Blank option).
Master table query: Write a Spark SQL query to get the data from the table which has been mentioned in the Table name field.
Query: Enter a Spark SQL query to join the master table and the data coming from the previous event. Take inputDf as the table name for the previous event data.
The users can select some specific columns from the table to read data instead of selecting a complete table; this can be achieved via the Selected Columns section. Select the columns which you want to read and if you want to change the name of the column, then put that name in the alias name section otherwise keep the alias name the same as of column name and then select a Column Type from the drop-down menu.
or
Use the Download Data and Upload File options to select the desired columns.
Upload File: The user can upload the existing system files (CSV, JSON) using the Upload File icon (file size must be less than 2 MB).
Download Data (Schema): Users can download the schema structure in JSON format by using the Download Data icon.
After doing all the configurations click the Save Component in Storage icon provided in the reader configuration panel to save the component.
A notification message appears to inform about the component configuration success.
Please Note: The data of previous event is taken as inputDf as the table name in the query field of the Enrichment component as shown in the above query example.
The Pandas query component is designed to filter the data by applying pandas query on it.
All component configurations are classified broadly into the following sections:
Meta Information
Follow the steps given in the demonstration to configure the Pandas Query component.
This component helps the users to get data as per the entered query.
Drag and Drop the Pandas Query component to the Workflow Editor.
The transformation component requires an input event (to get the data) and sends the data to an output event.
Create two Events and drag them to the Workspace.
Connect the input event and the output event to the component (The data in the input event can come from any Ingestion, Reader, or shared events).
Click the Pandas Query component to get the component properties tabs.
The Basic Information tab opens by default while clicking the dragged component.
Select an Invocation type from the drop-down menu to confirm the running mode of the Pandas Query component. Select ‘Real-Time’ or ‘Batch’ from the drop-down menu.
Deployment Type: It displays the deployment type for the component. This field comes pre-selected.
Container Image Version: It displays the image version for the docker container. This field comes pre-selected.
Failover Event: Select a failover Event from the drop-down menu.
Batch Size (min 10): Provide the maximum number of records to be processed in one execution cycle (Min limit for this field is 10).
Open the Meta Information tab and provide the connection-specific details.
Enter a Pandas query to fetch data from in-event.
Provide the Table Name.
Sample Pandas Query:
In the above given Pandas Query, df is the table name which contains the data from previous event. It will fetch all the rows having gender= 'Female' and department= 'Sales'.
Click the Save Component in Storage icon to save the component properties.
A Notification message appears to notify the successful update of the component.
Please Note: The samples of Pandas Query are given below together with the SQL query for the same statements.
MongoDB Aggregation component allows users to group and transforms data from one or more MongoDB collections. The aggregation query pipeline consists of a series of stages that can be used to filter, group, project, sort, and transform data from MongoDB collections.
All component configurations are classified broadly into the following sections:
Meta Information
Please follow the given demonstration to configure the Mongo Aggregation component in a pipeline workflow.
Connection Type: Select the connection type from the drop-down:
Standard
SRV
Connection String
Host IP Address (*): Hadoop IP address of the host.
Port(*): Port number (It appears only with the Standard Connection Type).
Username(*): Provide username.
Password(*): Provide a valid password to access the MongoDB.
Database Name(*): Provide the name of the database from where you wish to read data.
Collection Name(*): Provide the name of the collection.
Additional Parameters: Provide the additional parameters to connect with MongoDB. This field is optional.
Enable SSL: Check this box to enable SSL for this components. MongoDB connection credentials will be different if this option is enabled.
Certificate Folder: This option will appear when the Enable SSL field is checked-in. The user has to select the certificate folder from drop down which contains the files which has been uploaded to the admin settings for connecting MongoDB with SSL. Please refer the below given images for the reference.
Script: Write the Mongo Aggregation script in this field.
Check out the given walk-through on how to pull the committed Python script from the VCS.
Navigate to the Python Script component configuration section and click on the Pull Script from VCS icon.
The Pull Script from VCS dialog box opens.
Select a specific version that you wish to Pull.
Click the Ok option.
A notification message appears to inform the user that the available versions of the script are getting pulled from the VCS.
The user gets another notification regarding the script getting pulled from the selected version by the user.
The final success notification message appears informing the users about the completion of the Pull action and the selected version of the script gets pulled.
Check out the given walk-through on how to push the committed Python script to the VCS.
Navigate to the Python Script component configuration section and click on the Push Script to VCS icon.
The Push Script to VCS dialog box opens.
Provide a commit message for the Script that you wish to push.
Click the Ok option.
A notification message appears informing the user that the Push to VCS has been started.
A success notification message appears informing the user that the Push to VCS action has been completed.
This component can be used for connecting it to a remote server/machine and running script files present there based on some events.
All component configurations are classified broadly into the following sections:
Meta Information
Please follow the given steps in the demonstration to use the Script Runner component in a pipeline workflow.
The Script Runner component is provided under the Scripting section of the Component pallet.
Drag and drop Script Runner Component to the Workflow Editor.
Open the dragged Script Runner component to open the component configuration tabs.
The Basic Information tab opens by default.
Invocation Type: Select an Invocation type from the drop-down menu to confirm the running mode of the script runner component. The supported invocation types are Real-Time and Batch.
Deployment Type: It displays the deployment type for the component. This field comes pre-selected.
Container Image Version: It displays the image version for the docker container. This field comes pre-selected.
Failover Event: Select a failover event from the drop-down menu.
Batch Size (min 10): Provide the maximum number of records to be processed in one execution cycle (Min limit for this field is 10).
Open the Meta Information tab and configure the required information.
Host: Host IP of the remote server/machine
Username: Username of the remote server/machine.
Port: Provide machine Port number.
Authentication: Select an authentication option from the drop-down menu.
Password: By selecting this option the user needs to pass the password.
PEM/PPK File: By selecting this option the user needs to pass the authentication file to connect to the server.
Script type: Choose the type of script file that You want to run out of SSH/ PERL/command options.
File path: Path of the file that is stored at the remote server.
File Name: The script file that you want to execute.
Event File Location: this is the location of the file sent through the file monitor (Non-mandatory).
Please Note: The displayed fields may vary based on the selected Authentication option.
Component Properties when the Authentication option is Password.
Component Properties when the Authentication option is PEM/PPK File.
Manual Arguments (Optional): These are the arguments to the parameter of the script that the user can provide manually.
Event Arguments (Optional): These are the arguments to the parameter coming from the previous event/Kafka topic.
Click the Save Component in Storage icon (A notification message appears to confirm the action completion).
The Script Runner component gets configured, and the notification message appears to inform the same.
Please Note: The component can connect to the remote machine using the details provided. It will pick the file from the location in that machine using the file name and file path respectively and finally execute the script after passing arguments (if any).
Limitations
a. It accepts only lists as input i.e. the in-event data should be a list.
b. It sends data on the out-event only when there is a print statement as output in the script if not there will be no data on the out-event.
c. The data produced from the script is of a list type.
The Python script component is designed to allow users to write their own custom Python scripts and run them in the pipeline. It also enables users to directly use scripts written in a DSLab notebook and run them in the pipeline.
Check out the given demonstrations to understand the configuration steps involved in the Python Script.
All component configurations are classified broadly into 3 section
Meta Information
Please Note: Do not provide 'test' as a component name or the component name should not start with 'test' in the component name field in the Meta information of the Python Script component. The word 'test' is used at the backend for some development processes.
Component Name: Provide a name to the component. Please note that the component name should be without space and special characters. Use the underscore symbol to show space in between words.
Start Function Name: It displays all the function names used in the python script in a drop-down menu. Select one function name with which you want to start.
In Event Data Type: The user will find two options here:
DataFrame
List of Dictionary
External Libraries: The user can provide some external python library in order to use them in the script. The user can enter multiple library names separated by commas.
Execution Type: Select the Type of Execution from the drop-down. There are two execution types supported:
Custom Script: The user can write their own custom python script in the Script field.
Script: The user can write their own custom python script in this field. Make sure the start should contain at least one function. The user can also validate the script by Clicking on Validate Script option in this field.
Start Function: Here, all the function names used in the script will be listed. Select the start function name to execute the python script.
Input Data: If any parameter has been given in the function, then the name of the parameter is provided as Key, and value of the parameters has to be provided as value in this field.
DSLab Script: In this execution type, the user can use the script which is exported from DSLab notebook. The user needs to provide the following information if selects this option as an Execution Type:
Project Name: Select the same Project using the drop-down menu where the Notebook has been created.
Script Name: This field will list the exported Notebook names which are exported from the Data Science Lab module to Data Pipeline.
Start Function: Here, all the function names used in the script will be listed. Select the start function name to execute the python script.
Input Data: If any parameter has been given in the function, then the name of the parameter is provided as Key, and value of the parameters has to be provided as value in this field.
Pull script from VCS: It allows the user to pull desired committed script from the VCS.
Push script to VCS: It allow the user to commit different versions of a script to the VCS.
Please Note: The below-given instructions should be followed while writing a Python script in the Data Pipeline:
If the script in the component is same as the committed script it won't commit again. You can push any number of different scripts by giving different commit message.
The version of the committed message will be listed as V1,V2, and so on.
The Python script needs to be written inside a valid Python function. E.g., The entire code body should be inside the proper indentation of the function (Use 4 spaces per indentation level).
The Python script should have at least one main function. Multiple functions are acceptable, and one function can call another function.
It should be written above the calling function body (if the called function is an outer function).
It should be written above the calling statement (if called function is an inner function)·
Spaces are the preferred indentation method.
Do not use 'type' as the function argument as it is a predefined keyword.
The code in the core Python distribution should always use UTF-8.
Single-quoted strings and double-quoted strings are considered the same in Python.
All the packages used in the function need to import explicitly before writing the function.
The Python script should return data in the form of a DataFrame or List only. The form of data should be defined while writing the function.
If the user needs to use some external library, the user needs to mention the library name in the external libraries field. If the user wants to use multiple external libraries, the library names should be separated by a comma.
If the user needs to pass some external input in your main function, then you can use the input data field. The key name should be the same according to the variable's name and value that is put as per the requirement.
This feature enables the user to send data directly to the Kafka Event or data sync event connected to the component. Below is the command to configure Custom Kafka Producer in the script:
Please Note:
If using @EVENT.OUTEVENT as an Event_name, the Python script component must be connected with the Kafka Event to send the data to the connected event.
If using a specific "Event_Name" in the custom Kafka producer, it is not mandatory to connect the Kafka event with the component. It will send data directly to that specified Kafka event.
The Python Script component must be used in real-time when using Custom Kafka Producer to send data to the Kafka topic. Using it in batch mode can result in improper functionality of the monitoring page and potential WebSocket issues.
The Python Component has a custom logger feature that allows users to write their own custom logs, which will be displayed in the logs panel. Please refer to the code below for the custom logger:
Please Note: Using this feature, the user cannot get the logs which contain environment variables.
Sample Python code to produce data using custom producer and custom logger:
Here,
df: Previous event data in the form of List or DataFrame connected to the Python component.
key1, key2, key3: Any parameter passed to the function from the Input Data section of the metadata info of the Python script component.
log_obj.info(): It is for custom logging and takes a string message as input.
kaf_obj.kafka_produce(): It is for the custom Kafka producer and takes the following parameters:
df: Data to produce – pandas.DataFrame and List of Dict types are supported.
Event name: Any Kafka event name in string format. If @EVENT.OUTEVENT is given, it sends data to the connected out event. If @EVENT.FAILEVENT is given, it sends the data to the connected failover event with the Python script component.
Any Failed Message: A message in string format can be given to append to the output data. The same message will be appended to all rows of data (this field is optional).
Please Note: If the data is produced to a Failover Event using custom Kafka Producer then that data will not be considered as failed data and it will not be listed on the Failure Analysis page as failed data and it will be reflected in green color as processed records on the Data Metrics page.
The Custom Python Script transform component supports 3 types of scripts in the Data Pipeline.
1. As Reader Component: If you don’t have any in Event then you can use no argument function. For Example,
2. As Transformation Component: If you have data to execute some operation, then use the first argument as data or a list of dictionaries. For Example,
Here the df holds the data coming from the previous event as argument to the pram of the method.
3. Custom Argument with Data: If there is a custom argument with the data-frame i.e. the data is coming from the previous event and we have passed the custom argument to the parameter of the function. here df will hold the data from the previous event and the second param: arg range can be given in the input data section of the component.
Please Note:
The Custom Kafka producer in batch mode will not trigger next component, if the actual Kafka event name is given in place of @EVENT.OUTEVENT/@EVENT.FAILEVENT
The REST API component provides a way for applications to interact with a web-based service through a set of predefined operations or HTTP methods, such as GET, POST, PUT,PATCH, DELETE etc.
All component configurations are classified broadly into 3 section
Meta Information
Follow the steps given in the demonstration to configure the Rest API component.
Source Name: Provide the name of the source you would like to reference.
URL: It is a unique identifier that specifies the location of a resource on the web.
Request Type: The Request Type refers to the HTTP method or operation used to interact with a web service or resource. The most common HTTP methods used in REST APIs are:
GET: It retrieves data from a resource.
POST: It submits new data to a resource.
PUT: It updates existing data in a resource.
DELETE: It deletes data from a resource.
PATCH: It is to partially update a resource or entity on the server.
Query Params: These are additional parameters that can be passed along with the URL of a request to modify the data returned by an API endpoint
Headers: It refer to the additional information sent in the HTTP request or response along with the actual data.
Authorization: It refers to the process of verifying that a user or application has the necessary permissions to access a particular resource or perform a particular action.
Iteration(s): It refers to the process of retrieving a collection of resources from a web service in a paginated manner, where each page contains a subset of the overall resource collection.
Delay(in sec): It refers to a period of time between when a request is made by a client and when a response is received from the server.
Body: It refers to the data or payload of a request or response message.
Data Preparation component allows to run data preparation scripts on selected datasets. These datasets can be created from sources such as sandbox or by creating them using data connector. With Data Preparation, you can easily create data preparation with a single click. This automates common data cleaning and transformation tasks, such as filtering, aggregation, mapping, and joining.
All component configurations are classified broadly into 3 section
Meta Information
Follow the steps given in the demonstration to configure the Data Preparation component.
Select the Data Preparation from the Transformations group and drag it to the Pipeline Editor Workspace.
The user needs to connect the Data Preparation component with an In-Event and Out Event to create a Workflow as displayed below:
The following two options provided under the Data Center Type field:
Data Set
Data Sandbox
Please Note: Based on the selected option for the Data Center Type field the configuration fields will appear for the Meta Information tab.
Navigate to the Meta Information tab.
Data Center Type: Select Data Set as the Data Center Type.
Data Set Name: Select a Data Set Name using the drop-down menu.
Preparation(s): The available Data Preparation will list under the Preparation(s) field for the selected Data Set. Select a Preparation by using the checkbox. Once the preparation is selected, it will display the list of transformation done in that selected preparation. Please see the below given image for reference.
Navigate to the Meta Information tab.
Data Center Type: Select Data Sandbox as the Data Center Type.
Data Sandbox Name: Select a Data Sandbox Name using the drop-down menu.
Preparation(s): The available Data Preparation will list under the Preparation(s) field for the selected Data Sandbox. Select a Preparation by using the checkbox. Once the preparation is selected, it will display the list of transformation done in that selected preparation. Please see the below given image for reference.
Please Note:
Once Meta Information is configured, the same transformation will be applied to the in-Event data which has been done while creating the Data Preparation. To ensure the same transformation is applied to the in-event data, the user must have used the same source data during the previous event where the preparation was conducted.
If the file is uploaded to the Data Sandbox by an Admin user, it will not be visible or listed in the Sandbox Name field of the Meta information for the Data Preparation component to non-admin users.
A success notification message appears when the component gets saved.
Save and Run the Pipeline workflow.
Please Note: Once the Pipeline workflow gets saved and activated, the related component logs will appear under the Logs panel. The Preview tab will come for the concerned component displaying the preview of the data. The schema preview can be accessed under the Preview Schema tab.
Script: The Exported script appears under this space. The user can also validate the script by Clicking on Validate Script option in this field. For more information to export the script from DSLab module, please refer the following link: .
It is possible for a Data Pipeline user to . The user can Push a version of the Python script to VCS and Pull a version of the Python script from VCS.
Click the Save Component in Storage icon.
SQL Query
Pandas Query
select id from airports where ident = 'KLAX'
airports [airports.ident == 'KLAX'].id
select * from airport_freq where airport_ident = 'KLAX' order by type
airports[(airports.iso_region == 'US-CA') & (airports.type == 'seaplane_base')]
select type, count(*) from airports where iso_country = 'US' group by type having count(*) > 1000 order by count(*) desc
airports[airports.iso_country == 'US'].groupby('type').filter(lambda g: len(g) > 1000).groupby('type').size().sort_values(ascending=False)
Data Pipeline module provides two types of scripting components to facilitate the users.
These components facilitate user notification on various channels like Teams, Slack and email based on their preferences. Notifications can be delivered for success, failure, or other relevant events.
Check out the given demonstrations to understand the configuration steps involved in the PySpark Script.
Please Note: Do not provide 'test' as a component name or the component name should not start with 'test' in the component name field in the Meta information of the Python Script component. The word 'test' is used at the backend for some development processes.
Component Name: Provide a name to the component. Please note that the component name should be without space and special characters. Use the underscore symbol to show space between words.
Start Function Name: It displays all the function names used in the PySpark script in a drop-down menu. Select one function name with which you want to start.
In Event Data Type: The user will find two options here:
DataFrame
List of Dictionary
External Libraries: The user can provide external PySpark libraries in the script. The user can enter multiple library names separated by commas.
Execution Type: Select the Type of Execution from the drop-down. There are two execution types supported:
Custom Script: The users can write their custom PySpark script in the Script field.
Script: The user can write their custom PySpark script in this field. Make sure the start should contain at least one function. The user can also validate the script by clicking the Validate Script option in this field.
Start Function: Here, all the function names used in the script will be listed. Select the start function name to execute the PySpark script.
Input Data: If any parameter has been given in the function, then the parameter's name is provided as Key, and the value of the parameters has to be provided as a value in this field.
DSLab Script: In this execution type, the user can use the script exported from the DSLab notebook. The user needs to provide the following information if this option is selected as an Execution Type:
Project Name: Select the same Project using the drop-down menu where the Notebook has been created.
Script Name: This field will list the exported Notebook names from the Data Science Lab module to the Data Pipeline.
Start Function: All the function names used in the script will be listed here. Select the start function name to execute the PySpark script.
Script: The Exported script appears under this space. The user can also validate the script by Clicking on the Validate Script option in this field. For more information about exporting the script from the DSLab module, please refer to the following link: Exporting a Script from DSLab.
Input Data: If any parameter has been given in the function, then the parameter's name is provided as Key, and the value of the parameters has to be provided as a value in this field.
Pull script from VCS: It allows the user to pull the desired committed script from the VCS.
Push script to VCS: It allows the user to commit different versions of a script to the VCS.
The Job Trigger component is designed to facilitate users in triggering the Python(On demand) Job through the pipeline. To configure this, users need to set up their Python (On demand) job name in the meta-information of the Job Trigger component within the pipeline. The in-event data of the Job Trigger component will then be utilized as a payload in the Python(On demand) Job.
Please go through the below given demonstration to configure Job Trigger component in the pipeline.
Create a pipeline that generates meaningful data to be sent to the out event, which will serve as the payload for the Python (On demand) job.
Connect the Job Trigger component to the event that holds the data to be used as payload in the Python (On demand) job.
Open the meta-information of the Job Trigger component and select the Python(On demand) job from the drop-down menu that needs to be activated by the Job Trigger component.
Please Note: The data from the previously connected event will be passed as JSON objects within a JSON Array and used as the payload for the Python (On demand) Job. For more information on the Python(On demand) job and its functionality, please refer to this link: Python (On demand) Job.
Schema Validator component lets the users create validation rules for their fields, such as allowed data types, value ranges, and nullability.
The Schema Validator component has two outputs. The first one is to pass the Schema Validated records successfully and the second one is to pass the Bad Record Event.
Check out the given demonstration to configure the Schema Validator component.
All component configurations are classified broadly into the following sections:
Meta Information
Please Note: Schema Validator will only work for flat JSON data, it will not work on array/list or nested JSON data.
Access the Schema Validator component from the Ingestion component.
Drag the Schema Validator component to the Pipeline workflow canvas and connect it with the required components.
Click the Schema Validator component.
It displays the component configuration tabs below:
Invocation Type: The user can select any one invocation type from the given choices.
Real-Time: If the Real-Time option is selected in invocation type, the component never goes down when the pipeline is active. This is for the situations when you want to keep the component ready all the time to consume data.
Batch-Size: Is Batch is selected as invocation type, the component needs a trigger to initiate the process from the previous event. Once the process of the component is finished and there are no new Events to process, the component goes down.
Batch Size: The Pipeline components process the data in batches. This batch size is given to define the maximum number of records that you want to process in a single cycle of operation. This is really helpful if you want to control the number of records being processed by the component if the unit record size is huge.
Failover Event: The Failover Event can be mapped through the given field. If the component gets failed due to any glitch, all the needed data to perform the operation goes to this Event with the failure cause and timestamp.
Intelligent Scaling: By enabling this option helps the component to scale up to the max number of instances by automatically reducing the data processing. This feature detects the need to scale up the components in case of higher data traffic.
Schema File Name: This specifies the name of uploaded Schema file.
Choose File: This option allows you to upload your schema file.
View Schema: This option allows you to view uploaded schema file.
Remove File: This option allows you to remove uploaded schema file.
Mode: Two choices are provided under the Meta Information of the Schema Validator to choose a mode:
Strict: Strict mode intends to prevent any unexpected behaviors or silently ignored mistakes in user schemas. It does not change any validation results compared with the specification, but it makes some schemas invalid and throws exception or logs warning (with strict: "log" option) in case any restriction is violated and sends them to bad record event.
Allow Schema Drift: Schema drift is the case where the used data sources often change metadata. Fields, columns, types etc. can be added, removed, or changed on the fly. It allows slight changes in the data schema.
Bad Records Event: The records that are rejected by the Schema Validator will automatically go to the Bad Records Event.
Please Note:
The Event component connected to the second node of the Schema Validator component automatically gets mapped as the Bad record Event in the workflow.
The user will not be able to copy and paste Schema Validator component in the pipeline as the Copy option has been disabled for Schema Validator.
Future Plan: The Schema Validator component will be able to process nested JSON data.
Alert component is designed to send alerts to Microsoft Teams and Slack channels based on incoming records from an event source.
All component configurations are classified broadly into 3 section.
Meta Information
Please go through the below given walk through to configure alert component.
Webhook URL: Provide the Webhook URL of the selected channel group where the Alert message needs to be sent.
Threshold: This field specifies the number of records required from in-event to send an alert to the selected channel group. The component will send an alert to the channel group only after reaching this threshold value. For example, if the threshold value is 100, it will send an alert to the selected channel group once it receives 100 records from the in-event.
Time Interval: This is the time gap in seconds between sending alerts. It is calculated as the difference between the current time and the time when the last alert was sent.
Channel: Select the channel from the drop-down. There are two channels available:
Teams
Slack
Type: Message Card. (This field will be Pre-filled)
Theme Color: Enter the Hexadecimal color code for ribbon color in the selected channel. Please refer the image given at the bottom of this page for the reference.
Sections: In this tab, the following fields are there:
Activity Title: This is the title of the alert which has to be to sent on the Teams channel. Enter the Activity Title as per the requirement.
Activity Subtitle: Enter the Activity Subtitle. Please refer the image given at the bottom of this page for the reference.
Text: Enter the text message which should be sent along with Alert.
In this section, provide the Name (as per your choice) and the Value. The Value can be either '@data.column_name,' where 'column_name' is the name of the column in the in-event data whose value will be sent along with the alert message, or a custom message of your own. Please refer to the image at the bottom of this page for reference.
Add New Facts: The user can add more facts by clicking on this option.
Add New Section: The user can add more Sections by clicking on this option.
Sample Hexadecimal Color code which can be used in Alerts Component
Webhook URL: Provide the Webhook URL of the selected channel group where the Alert message needs to be sent.
Threshold: This field specifies the number of records required from in-event to send an alert to the selected channel group. The component will send an alert to the channel group only after reaching this threshold value. For example, if the threshold value is 100, it will send an alert to the selected channel group once it receives 100 records from the in-event.
Time Interval: This is the time gap in seconds between sending alerts. It is calculated as the difference between the current time and the time when the last alert was sent.
Attachments: In this tab, the following fields are there:
Title: This is the title of the alert which has to be to sent on the selected channel. Enter the Activity Title as per the requirement.
Color: Enter the Hexadecimal color code for ribbon color in the Slack channel. Please refer the image given at the bottom of this page for the reference.
Text: Enter the text message which should be sent along with Alert.
Fields: In this tab, the following fields are there:
Title: The "Title" is a bold, prominent text that serves as the header for a section or block of content within an attachment. It is used to provide context or a brief summary of the information presented in that section. Titles are usually displayed at the top of an attachment.
Value: The "Value" is the main content of a section or block in an attachment. It contains the detailed information related to the title. Values can include text, numbers, links, or other types of data. They are often displayed below the title and provide the core information for a given section.
Short: The "Short" parameter is a Boolean value (typically "true" or "false") that determines whether the title and value should be displayed in a compact or short format. When set to "true," the title and value are displayed side by side, making the content more concise and readable. When set to "false," the title and value are typically displayed in separate lines, providing a more detailed view.
Footer: The "Footer" typically refers to additional information or content appended at the end of a message in a Slack channel. This can include details like a signature, contact information, or any other supplementary information that you want to include with your message. Footers are often used to provide context or additional context to the message content.
Timestamp: The "Timestamp" in a Slack channel usually represents the date and time when a message was posted. It helps users understand when a message was sent. Enter the Timestamp value in seconds. For example. the timestamp value for October 17, 2023 will be 1697540874.
Footer Icon: In Slack, the footer icon refers to an icon or image that is displayed at the bottom of a message or attachment. The footer icon can be a company logo, an application icon, or any other image that represents the entity responsible for the message. Enter image URL as the value of Footer icon.
To set the Footer icon in Slack, follow these steps:
Go to the desired image that has to be used as the footer icon.
Right-click on the image.
Select 'Copy image address' to get the image URL.
Now, the obtained image URL can be used as the value for the footer icon in Slack.
Sample image URL for Footer icon:
Please Note: The second alert will be sent only if it satisfies both the threshold value and the time interval value. The Time Interval value is calculated as the difference between the current time and the time when the last sent alert.
A task can be scheduled to automatically execute at a given scheduler time.
All component configurations are classified broadly into the following sections:
Meta Information
Check out the walk-through on Scheduler to get an idea on how to configure & use it in a workflow.
All component configurations are classified broadly into the following sections:
Drag and drop the Scheduler component to the Workflow Editor.
Connect it with a reader or Data Loading component (Input event).
Click on the Scheduler component to get the configuration details.
The Basic Information tab opens by default.
Select an Invocation type from the drop-down menu to confirm the running mode of the reader component. The supported invocation type is Real-Time.
Deployment Type: It displays the deployment type for the component. This field comes pre-selected.
Container Image Version: It displays the image version for the docker container. This field comes pre-selected.
Failover Event: Select a failover event from the drop-down menu.
Batch Size (min 10): Provide the maximum number of records to be processed in one execution cycle (Min limit for this field is 10).
Open the Meta Information tab and provide the required details for the same.
Scheduler Name: Provide a name for the Scheduler.
Payload: Provide the Payload value in the predefined format.
Timezone: Select the timezone from the drop-down as per requirement.
Scheduler Time: Time generated based on user selection in Cron generator.
Cron Generator: A cron generator generates cron expression which is a string that represents a set of times at which a task will be executed. The user can set any time using the given units of time from Minutes to Year.
Please Note:
The different values for various time units will be as given below:
Hours(0-23)
Minute(0-59)
Seconds(0-59)
Months in words(January-December)
Months in digit(1-12)
Week day(Monday-Sunday)
Date of months(1-31) The Date of the months for the February month is up to 29.
The supported units of time for generating a Cron expression are as given below:
WEEKLY - Scheduler can be scheduled for every given day of the week at specified time.
MONTHLY - Scheduler can be scheduled at every given date of a given month and specified time/given time interval.
During the nearest Weekday: By enabling this option the Pipeline will be scheduled during the nearest weekday.
We have another option where scheduler can be scheduled at first-last occurrence of day (Monday-Sunday) starting at given month at a specified time and ending at given count of months. E.g., Second Monday of every month starting March and continuing for 3 months(count).
YEARLY - Scheduler can be scheduled for every given day of the any month at specified time which will execute only every year.
During the nearest Weekday: By enabling this option the Pipeline will be scheduled during the nearest weekday.
The user has another option where scheduler can be scheduled at first-last occurence of day (Monday-Sunday) of a given month at a specified time.
The scheduled pipelines are listed together with the scheduler details. It displays the meta-information filled in the scheduler component for the respective pipeline. The page also contains information on how many times the pipeline has been triggered and when the next time the scheduled component will get deployed.
Check out the given walk-through on the Scheduler List Page.
All the scheduled workflows get displayed on the Scheduler List Page of the Data Pipeline.
The user can access the Scheduler icon from the left-side panel of the Pipeline landing page.
By clicking on a Pipeline the right-side panel describes how many times the Pipeline has been triggered.
The user gets redirected to the concerned pipeline by clicking the Pipeline name from the Scheduler List page.
Email component is designed to send email in a specified format to one or multiple receivers.
All component configurations are classified broadly into 3 section
Meta Information
Follow the given steps in the demonstration to configure the Email component.
Subject: Specify subject of the email.
HTML Editor: Specify body of the email. Attachment: Whether to send in-event data as attachment(Yes/No).
Receivers: Specify the receivers email address(If more than one provide emails separated by comma).
TLS: Checkbox to enable or disable Transport Layer Security.
Email User Name: The email username that has been configured with the SMTP server.
Encryption Type: Select the encryption method from the dropdown.
SSL
TLS
None
Email Password: Provide the password for the email that has been configured in SMTP server.
Enable SSL Email From: Email address of the sender that has been configured with the SMTP server.
Email Port: Provide SMTP port.
Disable Email Sending: Option to disable the sending of the email.
Email Input: These selected input field will go to out-event and these can be used in email body.
Please Note: The below given image represents a model email sent to the configured receivers.
{'Emp_id':248, 'Age':20, 'city': 'Mumbai, 'Dept':'Data_Science'}
{'Id':248, 'name': 'smith', 'marks':[80,85,70,90,91], 'Dept':{'dept_id':20,'dept_name':'data_science','role':'software_engineer'}}


