Loading...
Loading...
Loading...
Loading...
Loading...
Loading...
Loading...
Loading...
Loading...
Loading...
Loading...
Loading...
Loading...
Loading...
SFTP (Secure File Transfer Protocol) Monitor is used to monitor and manage files transfer over SFTP servers. It is designed to keep track of file transfers over SFTP.
All component configurations are classified broadly into the following sections:
Meta Information
Drag and Drop the SFTP Monitor consumer component which is inside the consumer section of the system component part to the Workflow Editor.
Click the dragged ingestion component to get the component properties tabs.
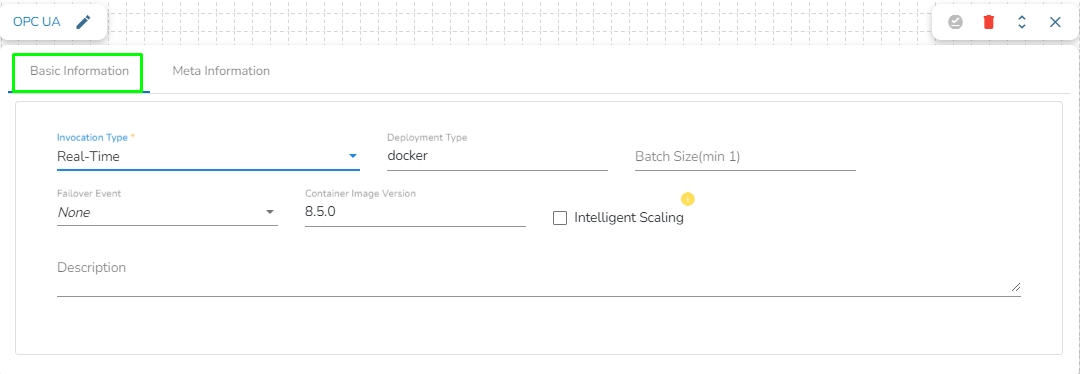
The Basic Information Tab is the default tab for the component.
Select the Invocation Type (at present only the Real-Time option is provided).
Deployment Type: It comes preselected based on the component.
Container Image Version: It comes preselected based on the component.
Failover Event: Select a failover event from the drop-down menu.
Batch Size (min 10): Provide the maximum number of records to be processed in one execution cycle (Min limit for this field is 10).
Configure the Meta Information tab for the dragged SFTP Monitor component.
Host: Broker IP or URL
Username: If authentication is required then give username
Port: Provide the Port number
Authentication: Select an authentication option using the drop-down list.
Password: Provide a password to authenticate SFTP Monitor.
PEM/PPK File: Choose a file to authenticate the SFTP Monitor component. The user needs to upload a file if this authentication option has been selected.
Directory Path: Fill the monitor folder path using forward-slash (/). E.g., /home/monitor
Copy Directory Path: Fill in the copy folder name where you want to copy the uploaded file. E.g., /home/monitor_copy
Please Note: Don't use a nested directory structure in the directory path and copy directory path. Else the component won't behave in an expected manner.
Don't use the dirpath and copy-path as follows: dirpath: home/monitor/datacopy-dir:home/monitor/data/copy_data
Channel: Select a channel option from the drop-down menu (the supported channel is SFTP).
Click the Save Component in Storage icon to save configured details of the SFTP Monitor component.
A notification message appears to confirm the same.
Please Note:
a. The SFTP Monitor component monitors the file coming to the monitored path and copies the file in the Copy Path location for SFTP Reader to read.
b. The SFTP Monitor component requires an Event to send output.
c. The SFTP Monitor send the file name to the out event along with File size, last modified time and ingestion time (Refer the below image).
d. Only one SFTP monitor will read and move the file if multiple monitors are set up to monitor the same file path at the same time.
These are the real-time / Streaming component that ingests data or monitor for change in data objects from different sources to the pipeline.
Sqoop Executer is a tool designed to efficiently transfer data between Hadoop (Hive/HDFS) and structured data stores such as relational databases (e.g., MySQL, Oracle, SQL Server).
All component configurations are classified broadly into the following sections:
Meta Information
It is the default tab to open for the component while configuring it.
Invocation Type: Select an invocation mode out of ‘Real-Time’ or ‘Batch’ using the drop-down menu.
Deployment Type: It displays the deployment type for the reader component. This field comes pre-selected.
Container Image Version: It displays the image version for the docker container. This field comes pre-selected.
Failover Event: Select a failover Event from the drop-down menu.
Batch Size (min 10): Provide the maximum number of records to be processed in one execution cycle (Min limit for this field is 10).
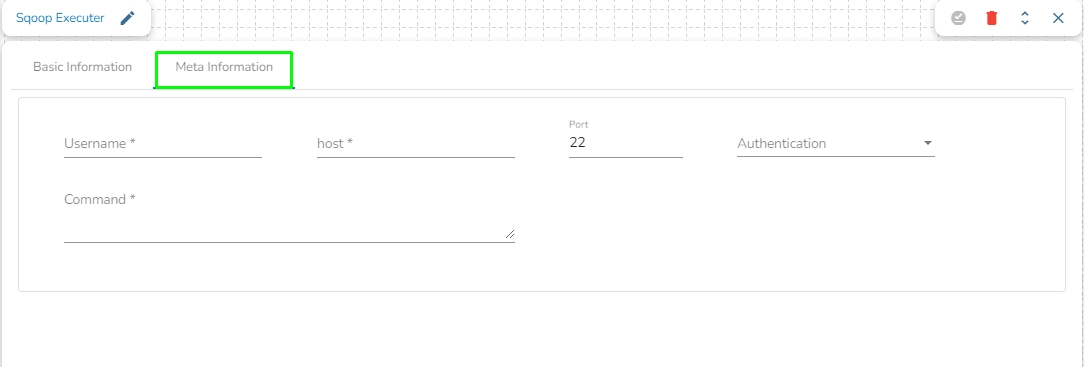
Username: Enter the username for connecting to a relational database.
Host: Provide a host or IP address of the machine where your relational database server is running.
Port: Provide a Port number (the default number for these fields is 22).
Authentication: Select an authentication type from the drop-down:
Password: Enter the password.
PEM/PPK File: choose a file and provide the file name if the user selects this authentication option.
Command: Enter the relevant Sqoop command. In Apache Sqoop, a command is a specific action or operation that you perform using the Sqoop tool. Sqoop provides a set of commands to facilitate the transfer of data between Hadoop (or more generally, a Hadoop ecosystem component) and a relational database. These commands are used in Sqoop command-line operations to interact with databases, import data, export data, and perform various data transfer tasks.
Some of the common Sqoop commands include:
Import command: This command is used to import data from a relational database into Hadoop. You can specify source and target tables, database connection details, and various import options.
Export Command: This command is used to export data from Hadoop to a relational database. You can specify source and target tables, database connection details, and export options.
Eval Command: This command allows you to evaluate SQL queries and expressions without importing or exporting data. It's useful for testing SQL queries before running import/export commands.
List Databases Command: This command lists the available databases on the source database server.
OPC UA (OPC Unified Architecture) is a communication protocol and standard used for collecting and transmitting data from industrial devices and systems to a data processing or analytics platform. OPC UA is commonly employed in data pipelines for handling data from industrial and manufacturing environments, making it an integral part of industrial data pipelines.
All component configurations are classified broadly into the following sections:
Meta Information
It is the default tab to open for the component while configuring it.
Invocation Type: Select an invocation mode out of ‘Real-Time’ or ‘Batch’ using the drop-down menu.
Deployment Type: It displays the deployment type for the reader component. This field comes pre-selected.
Container Image Version: It displays the image version for the docker container. This field comes pre-selected.
Failover Event: Select a failover Event from the drop-down menu.
Batch Size (min 10): Provide the maximum number of records to be processed in one execution cycle (Min limit for this field is 10).
URL: Provide URL link. In OPC UA (OPC Unified Architecture), a URL (Uniform Resource Locator) is used to specify the address or location of an OPC UA server or endpoint. URLs in OPC UA are typically used to establish connections to servers and access the services provided by those servers.
Message Security Mode: Select a message security mode from the drop-down menu (The supported options are ‘Sign’ and ‘SignAndEncrypt’).
Security Policy: Select a policy using the drop-down menu. Three types of security policies are supported:
Basic256: Basic256 is a security profile that provides encryption and signature capabilities for OPC UA communication. It uses a 256-bit encryption key. All messages exchanged between clients and servers are encrypted using a 256-bit encryption key, providing data confidentiality. Messages are digitally signed to ensure data integrity and authenticity. Signature algorithms ensure that the message has not been tampered with during transmission. Basic256 uses symmetric encryption, meaning both parties share the same secret key for encryption and decryption.
Basic256Sha256: Basic256Sha256 is an enhanced security profile that builds upon the features of Basic256. It offers stronger security by using SHA-256 cryptographic algorithms for key generation and message digests.
Basic128Rsa15: Basic128Rsa15 is a security profile that uses 128-bit encryption and RSA-15 key exchange. It is considered less secure compared to Basic256 and Basic256Sha256. Basic128Rsa15 uses 128-bit encryption for data confidentiality. It relies on the RSA-15 key exchange mechanism, which is considered less secure than newer RSA and elliptic curve methods.
Certificate File Name: This name gets reflected based on the Choose File option provided for the Certificate file.
Choose File: Browse a certificate file by using this option.
PEM File Name: This name gets reflected based on the Choose File option provided for the PEM file.
Choose File: Browse a PEM file by using this option.
Source Node: Enter the source node. The "Source Node" refers to the entity or component within the OPC UA server that is the source or originator of an event or notification. It represents the object or node that generates an event when a specific condition or state change occurs.
Event Node: Enter the event node. The "Event Node" refers to the specific node in the OPC UA AddressSpace that represents an event or notification that can be subscribed to by OPC UA clients. It is a node that defines the structure and properties of the event, including the event's name, severity, and other attributes.
MQTT(Message Queuing Telemetry Transport) is a lightweight, publish-subscribe, machine to machine network protocol for message queue/message queuing service. It is designed for connections with remote locations that have devices with resource constraints or limited network bandwidth, such as in the Internet of Things.
All component configurations are classified broadly into the following sections:
Meta Information
Follow the given demonstration to configure the MQTT component.
Host IP Address: Provide the IP Address of MQTT broker.
Username: Enter the username.
Port: Enter the port for the given IP address.
Authenticator: There are 2 options in it, select any one to authenticate.
Password: Enter the password to authenticate.
PEM/PPK File: Upload the PEM/PPK File to authenticate.
Quality of service(QoS): Enter the values either 0, 1 or 2. The Quality of Service (QoS) level is an agreement between the sender of a message and the receiver of a message that defines the guarantee of delivery for a specific message. There are 3 QoS levels in MQTT:
At most once (0): The minimal QoS level is zero. This service level guarantees a best-effort delivery. There is no guarantee of delivery. The recipient does not acknowledge receipt of the message and the message is not stored and re-transmitted by the sender.
At least once (1): QoS level 1 guarantees that a message is delivered at least one time to the receiver. The sender stores the message until it gets a PUBACK packet from the receiver that acknowledges receipt of the message.
Exactly once (2): QoS 2 is the highest level of service in MQTT. This level guarantees that each message is received only once by the intended recipients. QoS 2 is the safest and slowest quality of service level. The guarantee is provided by at least two request/response flows (a four-part handshake) between the sender and the receiver. The sender and receiver use the packet identifier of the original PUBLISH message to coordinate delivery of the message.
MQTT topic: Enter the name of the MQTT topic from where the messages have been published and to which the messages have to be consumed.
Please Note: Kindly perform the following tasks to run a Pipeline workflow with the MQTT consumer component:
After configuring the component click the Save Component in Storage option for the component.
Update the Pipeline workflow and activate the pipeline to see the MQTT consumer working in a Pipeline Workflow. The user can get details through the Logs panel when the Pipeline workflow starts loading data.
Video stream consumer is designed to consume .mp4 video from realtime source or stored video in some SFTP location in form of frames.
All component configurations are classified broadly into the following sections:
Meta Information
Please follow the given demonstration to configure the Video Stream Consumer component.
Please Note:
Video Stream component supports only .mp4 file format. It reads/consumes video frame by frame.
The Testing Pipeline functionality and Data Metrices option (from Monitoring Pipeline functionality) are not available for this component.
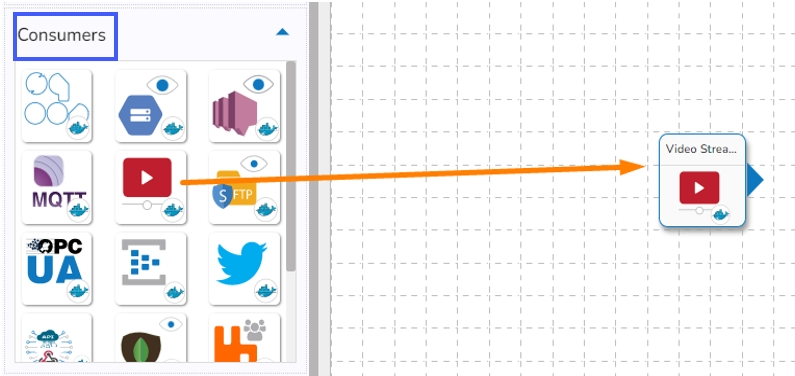
Drag & drop the Video Stream Consumer component to the Workflow Editor.
Click the dragged Video Stream Consumer component to open the component properties tabs.
It is the default tab to open for the component.
Invocation Type: Select an Invocation type from the drop-down menu to confirm the running mode of the reader component. Select ‘Real-Time’ or ‘Batch’ from the drop-down menu.
Deployment Type: It displays the deployment type for the component. This field comes pre-selected.
Batch Size (min 10): Provide the maximum number of records to be processed in one execution cycle (Min limit for this field is 10).
Failover Event: Select a failover Event from the drop-down menu.
Container Image Version: It displays the image version for the docker container. This field comes pre-selected.
Description: Description of the component (It is optional).
Please Note: If the selected Invocation Type option is Batch, then, Grace Period (in sec)* field appears to provide the grace period for component to go down gracefully after that time.
Selecting Real-time as the Invocation Type option will display the Intelligent Scaling option.
Select the Meta Information tab and provide the mandatory fields to configure the dragged Video Stream Consumer component.
Host IP Address (*)- Provide IP or URL
The input in the Host IP Address field in the Meta Information tab changes based on the selection of Channel. There are two options available:
SFTP: It allows us to consume stored videos from SFTP location. Provide SFTP connection details.
URL: It allows us to consume live data from different sources such as cameras. We can provide the connection details for live video coming.
Username (*)- Provide username
Port (*)- Provide Port number
Authentication- Select any one authentication option out of Password or PEM PPK File
Reader Path (*)- Provide reader path
Channel (*)- The supported channels are SFTP and URL
Resolution (*)- Select an option defining the video resolution out of the given options.
Frame Rate – Provide rate of frames to be consumed.
Please Note: The fields for the Meta Information tab change based on the selection of the Authentication option.
While using authentication option as Password it adds a password column in the Meta information.
While choosing the PEM/PPK File authentication option, the user needs to select a file using the Choose File option.
Please Note: SFTP uses IP in the Host IP Address and URL one uses URL in Host IP Address.
Click the Save Component in Storage icon for the Video Stream Consumer component.
A message appears to notify that the component properties are saved.
The Video Stream Consumer component gets configured to pass the data in the Pipeline Workflow.
Please Note: The Video Stream Consumer supports only the Video URL.
The GCS Monitor continuously monitors a specific folder. When a new file is detected in the monitored folder, the GCS Monitor reads the file's name and triggers an event. Subsequently, the GCS Monitor copies the detected file to a designated location as defined and then removes it from the monitored folder. This process is repeated for each file that is found.
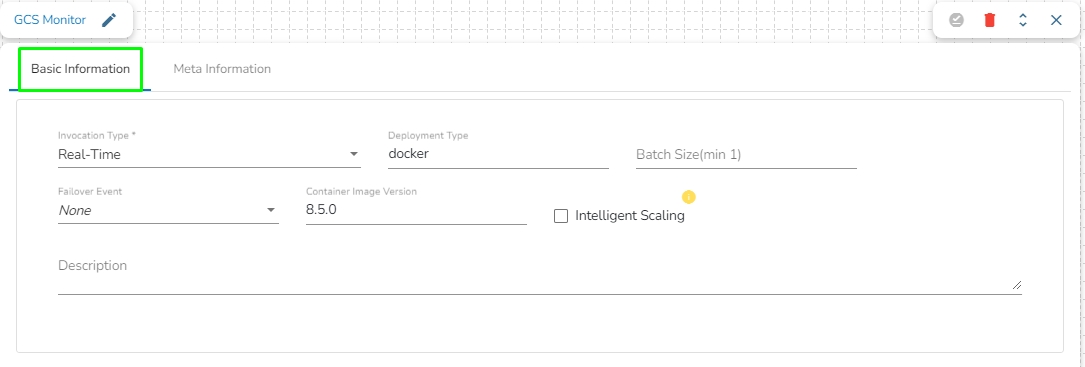
It is the default tab to open for the component while configuring it.
Invocation Type: Select an invocation mode as Real-Time.
Deployment Type: It displays the deployment type for the reader component. This field comes pre-selected.
Container Image Version: It displays the image version for the docker container. This field comes pre-selected.
Failover Event: Select a failover Event from the drop-down menu.
Batch Size (min 10): Provide the maximum number of records to be processed in one execution cycle (Min limit for this field is 10).
Bucket Name: Enter the source bucket name.
Directory Path: Fill in the monitor folder path using a forward-slash (/). For example, "monitor/".
Copy Directory Path: Specify the copy folder name where you want to copy the uploaded file. For example, "monitor_copy/".
Choose File: Upload a Service Account Key(s) file.
File Name: After the Service Account Key file is uploaded, the file name is auto-generated based on the uploaded file.
Copy Bucket Name: Fill in the destination bucket name where you need to copy the files.
RabbitMQ is an open-source message-broker software that enables communication between different applications or services. It implements the Advanced Message Queuing Protocol (AMQP) which is a standard protocol for messaging middleware. RabbitMQ is designed to handle large volumes of message traffic and to support multiple messaging patterns such as point-to-point, publish/subscribe, and request/reply. In a RabbitMQ system, messages are produced by a sender application and sent to a message queue. Consumers subscribe to the queue to receive messages and process them accordingly. RabbitMQ provides reliable message delivery, scalability, and fault tolerance through features such as message acknowledgement, durable queues, and clustering.
A RabbitMQ consumer is a client application or process that subscribes to a queue and receives messages in a push mode, using RabbitMQ client libraries and various subscription options.
All component configurations are classified broadly into the following sections:
Meta Information
Follow the steps given in the demonstration to configure the Rabbit MQ Consumer component.
Host: Enter the host for RabbitMQ.
Port: Enter the port.
Username: Enter the username for RabbitMQ.
Password: Enter the password to authenticate with RabbitMQ consumer.
Queue: Provide queue for RabbitMQ consumer. A queue is a buffer that holds messages produced by publishers until they are consumed by subscribers. Queues are the basic building blocks of a RabbitMQ messaging system and are used to store messages that are waiting to be processed.
Mongo ChangeStream allow applications to access real-time data changes without the complexity. Applications can use change streams to subscribe to all data changes on a single collection, a database, or an entire deployment, and immediately react to them. Because change streams use the aggregation framework, applications can also filter for specific changes.
All component configurations are classified broadly into 3 section:
Meta Information
Follow the given walk-through to configure the Mongo Change Stream component.
Connection type: Select the connection type from the drop-down menu and provide the required credentials.
Database name: Enter the database name.
Collection name: Enter the collection name from the given database.
Operation type: Select the operation type from the drop-down menu. There are four types of operations supported here: Insert, Update, Delete, and Replace.
Enable SSL: Check this box to enable SSL for this components. Credentials will be different for this.
Activate the pipeline, make any operation from the above given operation types in the Mongo collection.
Whatever operation has been done in the Mongo collection, the Mongo ChangeStream component will fetch that change and send it to the next Event in the Pipeline Workflow.
Enable SSL: Check this box to enable SSL for this components. MongoDB connection credentials will be different if this option is enabled.
Certificate Folder: This option will appear when the Enable SSL field is checked-in. The user has to select the certificate folder from drop down which contains the files which has been uploaded to the admin settings. Please refer the below given images for the reference.
This component is used to fetch the tweets of any hashtag from Twitter.
All component configurations are classified broadly into the following sections:
Meta Information
Follow the demonstration to configure the Twitter Scrapper component.
Configuring the meta information tab for Twitter Scrapper:
Consumer API Key: Provide the Consumer API Key for the Twitter Scrapper.
Consumer API Secret Key: This Key acts as password for this component.
Filter text: Enter the hashtag from where the Tweets are to be fetched.
Twitter Data Type: This field contains two options:
History: It will fetch all the past Tweets.
Real-time: It will fetch the real-time Tweets.
EventHub subscriber typically consumes event data from an EventHub by creating an event processor client that reads the event data from the EventHub.
All component configurations are classified broadly into the following sections:
Meta Information
Follow the provided demonstration to configure the Eventhub Subscriber component.
There are two read using methods:
Connection String
Principal Secret
Connection String: It is a string of parameters that are used to establish a connection to an Azure EventHub
Consumer Group: It is a logical grouping of event consumers (subscribers) that read and process events from the same partition of an event hub.
EventHub Name: It refers to the specific Event Hub within the Event Hubs namespace to which data is being sent or received.
Checkpoint Location: It is a location in the event stream that represents the last event that has been successfully processed by the subscriber.
Enqueued time: It indicates the time when the event was added to the partition, which is typically the time when the event occurred or was generated.
Subscriber namespace: It is a logical entity that is used to group related subscribers and manage access control to EventHubs within the namespace.
Client ID: The ID of the Azure AD application that has been registered in the Azure portal and that will be used to authenticate the subscriber. This can be found in the Azure portal under the "App registrations" section.
Tenant ID: The ID of the Azure AD tenant that contains the Azure AD application and service principal that will be used to authenticate the subscriber.
Client secret: The secret value that is associated with the Azure AD application and that will be used to authenticate the subscriber.
Consumer group: It is a logical grouping of event consumers (subscribers) that read and process events from the same partition of an event hub.
EventHub Name: It refers to the specific Event Hub within the Event Hubs namespace to which data is being sent or received.
Checkpoint Location: It is a location in the event stream that represents the last event that has been successfully processed by the subscriber.
Enqueued time: It indicates the time when the event was added to the partition, which is typically the time when the event occurred or was generated.
Subscriber namespace: It is a logical entity that is used to group related subscribers and manage access control to EventHubs within the namespace.
In AWS, SNS (Simple Notification Service) is a fully managed messaging service that enables you to send notifications and messages to distributed systems and components. SNS Monitor is a feature or functionality related to SNS that allows users to monitor the activity, health, and performance of their SNS topics and messages. It provides metrics and insights into the delivery status, throughput, success rates, and other relevant information about the messages sent through SNS topics.
All component configurations are classified broadly into 3 section:
Meta Information
Access Key: Enter the AWS access key.
Secret Key: Enter the AWS secret key.
Region: Select the region of the SNS topic.
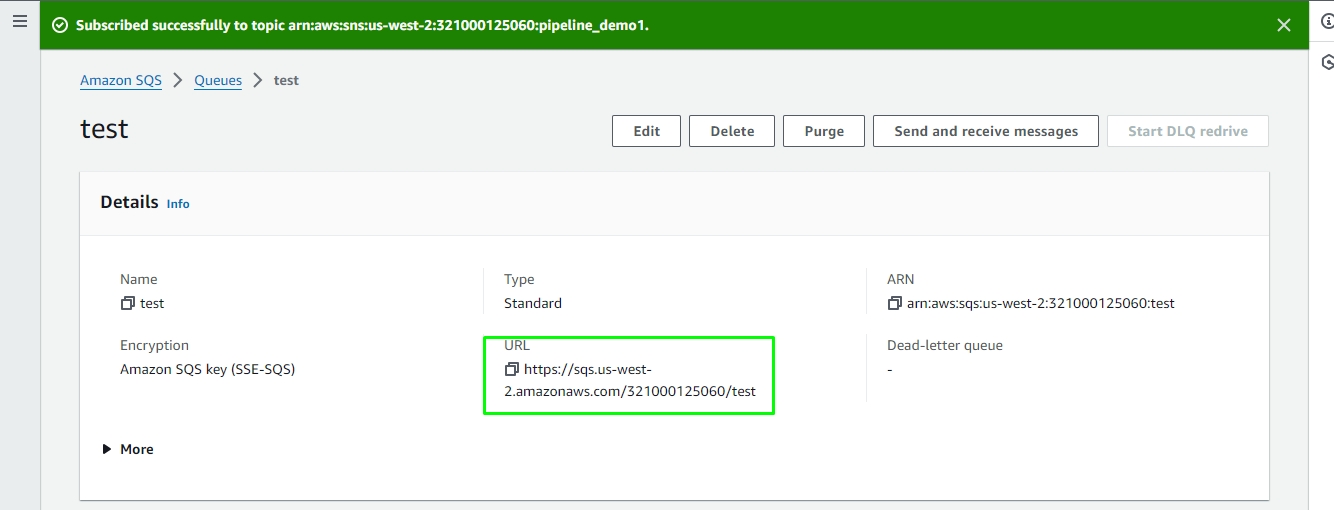
SQS URL: Enter the SQS URL obtained after creating an SQS queue, which will fetch the notification and send it to the out event if there is any modification in the S3 bucket.
Please Note:
Follow the below-given steps to set up monitoring for an S3 bucket using AWS SNS monitor:
Create an SNS topic in your AWS account.
Create an SQS queue that will subscribe to the SNS topic you created earlier.
After setting up the SQS queue, obtain the SQS URL associated with it.
With the SNS topic and SQS queue configured, you need to create an event notification for the S3 bucket that needs to be monitored.
This event notification will be configured to send notifications to the specified SNS topic.
Whenever there is a modification in the S3 bucket, the SNS topic will trigger notifications, which will be fetched by the SQS queue using its URL.
Finally, these notifications will be sent to the out Event, allowing you to monitor activity within the S3 bucket effectively.
Please go through the below given steps to create an SNS topic, SQS queue and Event Notification.
Sign in to the AWS console.
Navigate to the "Services" option or use the search option at the top and select "Simple Notification Service (SNS)".
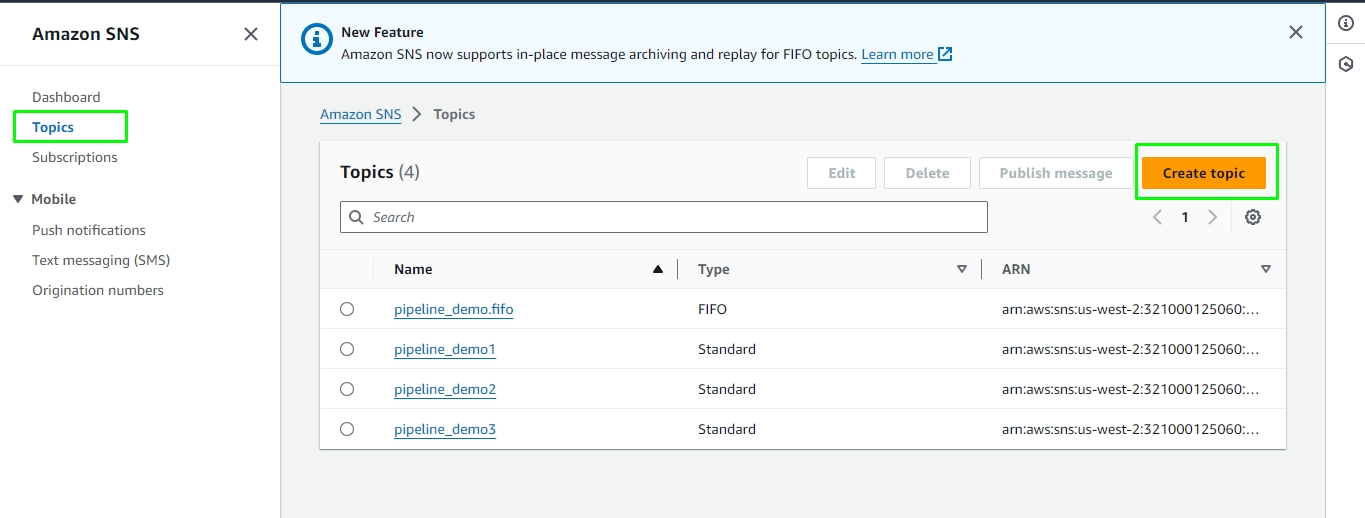
Once redirected to the SNS page, go to the "Topics" option and click on "Create topic".
Enter a name and display name for the topic, and optionally, provide a description.
Click on "Create topic" to create the SNS topic.
Once the topic is created, go to the "Subscriptions" tab and click on "Create subscription".
Choose "Amazon SQS" as the protocol.
Select the desired SQS queue from the drop-down list or create a new queue if needed.
Click on "Create subscription" to link the SQS queue to the SNS topic.
After successfully creating the subscription, the SQS URL will be displayed. This URL can be used to receive messages from the SNS topic.
Sign in to the AWS console.
Navigate to the "Services" option or use the search option at the top and select "Simple Queue Service (SQS)".
Once redirected to the SQS page, where the list of available queues will be displayed, go to the "Topics" option and click on "Create queue".
Enter the queue name and configure any required settings such as message retention period, visibility timeout, etc.
Click on the "Create queue" button to create the queue.
After successfully creating the queue, select the queue from the list.
In the queue details page, navigate to the "Queue Actions" dropdown menu and select "Subscribe to SNS topic".
Choose the SNS topic to which you want to subscribe from the dropdown menu.
Configure any required parameters such as filter policies and delivery retry policies.
Click on the "Subscribe" button to create the subscription.
Once the subscription is created successfully, the SQS URL will be displayed in the subscription details.
The Obtained URL can be used in the SQS URL field in the AWS SNS monitor component.
Once the SNS and SQS are configured, the user has to create an event notification in a bucket to monitor the activity of the S3 bucket using the AWS SNS monitor component in the pipeline. This involves setting up event notifications within an S3 bucket to trigger notifications whenever certain events occur, such as object creation, deletion, or modification. By configuring these event notifications, users can ensure that relevant events in the S3 bucket are captured and forwarded to the specified SNS topic for further processing or monitoring. This integration allows for seamless monitoring of S3 bucket activities using the AWS SNS monitor component within the pipeline.
Sign in to the AWS Management Console.
Navigate to the "Services" option and select "S3" from the list of available services.
Once redirected to the S3 dashboard, locate and click on the desired bucket for which you want to create an event notification.
In the bucket properties, navigate to the "Properties" tab.
Scroll down to the "Events" section and click on "Create event notification".
Provide a name for the event notification configuration.
Choose the events that the user wants to trigger notifications for, such as "All object create events", "All object delete events", or specific events based on prefixes or suffixes.
Specify the destination for the event notification. Select "Amazon SNS" as the destination type.
Choose the SNS topic to which the user wants to publish the event notifications.
Optionally, configure any additional settings such as filters based on object key prefixes or suffixes.
Review the configuration and click "Save" or "Create" to create the event notification.
Once saved, the event notification will be configured for the selected S3 bucket, and notifications will be sent to the specified SNS topic whenever the configured events occur within the bucket. Subsequently, these notifications will be fetched by the SQS URL subscribed to that SNS topic.
Go through the below given demonstration to create SNS topic, SQS ques and Event notification in AWS.
Please Note: The user should ensure that the AWS Bucket, SNS topic, and SQS topic are in the same region to create an event notification.


The Kafka Consumer component consumes the data from the given Kafka topic. It can consume the data from the same environment and external environment with CSV, JSON, XML, and Avro formats. This comes under the Consumer component group.
All component configurations are classified broadly into the following sections:
Meta Information
Check out the steps provided in the demonstration to configure the Kafka Consumer component.
Please Note: It currently supports SSL and Plaintext as Security types.
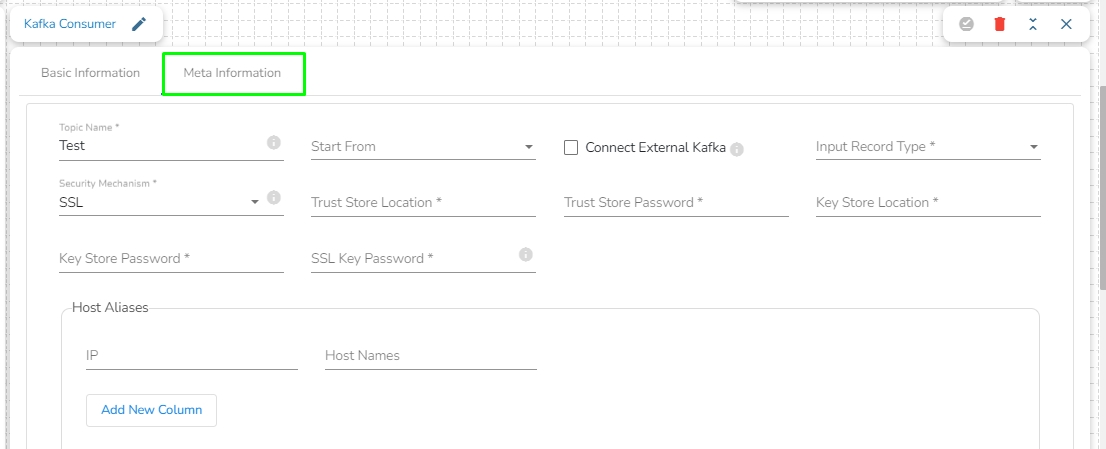
This Component can read the data from external Brokers as well with SSL as the security type and host Aliases:
Click on the dragged Kafka Consumer component to get the component properties tabs.
Configure the Basic Information tab.
Select an Invocation type from the drop-down menu to confirm the running mode of the component. Select the Real-Time option from the drop-down menu.
Deployment Type: It displays the deployment type for the component. This field comes pre-selected.
Container Image Version: It displays the image version for the docker container. This field comes pre-selected.
Failover Event: Select a failover Event from the drop-down menu.
Batch Size (min 10): Provide the maximum number of records to be processed in one execution cycle (Min limit for this field is 10
Enable Auto-Scaling: Component pod scale up automatically based on a given max instance, if component lag is more than 60%.
Topic Name: Specify the topic name that the user wants to consume data from Kafka.
Start From: The user will find four options here. Please refer at the bottom of the page for a detailed explanation along with an example.
Processed:
It Represents the offset that has been successfully processed by the consumer.
This is the offset of the last record that has been successfully read and processed by the consumer.
By selecting this option, the consumer initiates data consumption from the point where it previously successfully processed, ensuring continuity in the consumption process.
Beginning:
It Indicates the earliest available offset in a Kafka topic.
When a consumer starts reading from the beginning, it means it will read from the first offset available in the topic, effectively reading all messages from the start.
Latest:
It represents the offset at the end of the topic, indicating the latest available message.
When a consumer starts reading from the latest offset, it means it will only read new messages that are produced after the consumer starts.
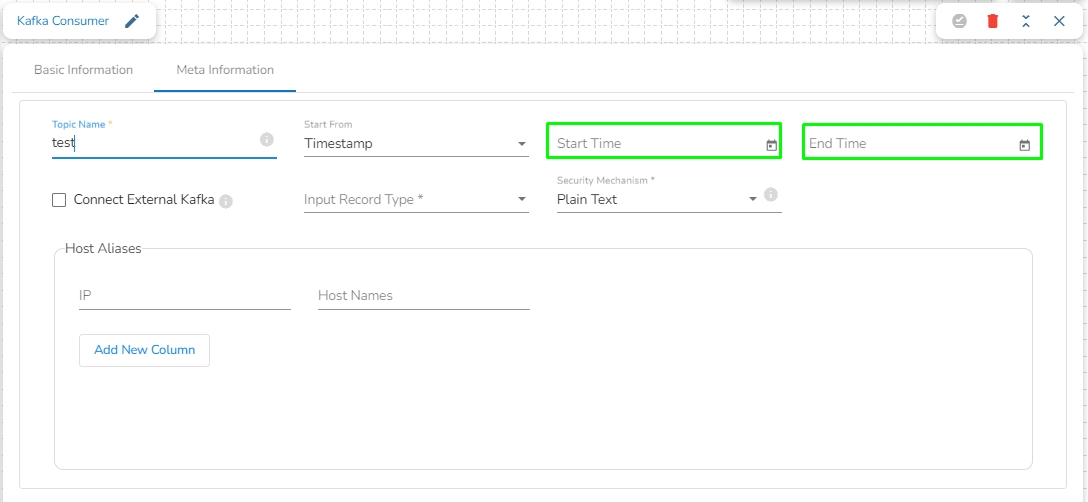
Timestamp:
It refers to the timestamp associated with a message. Consumers can seek to a specific timestamp to read messages that were produced up to that timestamp.
To utilize this option, users are required to specify both the Start Time and End Time, indicating the range for which they intend to consume data. This allows consumers to retrieve messages within the defined time range for processing.
Is External: The user can consume external topic data from the external bootstrap server by enabling the Is External option. The Bootstrap Server and Config fields will display after enabling the Is External option.
Bootstrap Server: Enter external bootstrap details.
Config: Enter configuration details of external details.
Input Record Type: It contains the following input record types:
CSV: The user can consume CSV data using this option. The Headers and Separator fields will display if the user selects choose CSV input record type.
Header: In this field, the user can enter column names of CSV data that consume from the Kafka topic.
Separator: In this field, the user can enter separators like comma (,) that are used in the CSV data.
JSON: The user can consume JSON data using this option.
XML: The user can consume parquet data using this option.
AVRO: The user can consume Avro data using this option.
Security Type: It contains the following security types:
Plain Text: Choose the Plain Text option if there environment without SSL.
Host Aliases: This option contains the following fields:
IP: Provide the IP address.
Host Names: Provide the Host Names.
SSL: Choose the SSL option if there environment with SSL. It will display the following fields:
Trust Store Location: Provide the trust store path.
Trust Store Password: Provide the trust store password.
Key Store Location: Provide the key store path.
Key Store Password: Provide the key store password.
SSL Key Password: Provide the SSL key password.
Host Aliases: This option contains the following fields:
IP: Provide the IP.
Host Names: Provide the host names.
Please Note: The Host Aliases can be used with the SSL and Plain text Security types.
Processed:
If a consumer has successfully processed up to offset 2, it means it has processed all messages up to and including the one at offset 2 (timestamp 2024-02-27 01:00 PM). Now, the consumer will resume processing from offset 3 onwards.
Beginning:
If a consumer starts reading from the beginning, it will read messages starting from offset 0. It will process messages with timestamps from 2024-02-27 10:00 AM onward.
Latest:
If a consumer starts reading from the latest offset, it will only read new messages produced after the consumer starts. Let's say the consumer starts at timestamp 2024-02-27 02:00 PM; it will read only the message at offset 3.
Timestamp:
If a consumer seeks to a specific timestamp, for example, 2024-02-27 11:45 AM, it will read messages with offsets 2 and 3, effectively including the messages with timestamps 2024-02-27 01:00 PM and 2024-02-27 02:30 PM, while excluding the messages with timestamps 2024-02-27 10:00 AM and 2024-02-27 11:30 AM.
API ingestion and Webhooks are two methods used to receive data from a third-party service or system.
All component configurations are classified broadly into 3 section
Meta Information
Follow the steps given in the demonstration to configure the API Ingestion component.
Ingestion type: Select API ingestion as ingestion type from drop down. (API Ingestion or Webhook)
Ingestion Id: It will be predefined in the component.
Ingestion Secret: It will be predefined in the component.
Once the pipeline gets saved, the Component Instance Id URL gets generated in the meta information tab of the component as shown in the above image.
Connect a out event with the component and activate the pipeline.
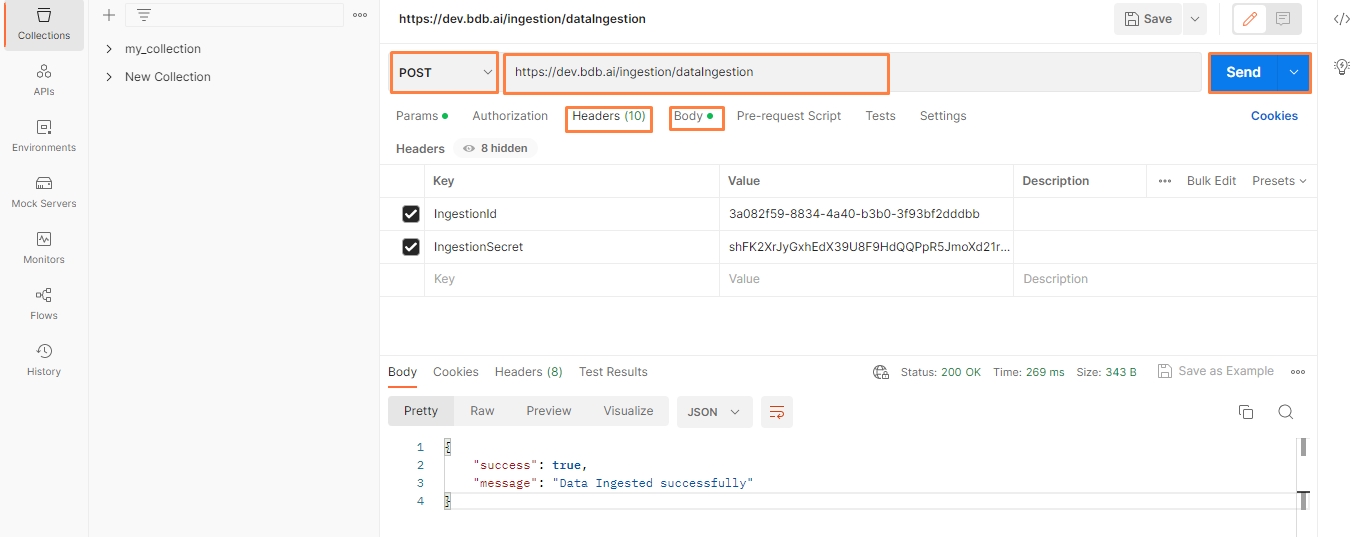
Open the Postman tool / other tools where you want to configure the API/webhook endpoint.
Create a new request and select the POST as request method from drop down and provide the generated Component Instance Id URL in the URL section of the Postman tool.
Navigate to the Headers section in the Postman tool and provide the Ingestion Id (key : ingestionId)and Ingestion Secret (key : ingestionSecret) which is pre-defined in the Meta Information of the API Ingestion component.
Navigate to the Body section in the Postman and select raw tab and select the JSON option from the drop-down as the data type.
Now, enter the JSON data in the space provided and click on send button.
The API Ingestion component will process the JSON data entered in the Postman tool and it will send the JSON data to the out event.
Please refer the below-given image to configure the Postman tool for API Ingestion component:
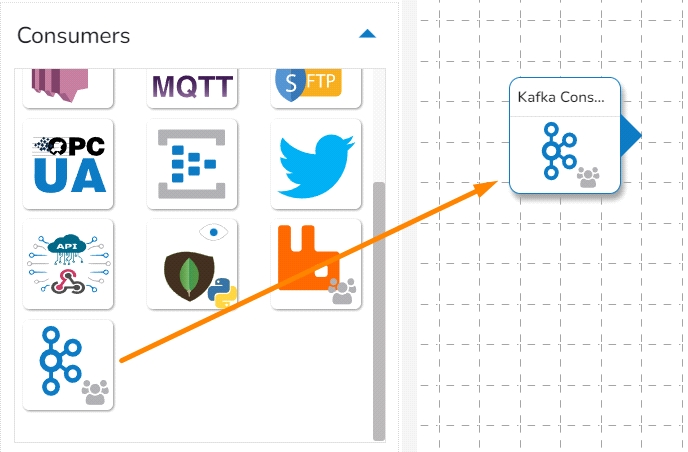
Drag and drop the Kafka Consumer Component to the Workflow Editor.
Click on save component icon to save the component.
Click on save pipeline icon to save the pipeline.


