This page explains the Global Filter functionality available for the reports.
The Global Filter applies a selected parameter to the entire report, affecting all views that are sensitive to the chosen filter criteria. It is available on the final page of the report and ensures consistent filtering across all relevant Views.
Check out the illustration to understand the Global Filter functionality.
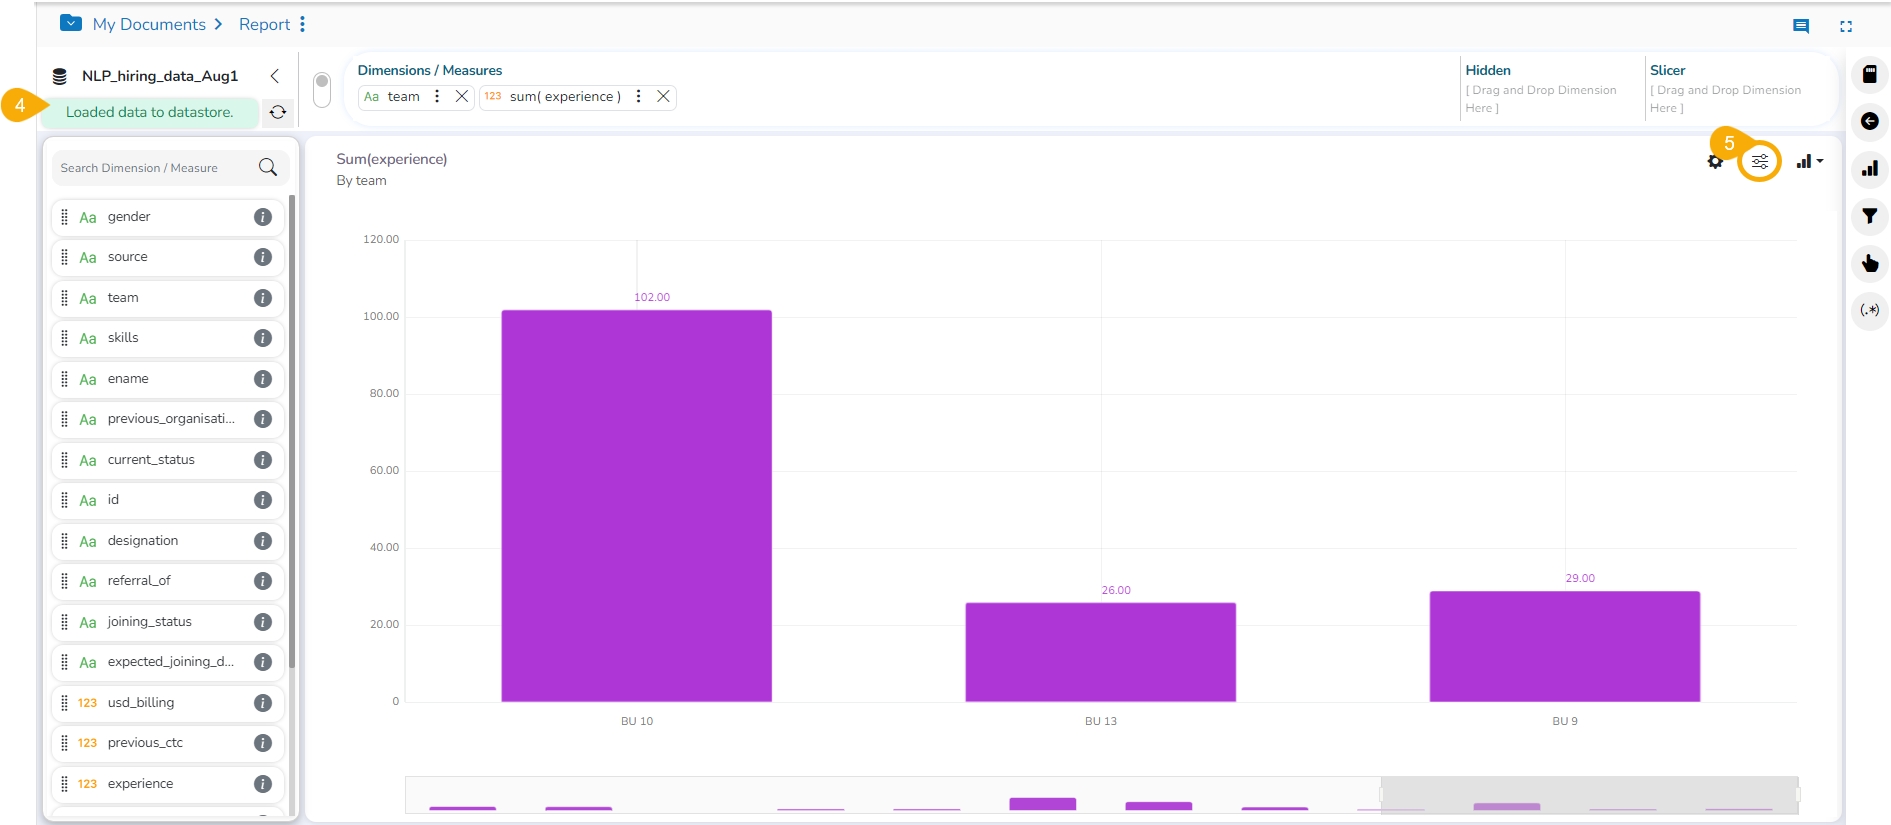
Navigate to a Report.
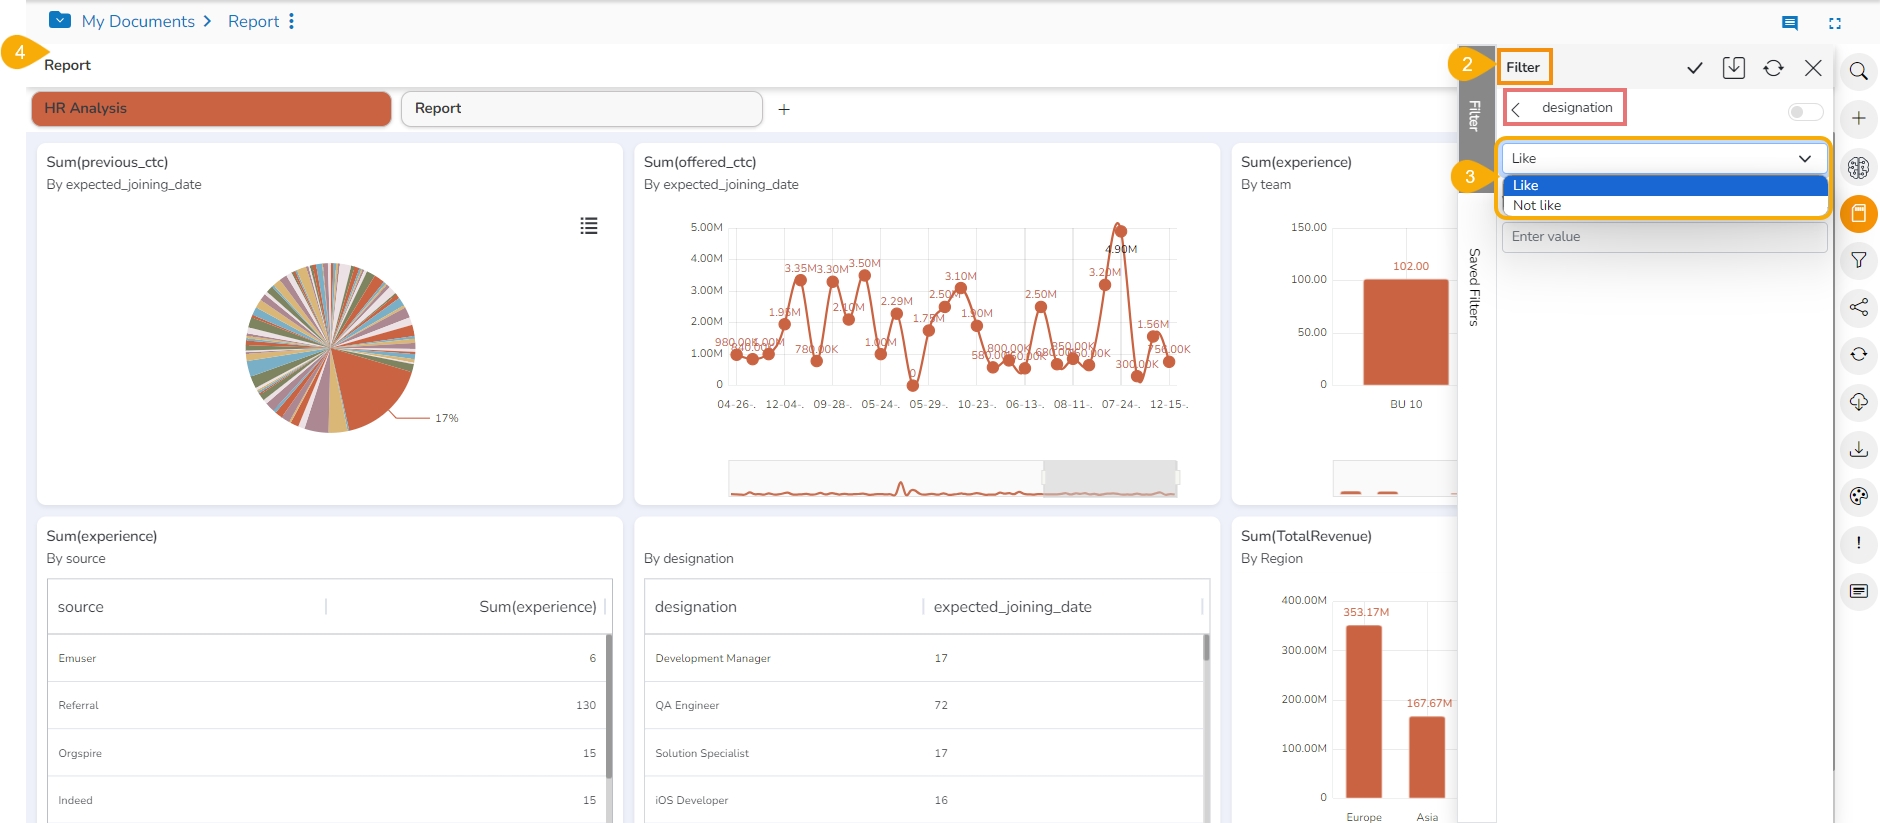
Click the Global Filter icon provided in the menu panel of the selected report.
A Filter panel opens, displaying a list of values that can be used as a filter condition.
A list containing all the sub-dimensions are displayed (Clicking a measure or time dimension would display the related fields).
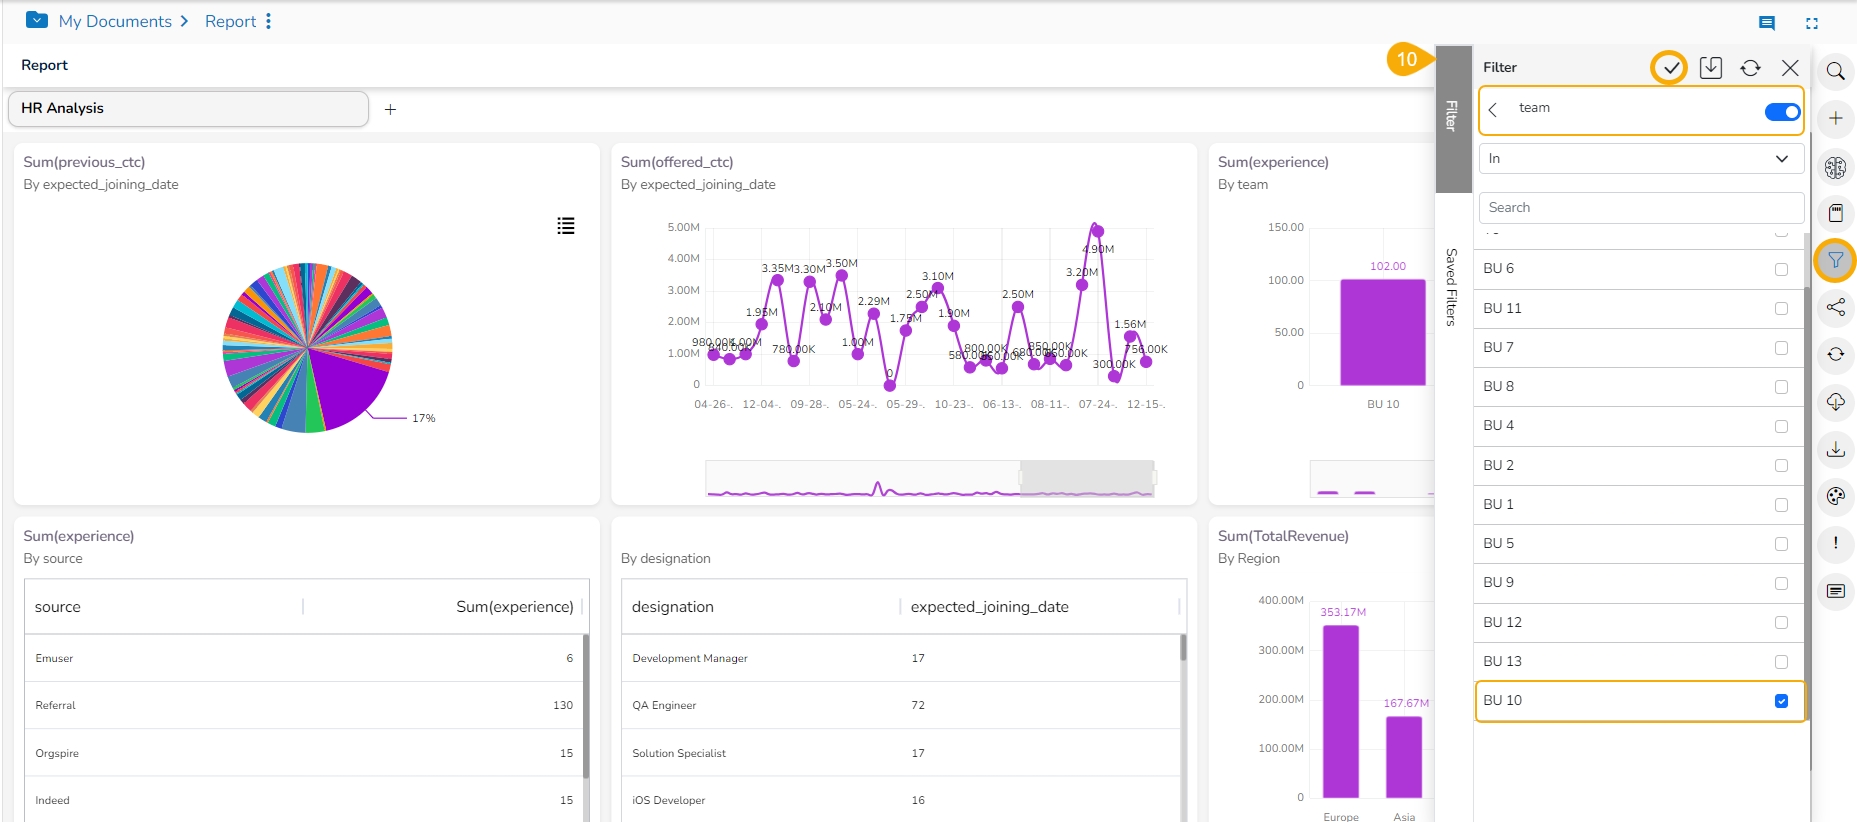
Select the In option from the drop-down menu to apply the filtering condition. (E.g., the below-given image displays In as the selected option so that the report gets filtered as per the chosen sub-dimension(s).
Select the sub-dimensions using the check boxes (if a Dimension is selected).
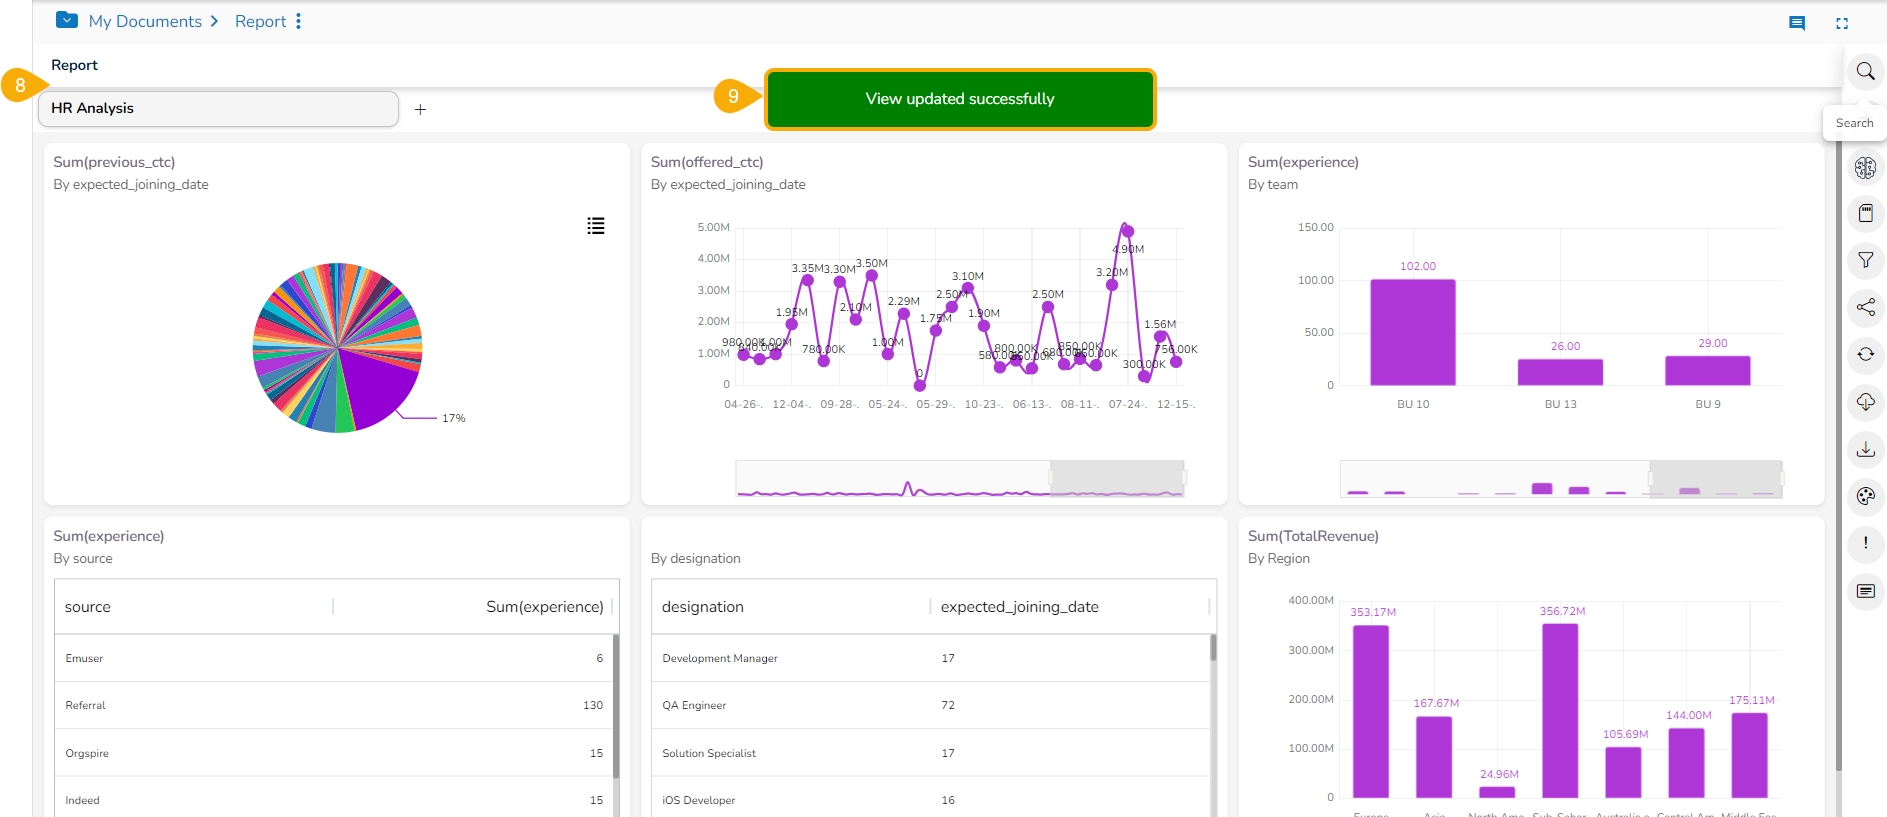
The Global Filter icon gets highlighted.
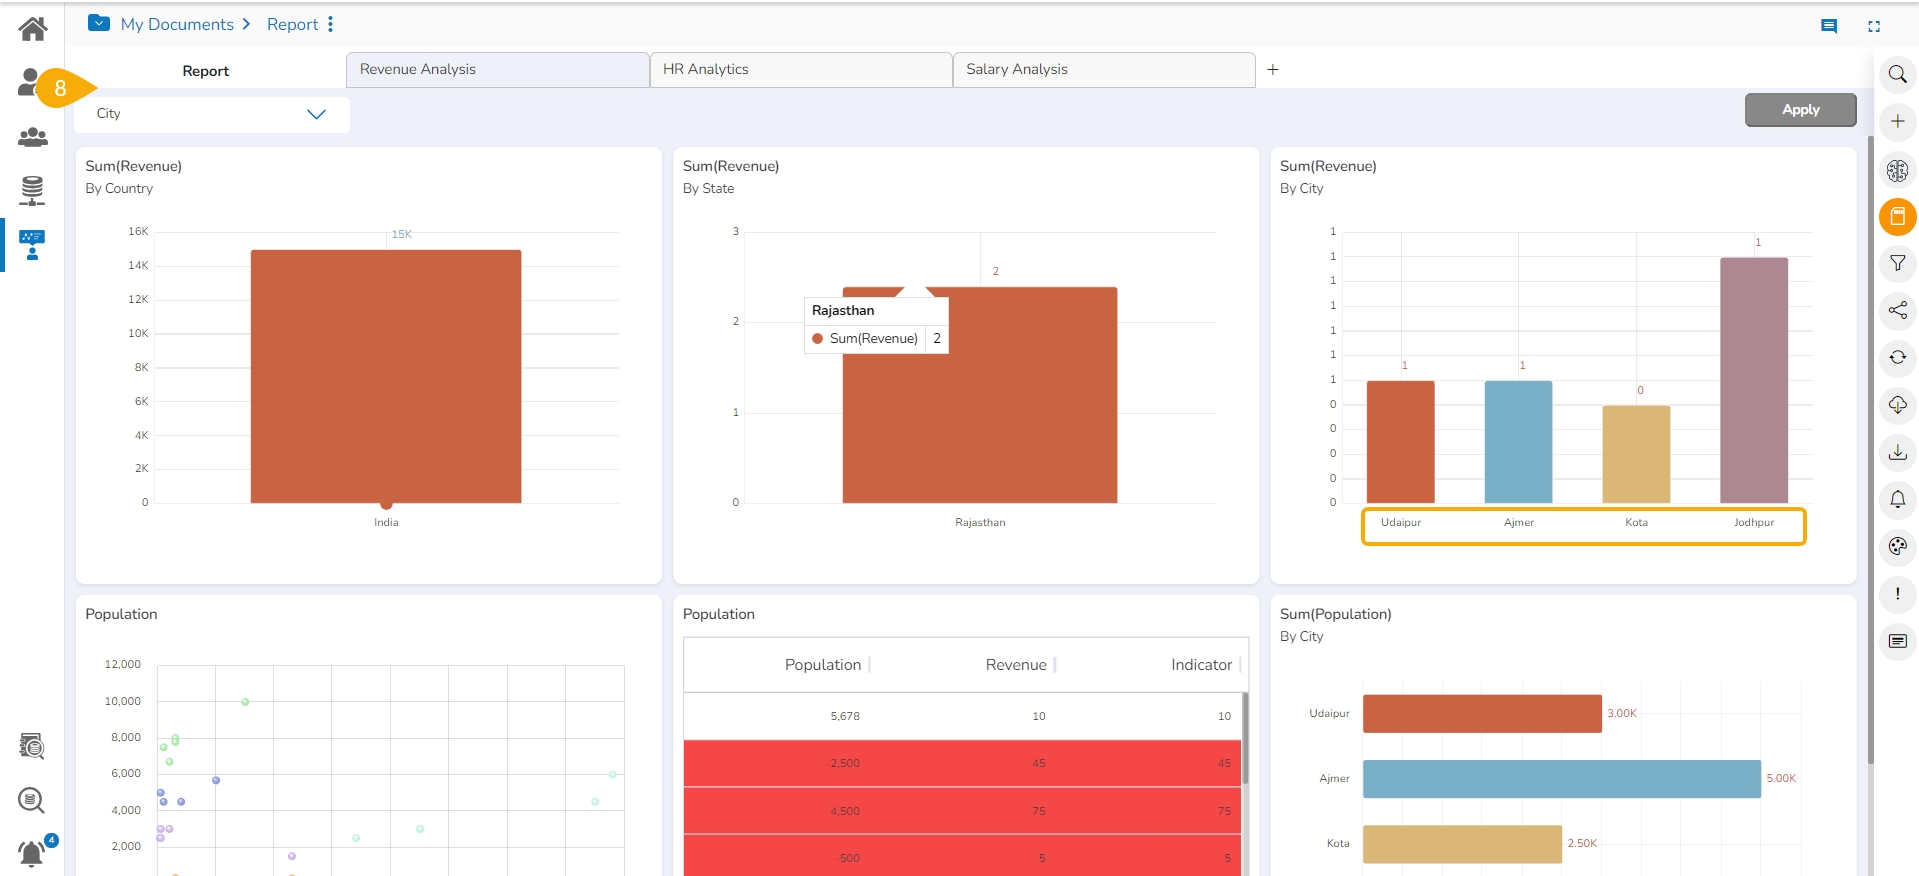
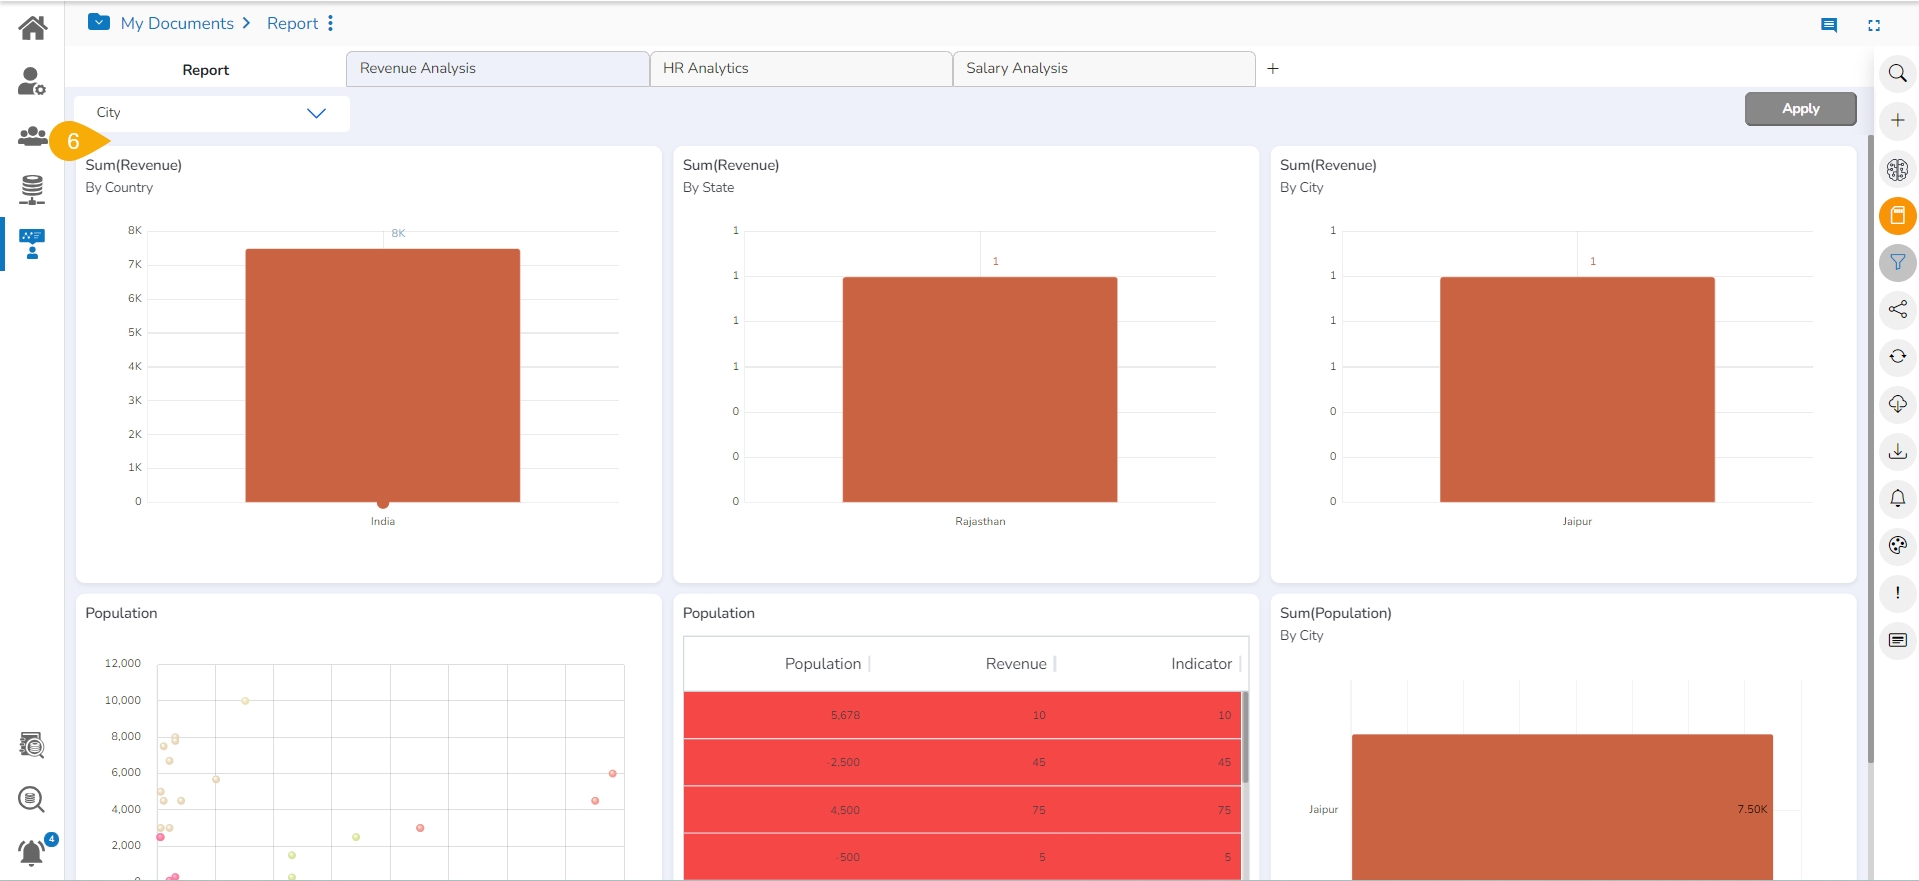
The concerned Views of the selected report get customized as per the applied Global Filter condition. E.g., All the concerned Views are filtered by the selected Global filter value in a report. In this report, the first Five Views are modified, and Six View is excluded from the Global Filter as it is based on a different Data Store.
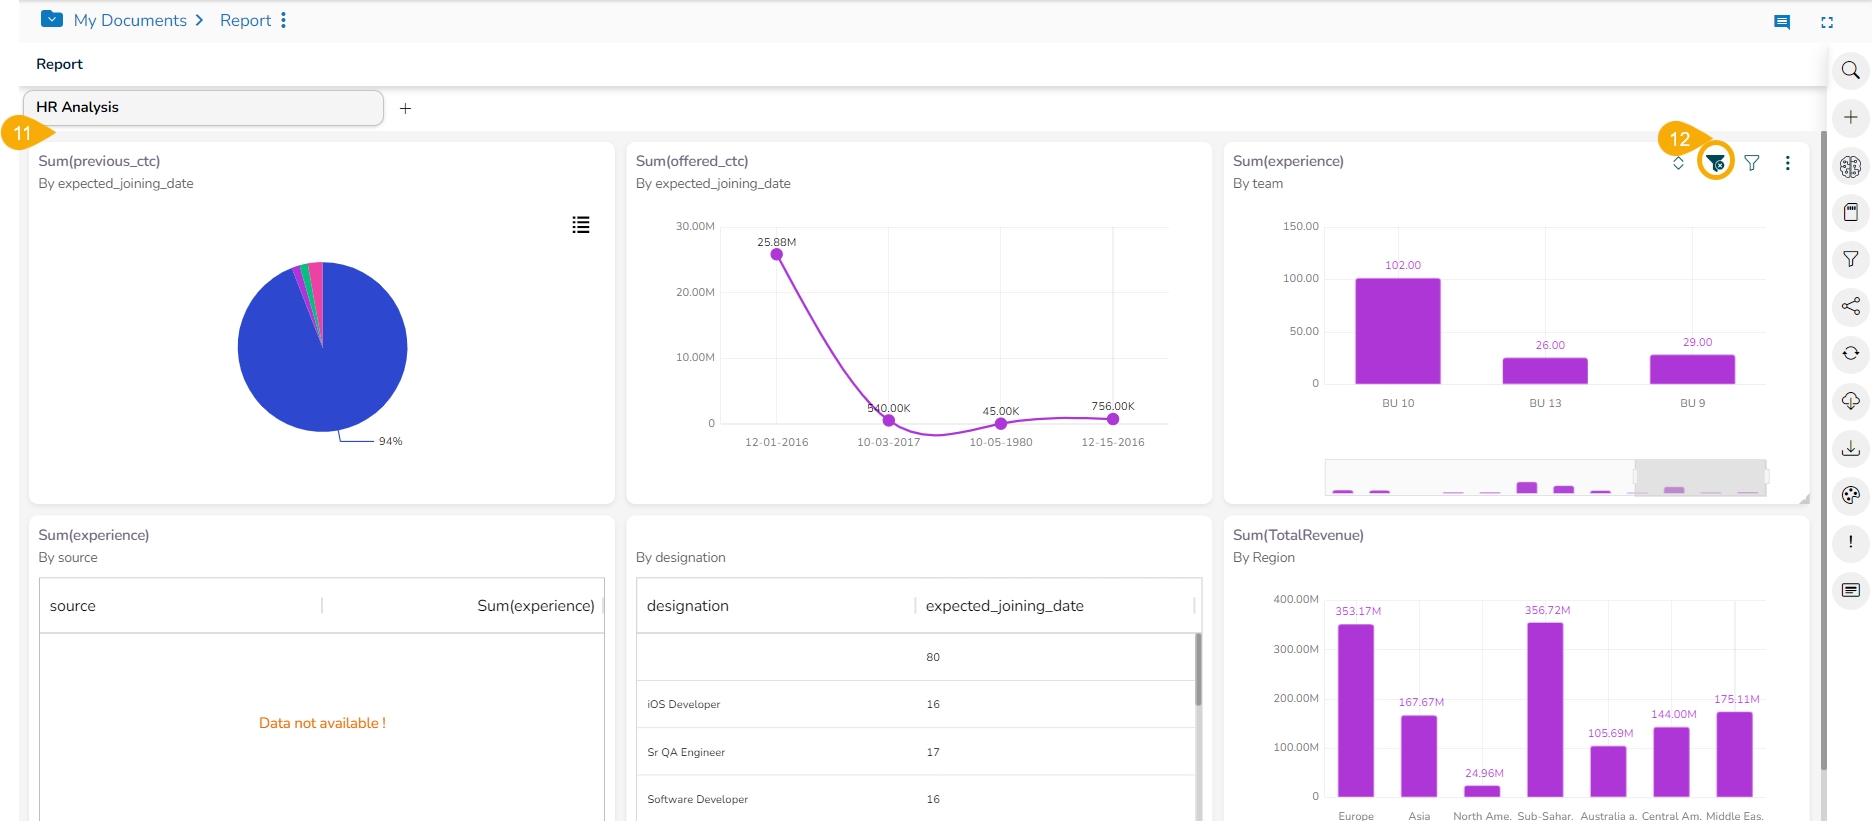
Click the Global Filter icon provided on the final screen of a report.
A filter panel opens, displaying a list of values that can be used as a filter condition.
Click on a Dimension to display a list containing all the sub-dimensions (Clicking a measure or time dimension would display the related fields).
The Views of a report get filtered by not selected filter conditions. E.g., In this example the Report data gets filtered by the values other than the cities of the Rajasthan.
The Global Filter provides an option to Attach the selected filter value to the filter panel.
The Filter panel opens by clicking the Global Filter icon.
Click the Attach to filter panel icon for a selected filter condition.
The concerned filter value gets attached to the top filter panel.
The Attach to filter panel turns blue.
Choose the sub-value for the attached filter from the top filter panel.
Click the Apply option given at the top of the Report.
The selected value/sub-value gets applied to all the concerned View of the Report.
Select sub-dimension(s) using checkmark(s).
Click the Apply icon.
Users can insert Views from different data stores in a single report. In a report with Views from multiple data stores, applying a Global Filter only affects the Views from the specific data store where the filter conditions are selected; Views from other data stores remain unaffected.
The Global Filter panel displays all available filter values across the data stores by default.
Click the Refresh icon to Refresh Views and remove the effect of an applied Global Filter criteria from the chosen Report.
Check out the walk-through on how to exclude a View from the Global Filter.
The Global filter values are applied to all the available Views of a report (if they are created using the same data store). The users can exclude a specific view from the Global Filter effect by selecting the Exclude from the Global Filter option.
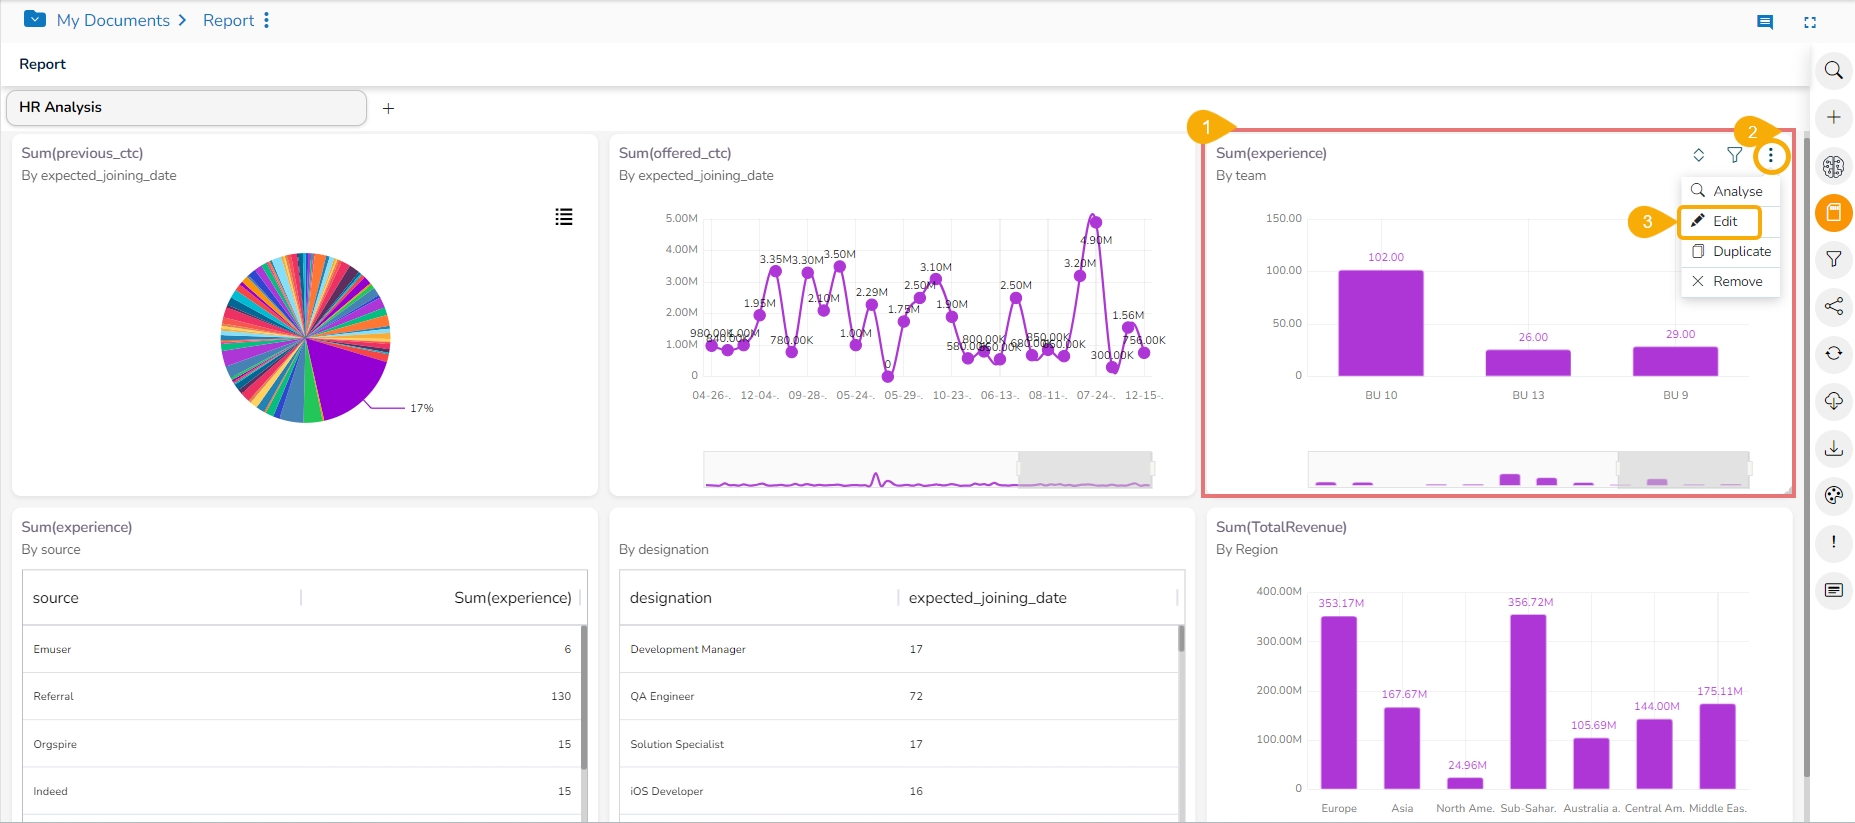
Select a View from the Report.
Click the Options icon for a View.
Click the Edit option.
The View opens in the Design mode.
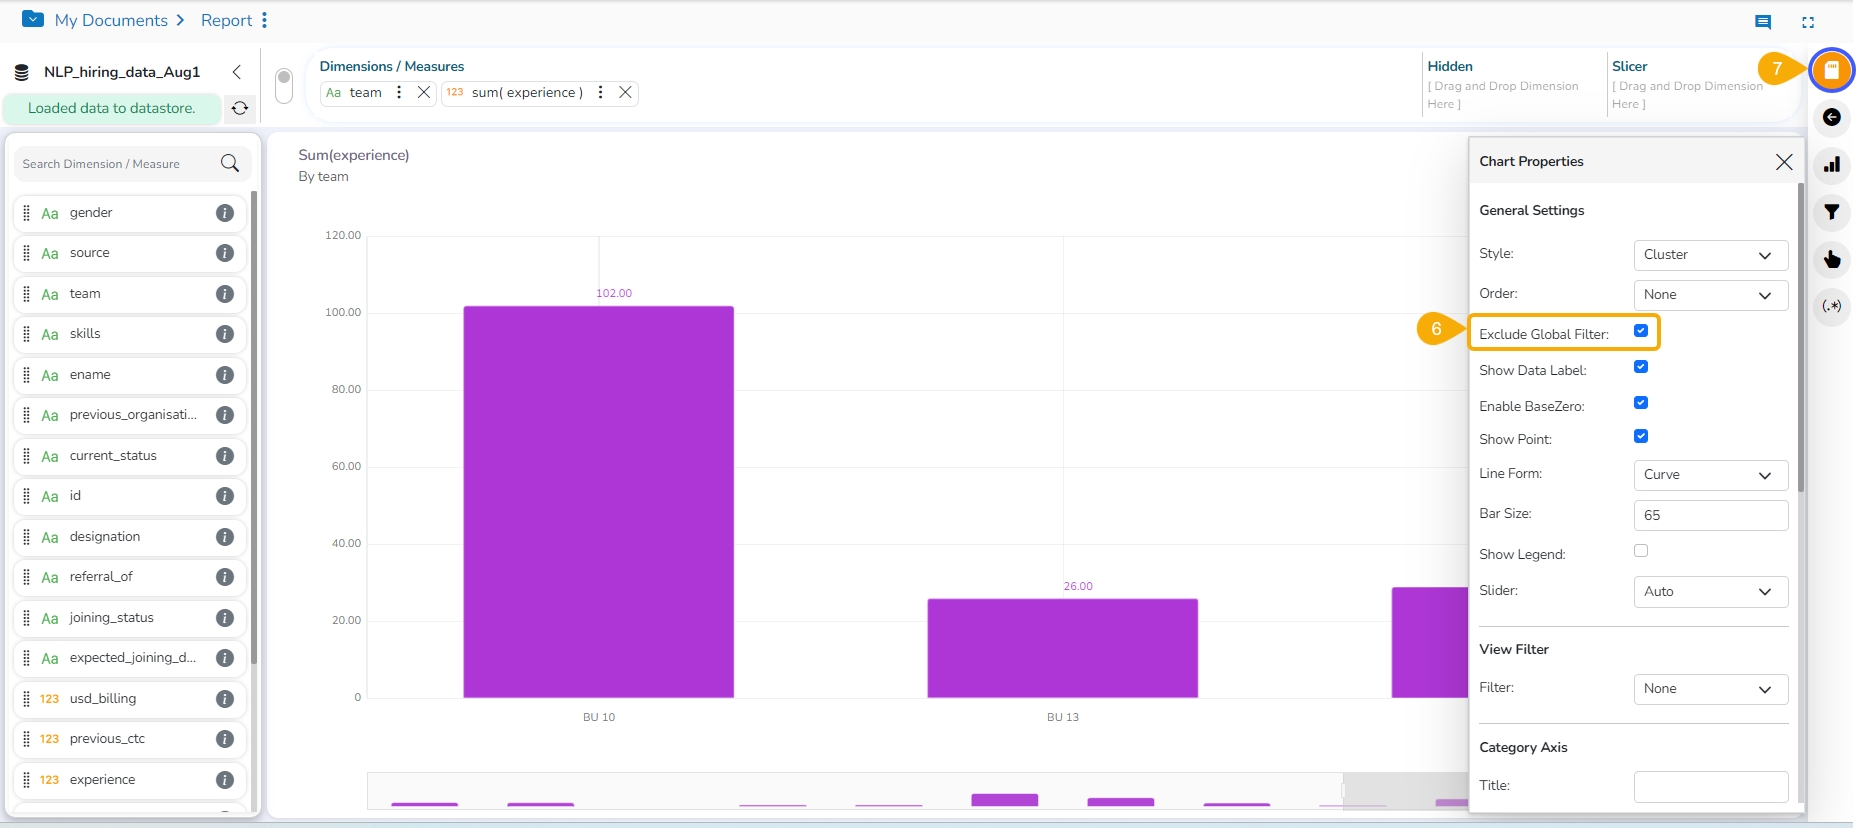
Click the Properties icon.
Enable the Exclude Global Filter option from the Properties tab.
Click the Save icon.
The user gets redirected to the final screen of the Report.
A notification appears enuring the update of the concerned View.
Apply the Global Filter value. Refer the page for the details.
All the Views get modified according to the Global filter, but the selected View gets excluded from the Global filter.
The Global Filters Excluded icon gets added to the View that has been excluded from the Global Filter.
Click the Global Filter icon.
The global filter panel opens.
Select a Dimension. In this case, State is selected as a Dimension.
Select the filter condition from the drop-down. In this case, Like filter condition is selected, so enter the value by which you want to filter the report.
Click the Apply icon.
Click the Save icon.
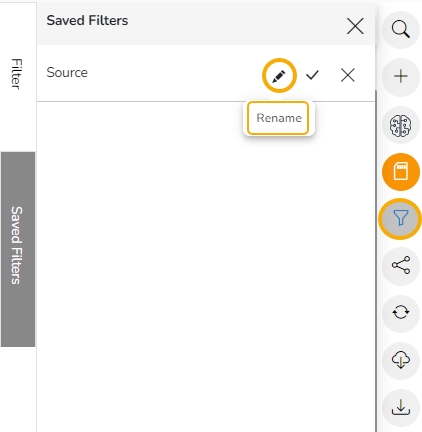
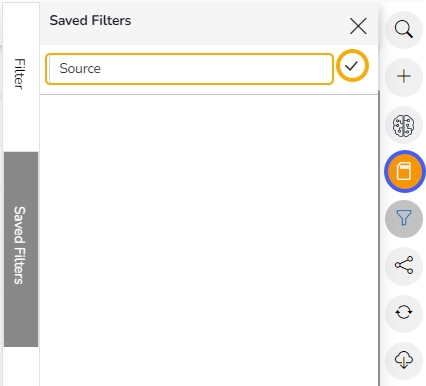
The Save Filter window opens.
Provide a Filter Name.
Click the Save option.
The saved Global Filter gets stored under the Saved Filters tab.
Click the Apply Filter icon to apply a saved Filter.
The saved global filter condition gets applied to the concerned Views of a Report.
Click the Global Filter icon.
Open the Saved Filter tab.
Click the Delete Filter option for a selected filter.
The concerned saved filter gets removed.
Check out the walk-through on Custom View Filter to understand the functionality.
The user can access this view-specific filter option from the chart properties provided on the final screen of report when the View is saved.
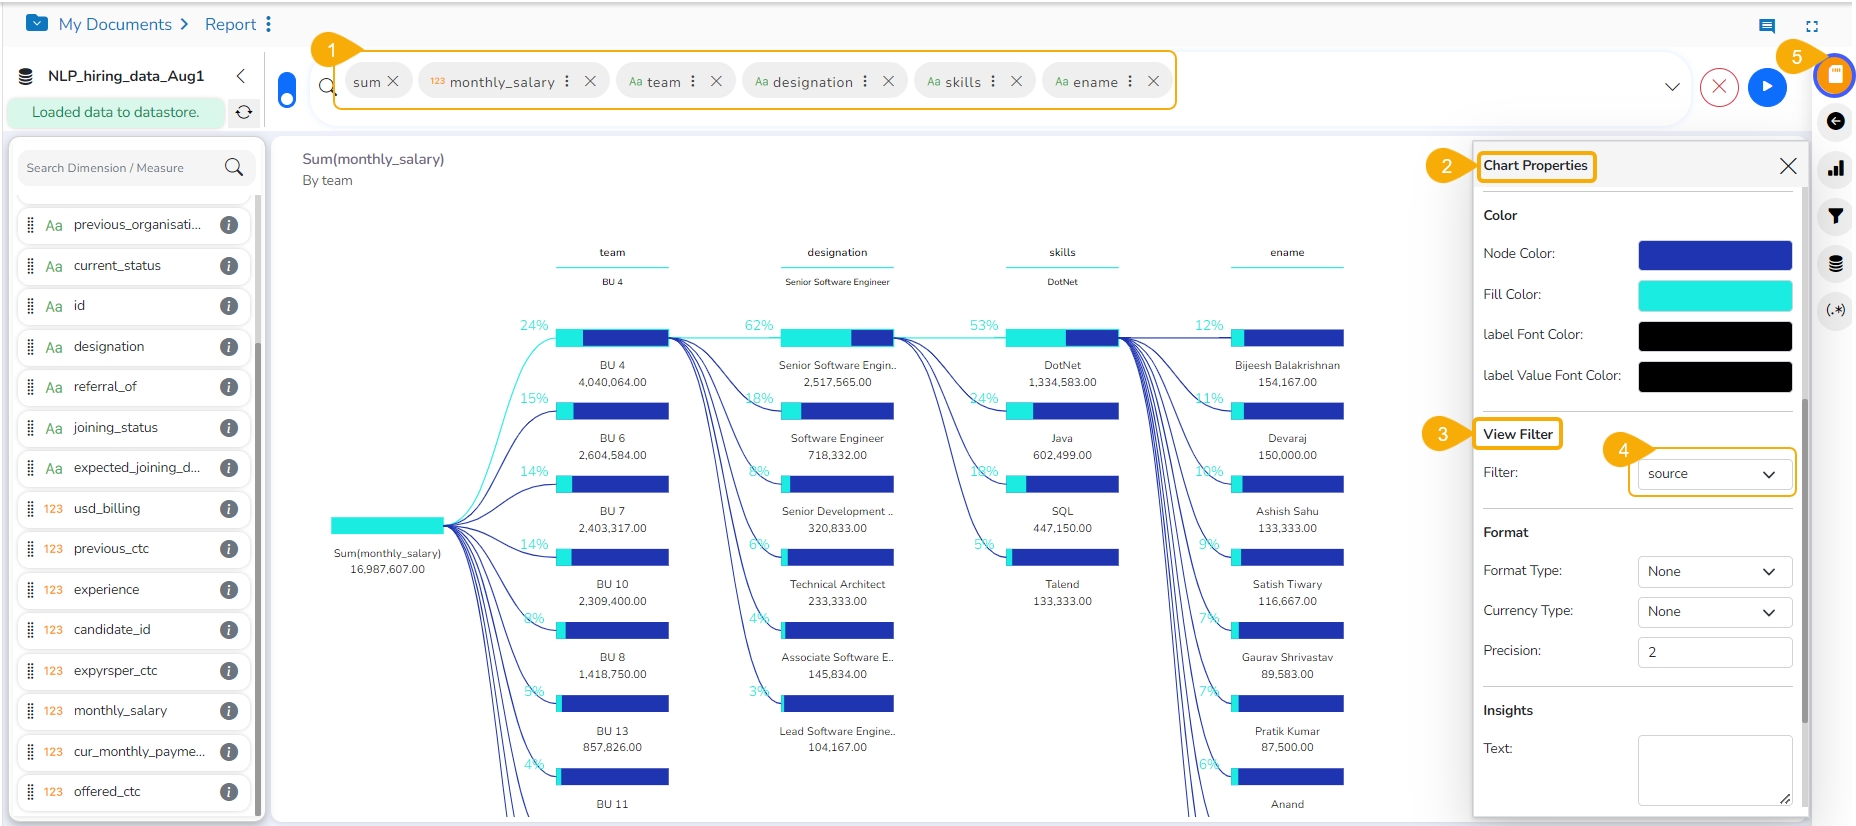
Create a View by the drag and drop of the desired dimension and measure options using the Design canvas (By default, the Mixed chart gets selected to display the selected data).
Open the Chart Properties tab.
Navigate to the View Filter field.
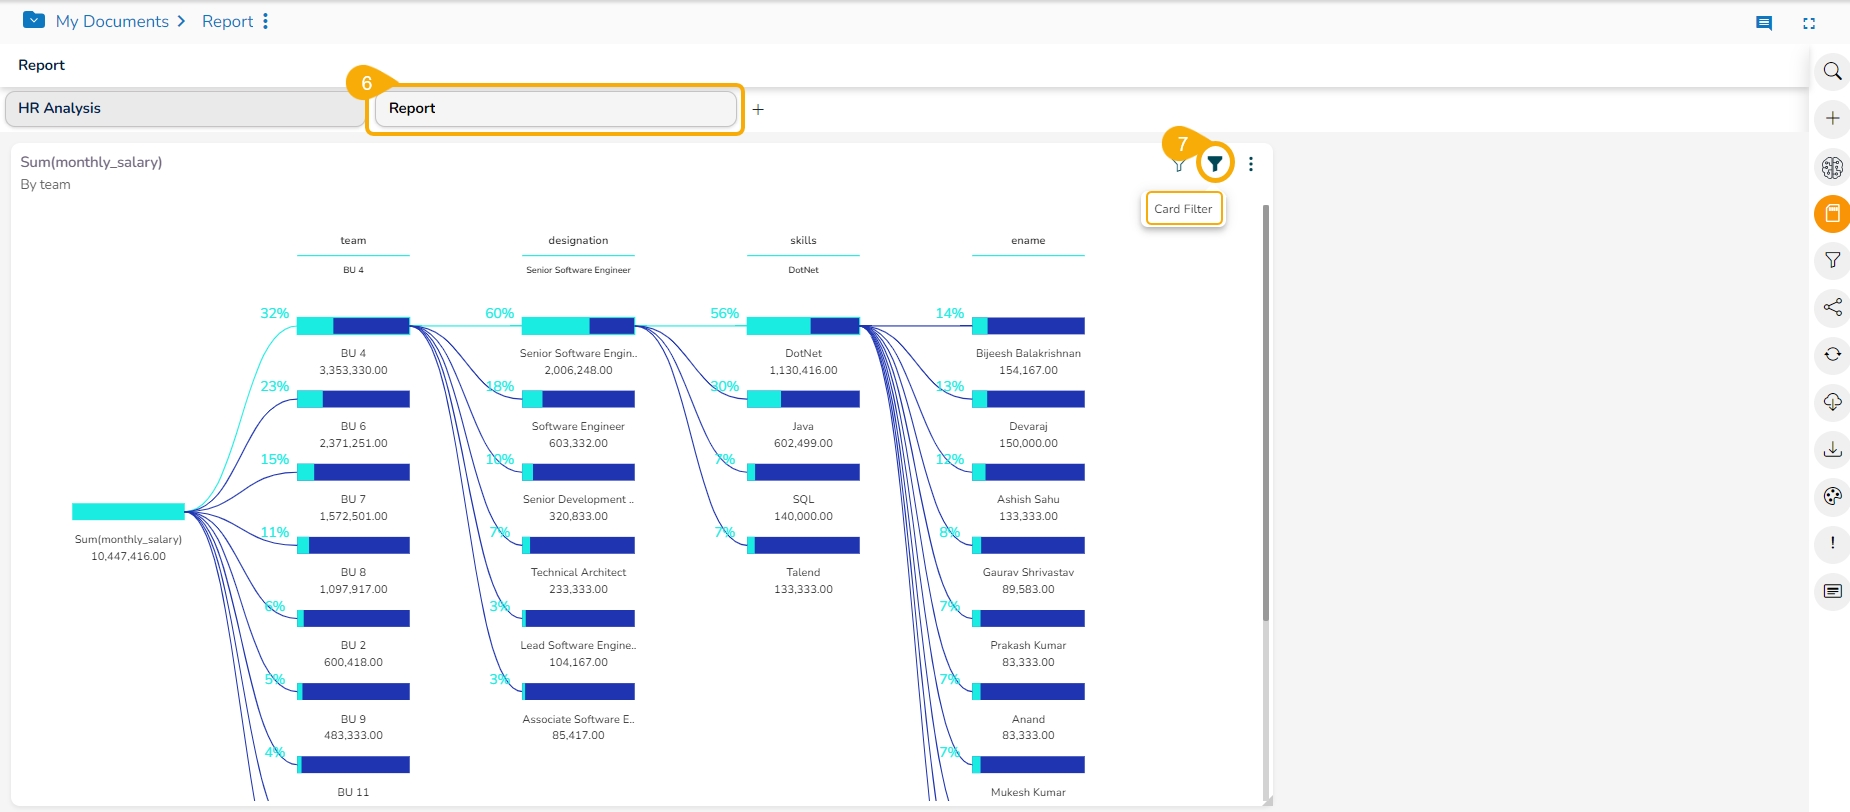
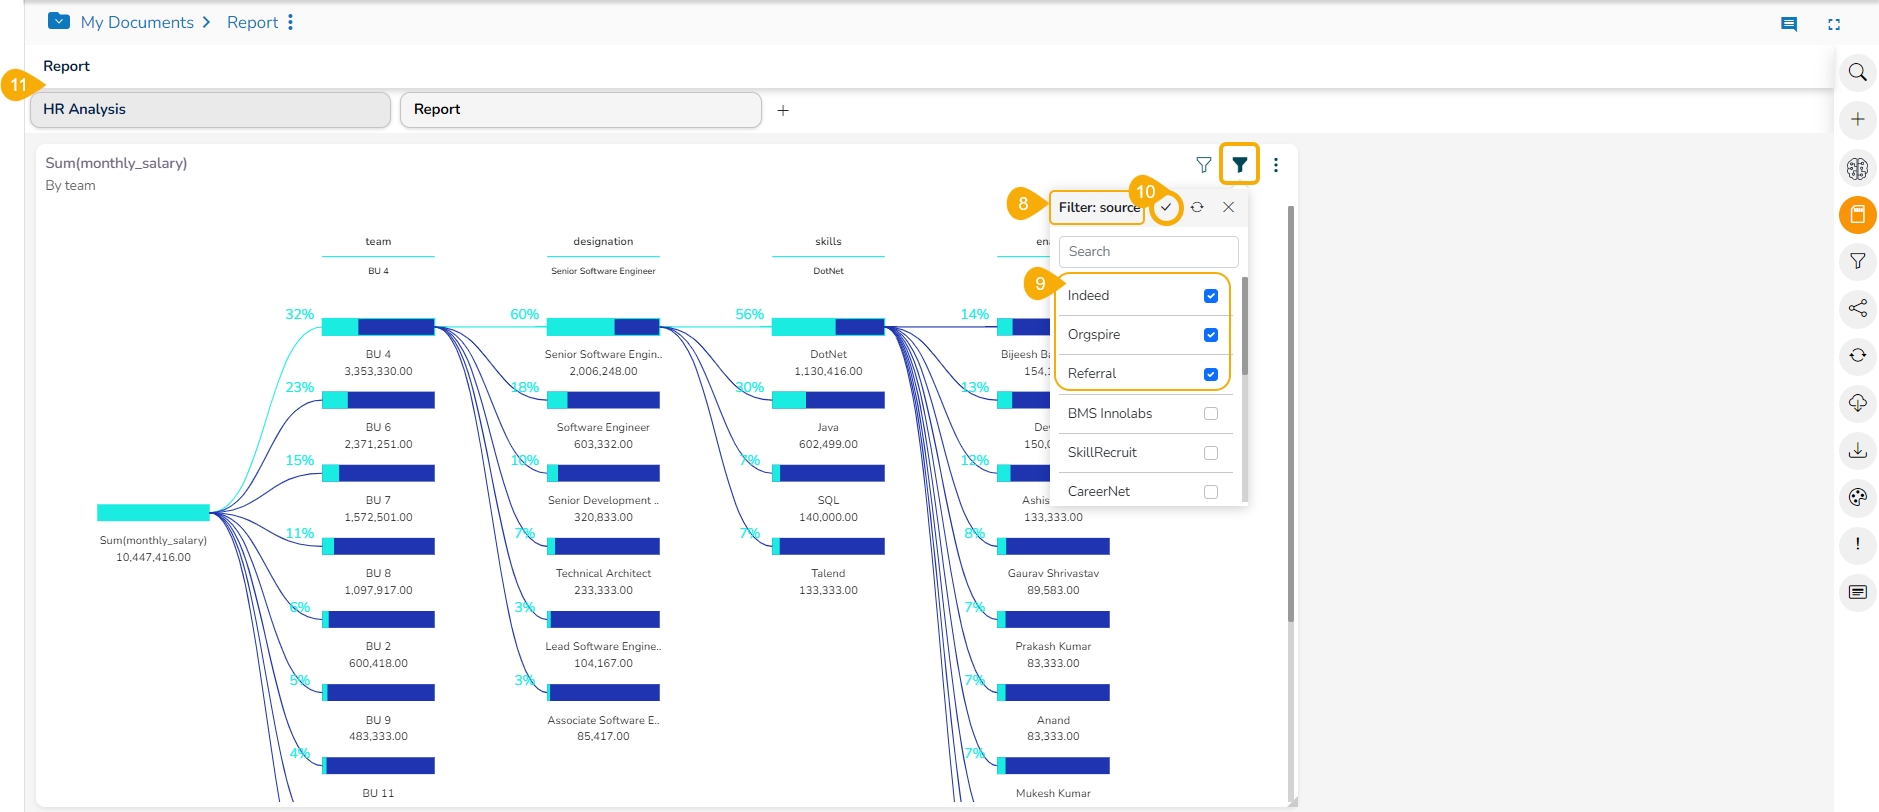
Access the View with the set View Filter from the final screen of the report.
Click the Card Filter icon.
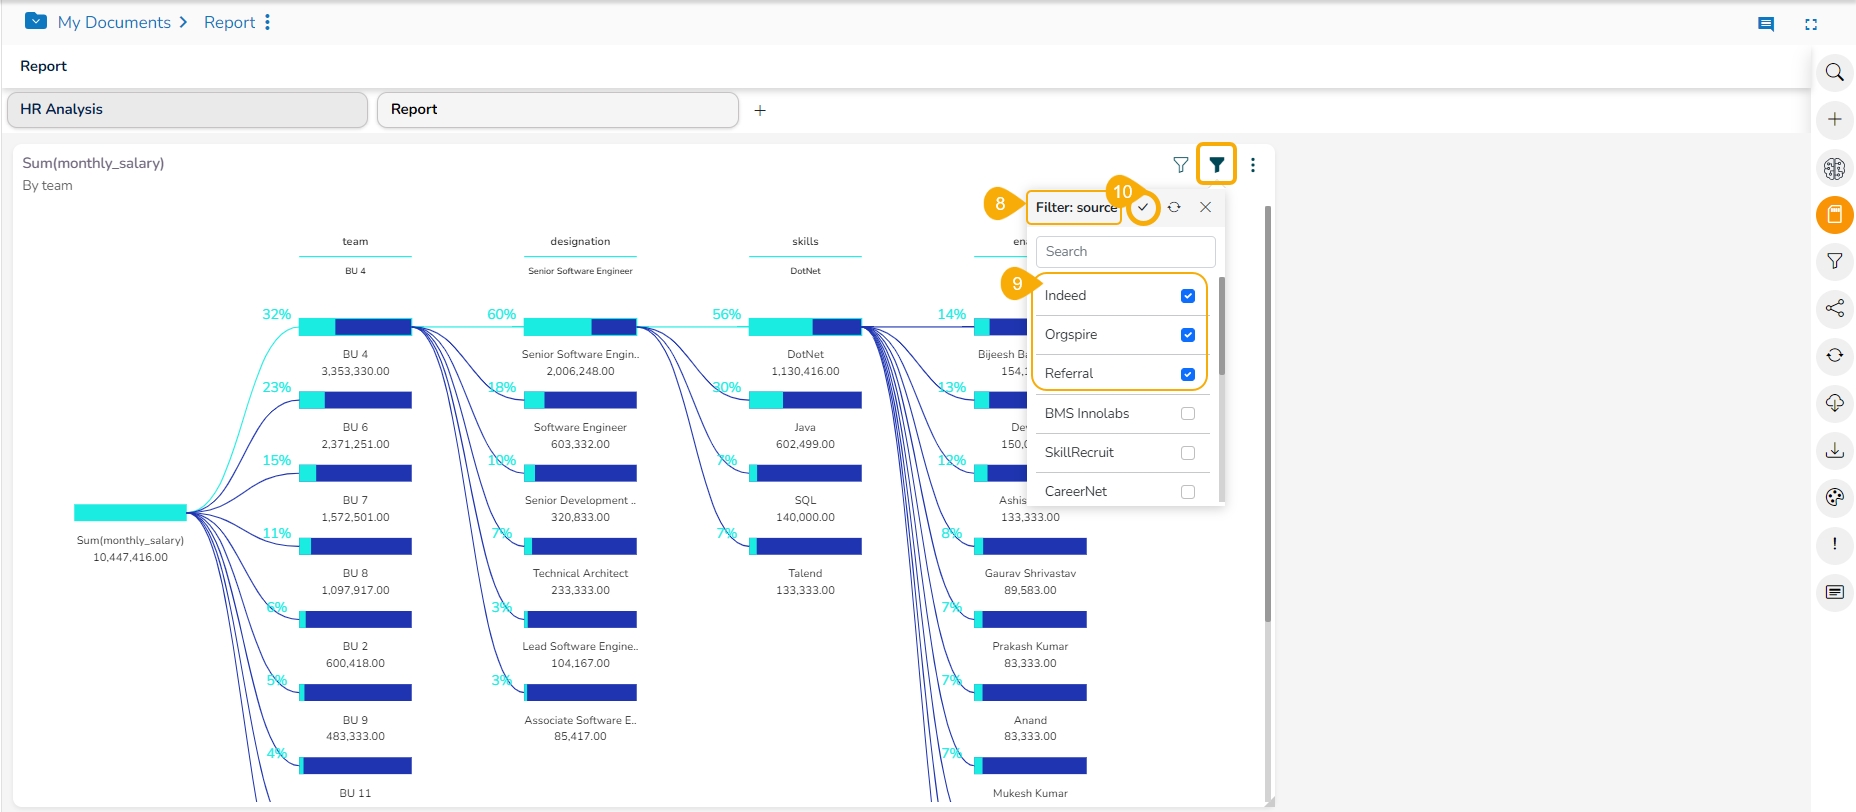
The selected View Filter option appears in the Card Filter context menu (In this case, it is 'Source').
Use the given check boxes to select various sources from the available list of the Source .
Click the Apply icon.
The concerned View gets customized as per the selected filter condition.
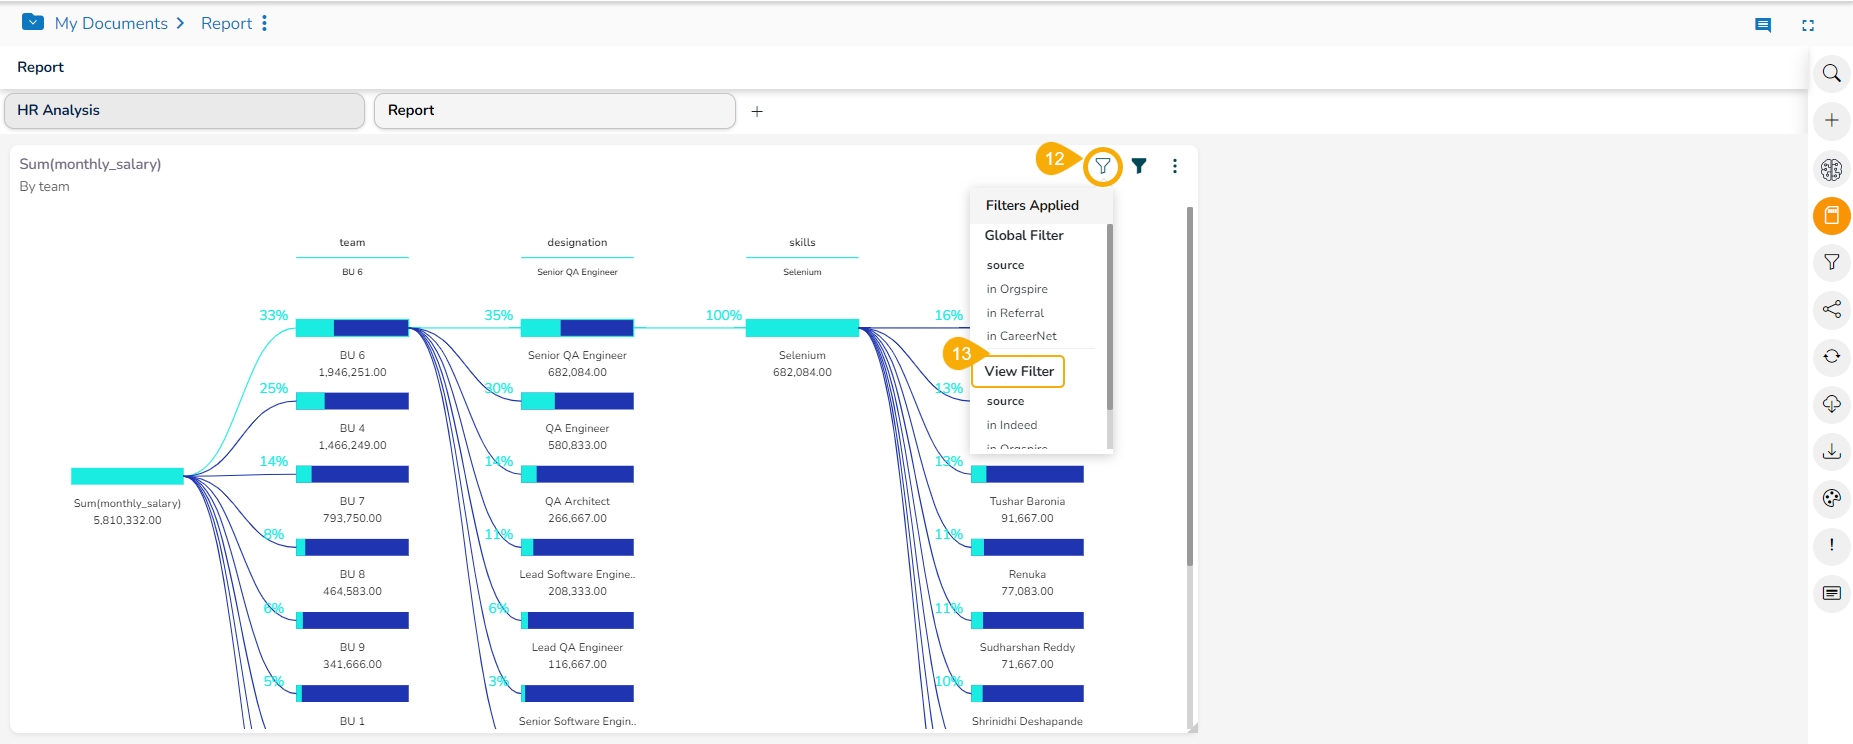
Click the Filters Applied icon.
A context window opens with the details of the applied View Filters options.
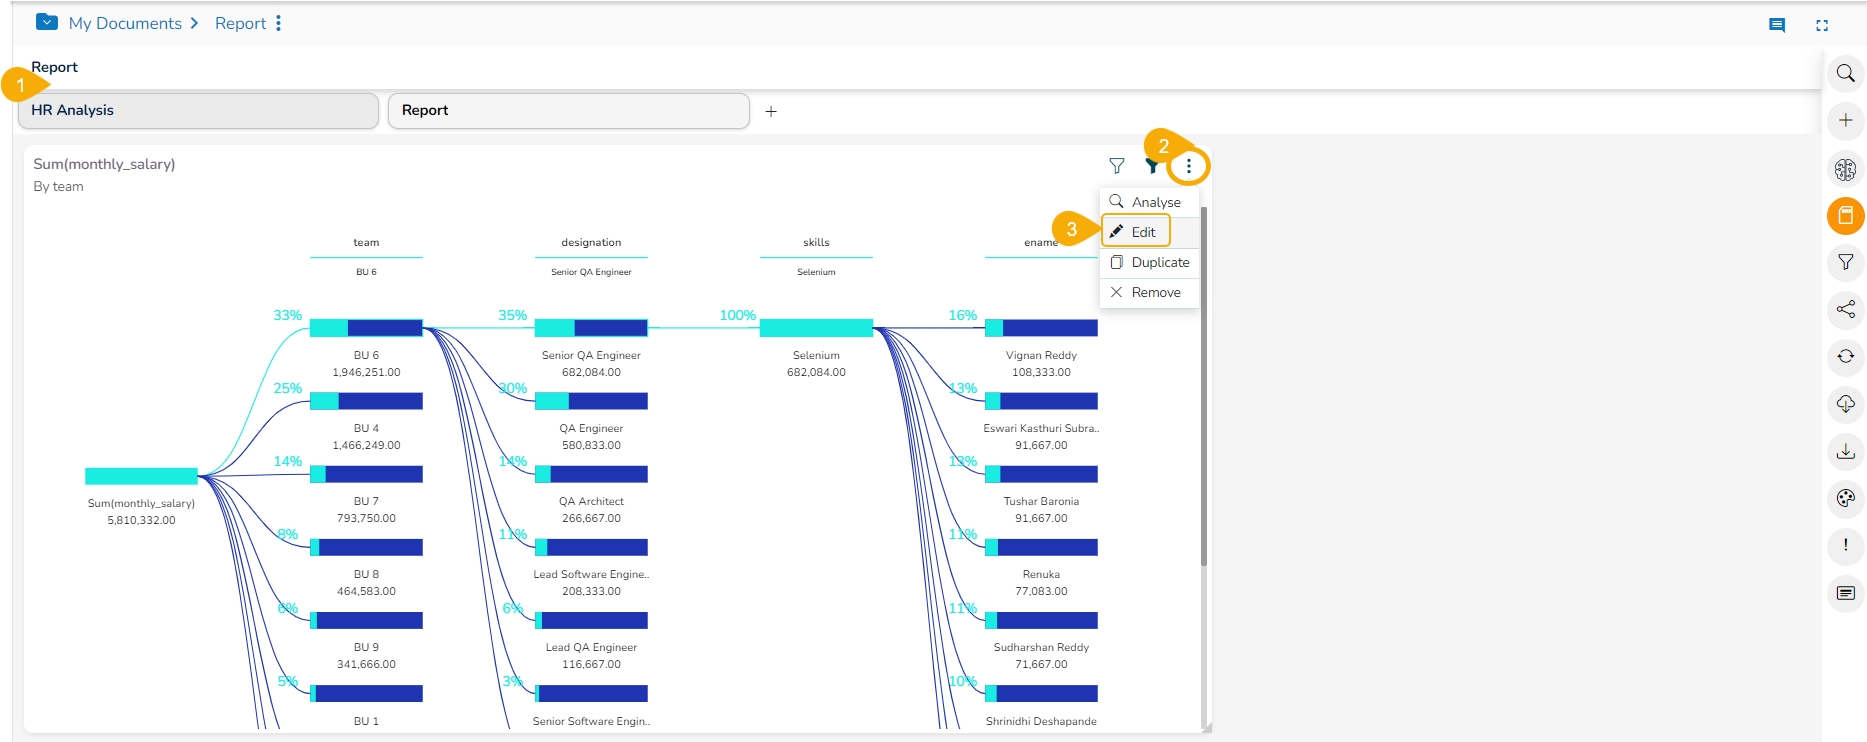
Select a View with Custom View Filter from the final screen of the report.
Click the ellipsis icon.
Click Edit option for the same View from the selected Report.
The view opens in the Design Workspace, the View Filter (Custom Filter) condition does not remain effective on the View when it opens in the design mode.
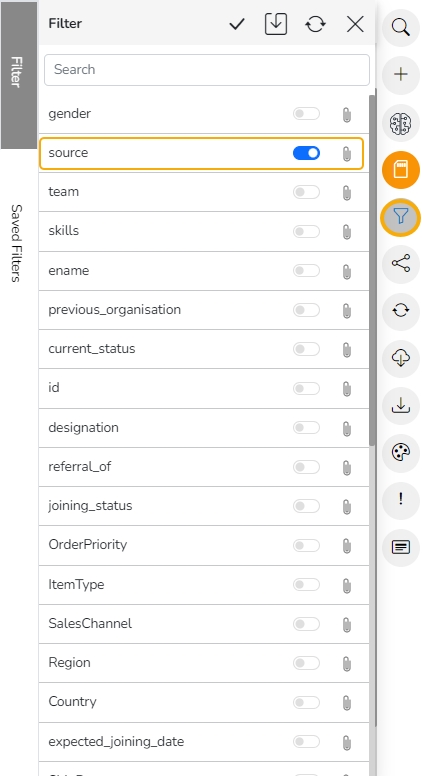
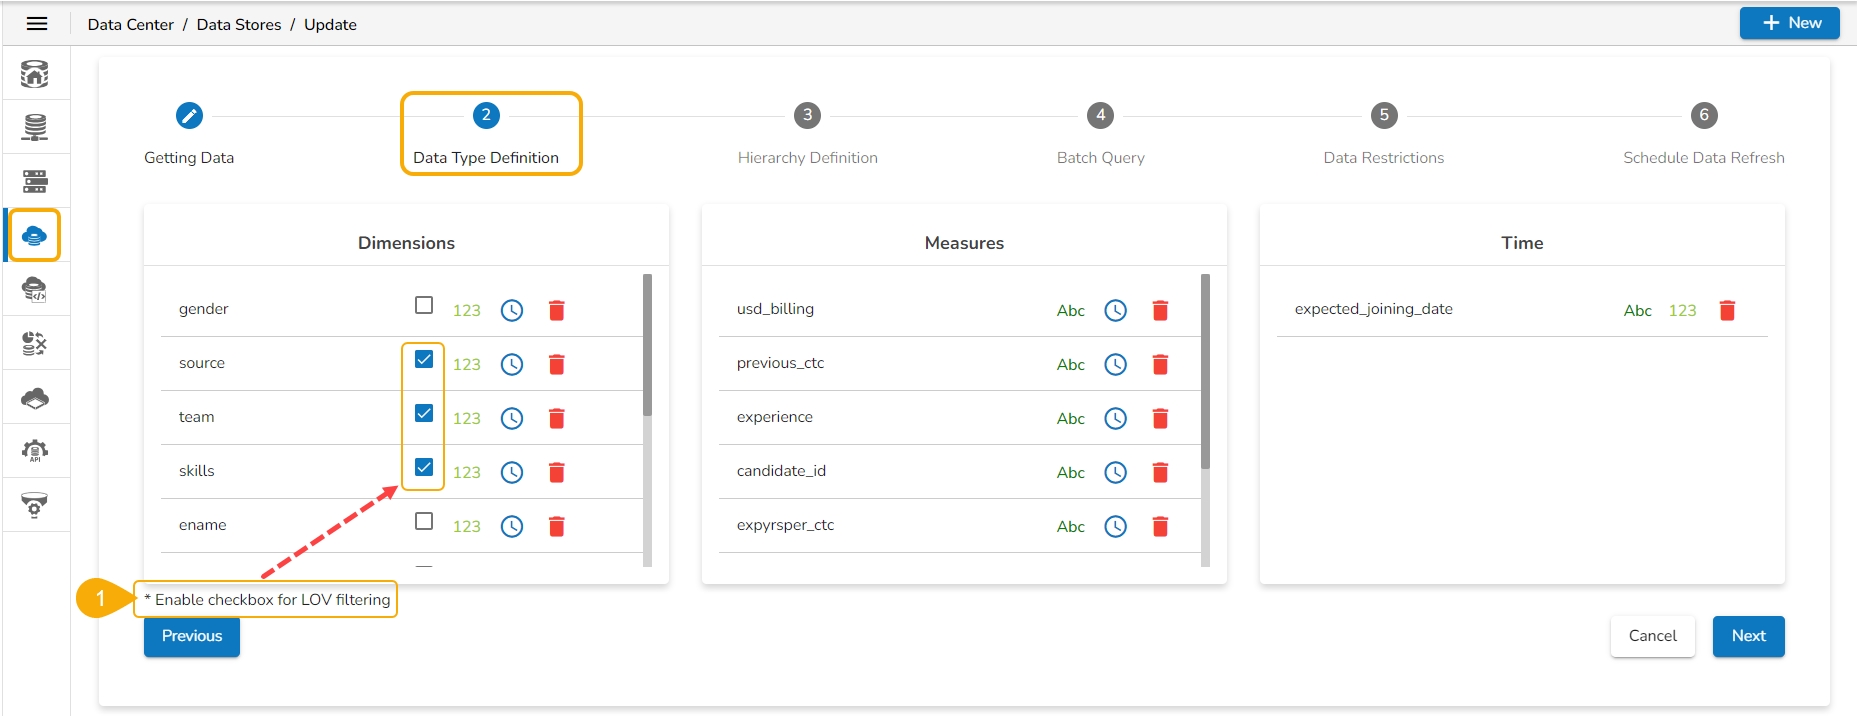
The user can enable the filter and lookup for specific dimensions via the Data Type Definition step for a Data Store. All the selected (enabled) dimensions list with the sub-values, while for the disabled ones, no sub-values appear. This operation applies to both Local and Global filters.
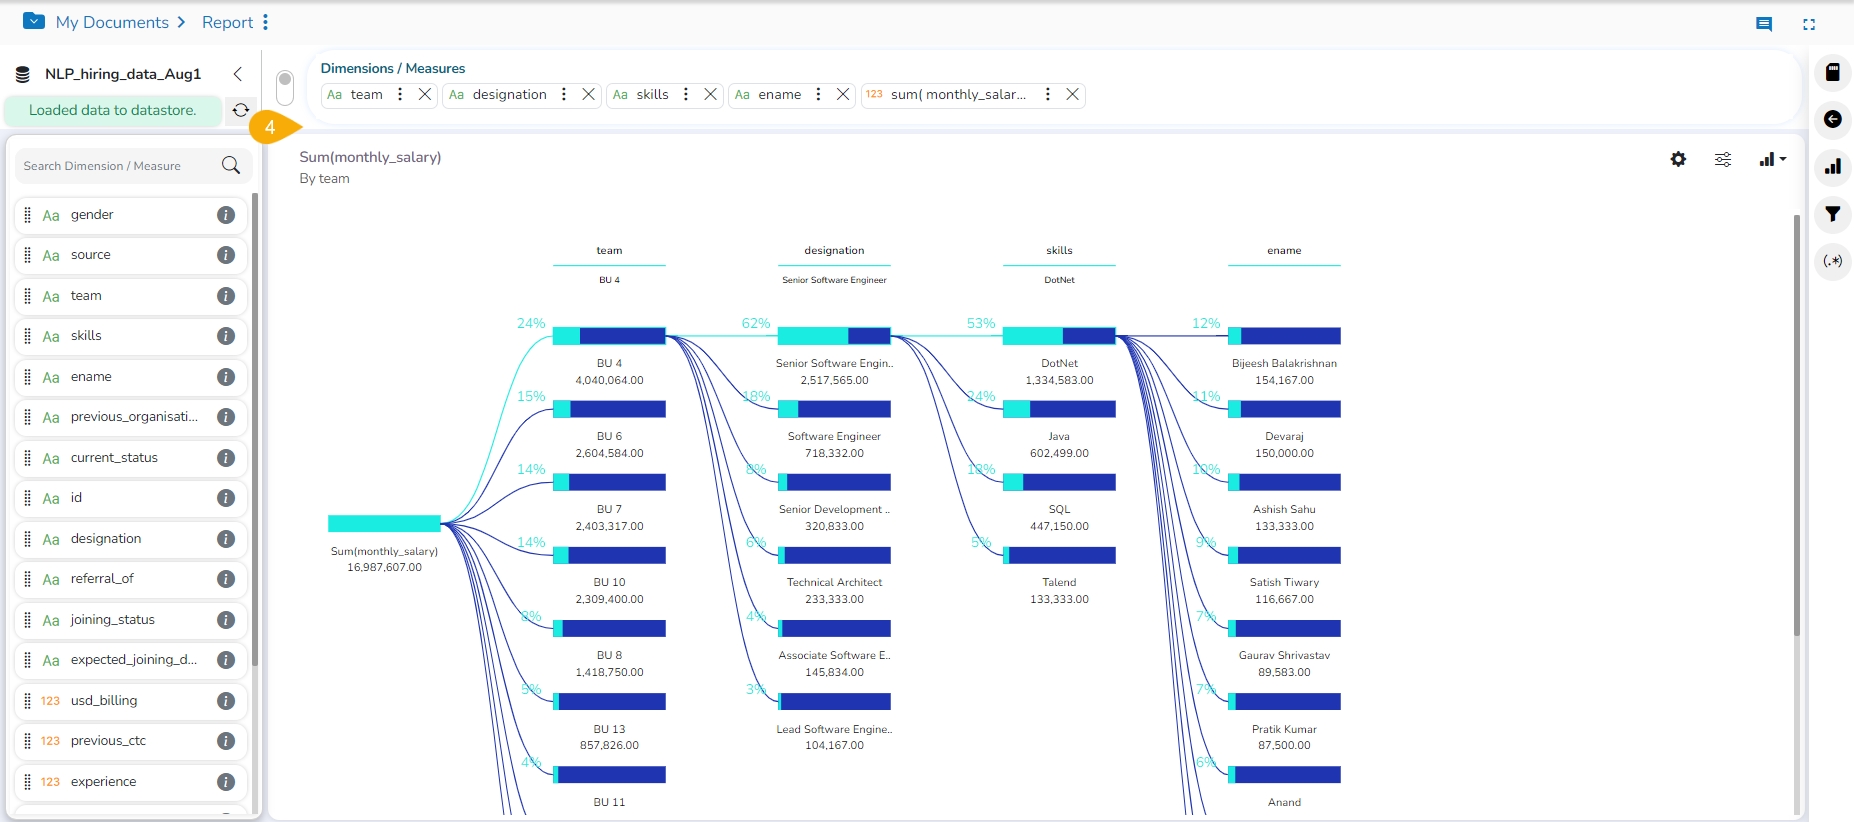
Navigate to the Data Type Definition page for a Data Store (the image displays the Data Type Definition page for the Data Store where Dimensions like gender, skills, and ename are enabled for the filter lookup function, but source, previous_organisation, and team are disabled from the filter lookup.
Click the Save option to save the View.
Create a report based on the same Data Store and save it with relevant views.
Access the global filter panel.
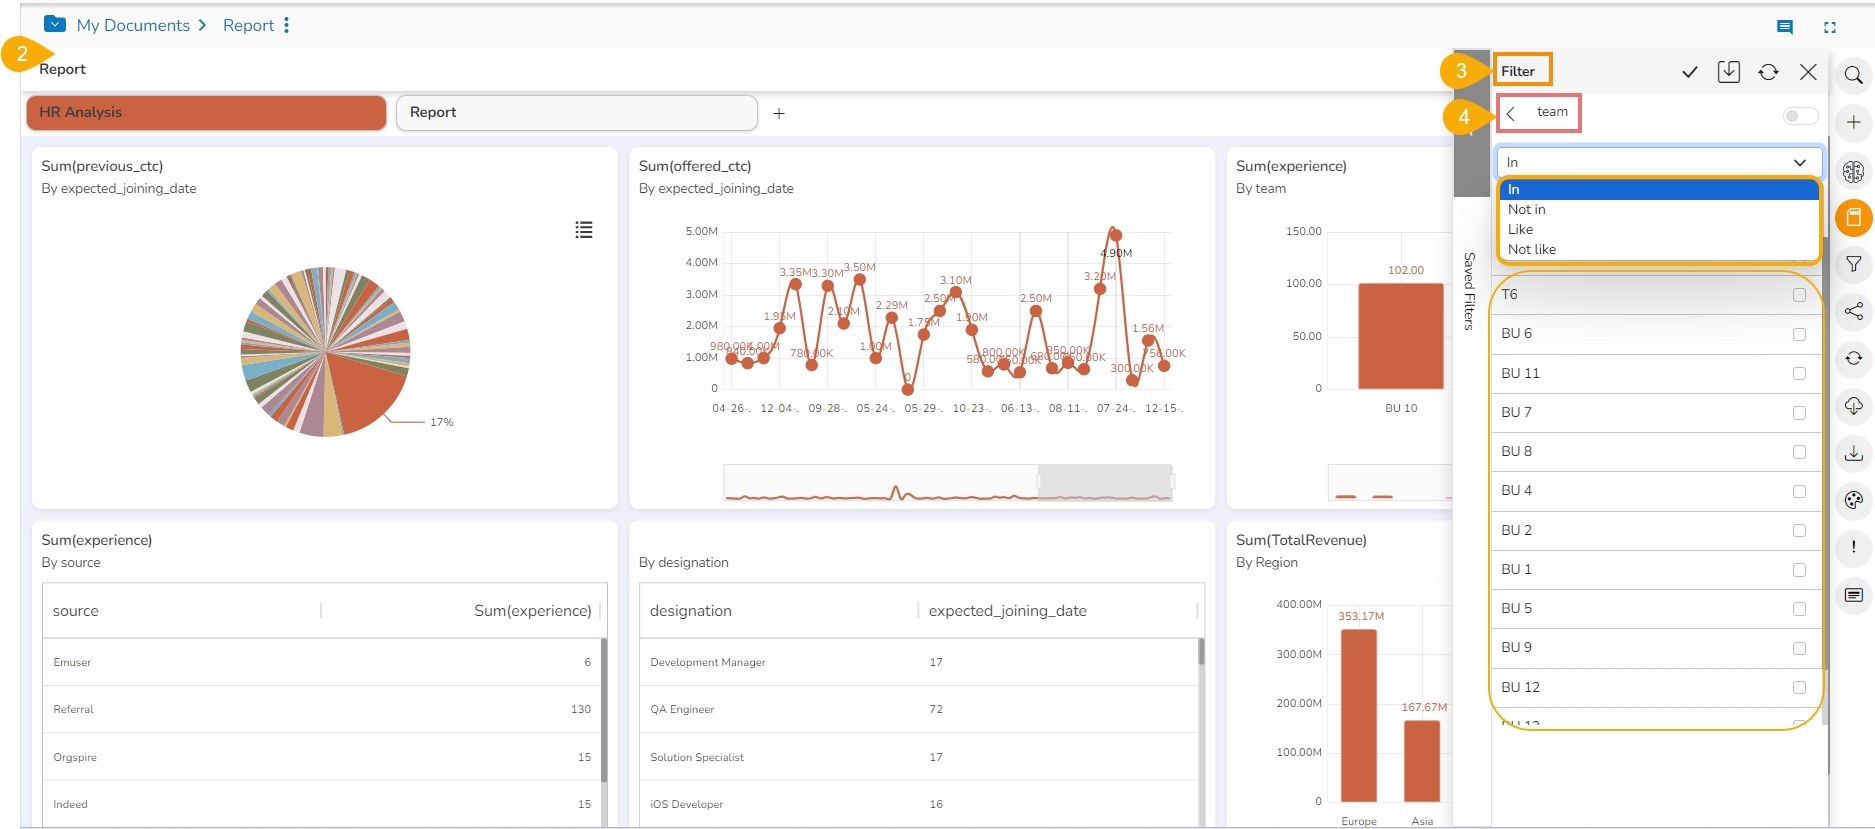
Select any of the disabled Dimension values (E.g., the State dimension is selected from the Filter panel in the following image).
The sub-values for the Designation dimension do not get displayed.
Only Like and Not Like options can be applied to the disabled dimensions.
Navigate to the View.
Open the Filter panel.
Select any of the enabled Dimension values (E.g., the City as Dimension value has been selected in the given image).
It displays all the filter operations In, Not In, Like, and Not Like options for the enabled dimension.
The user can successfully apply the Like or Not Like option.
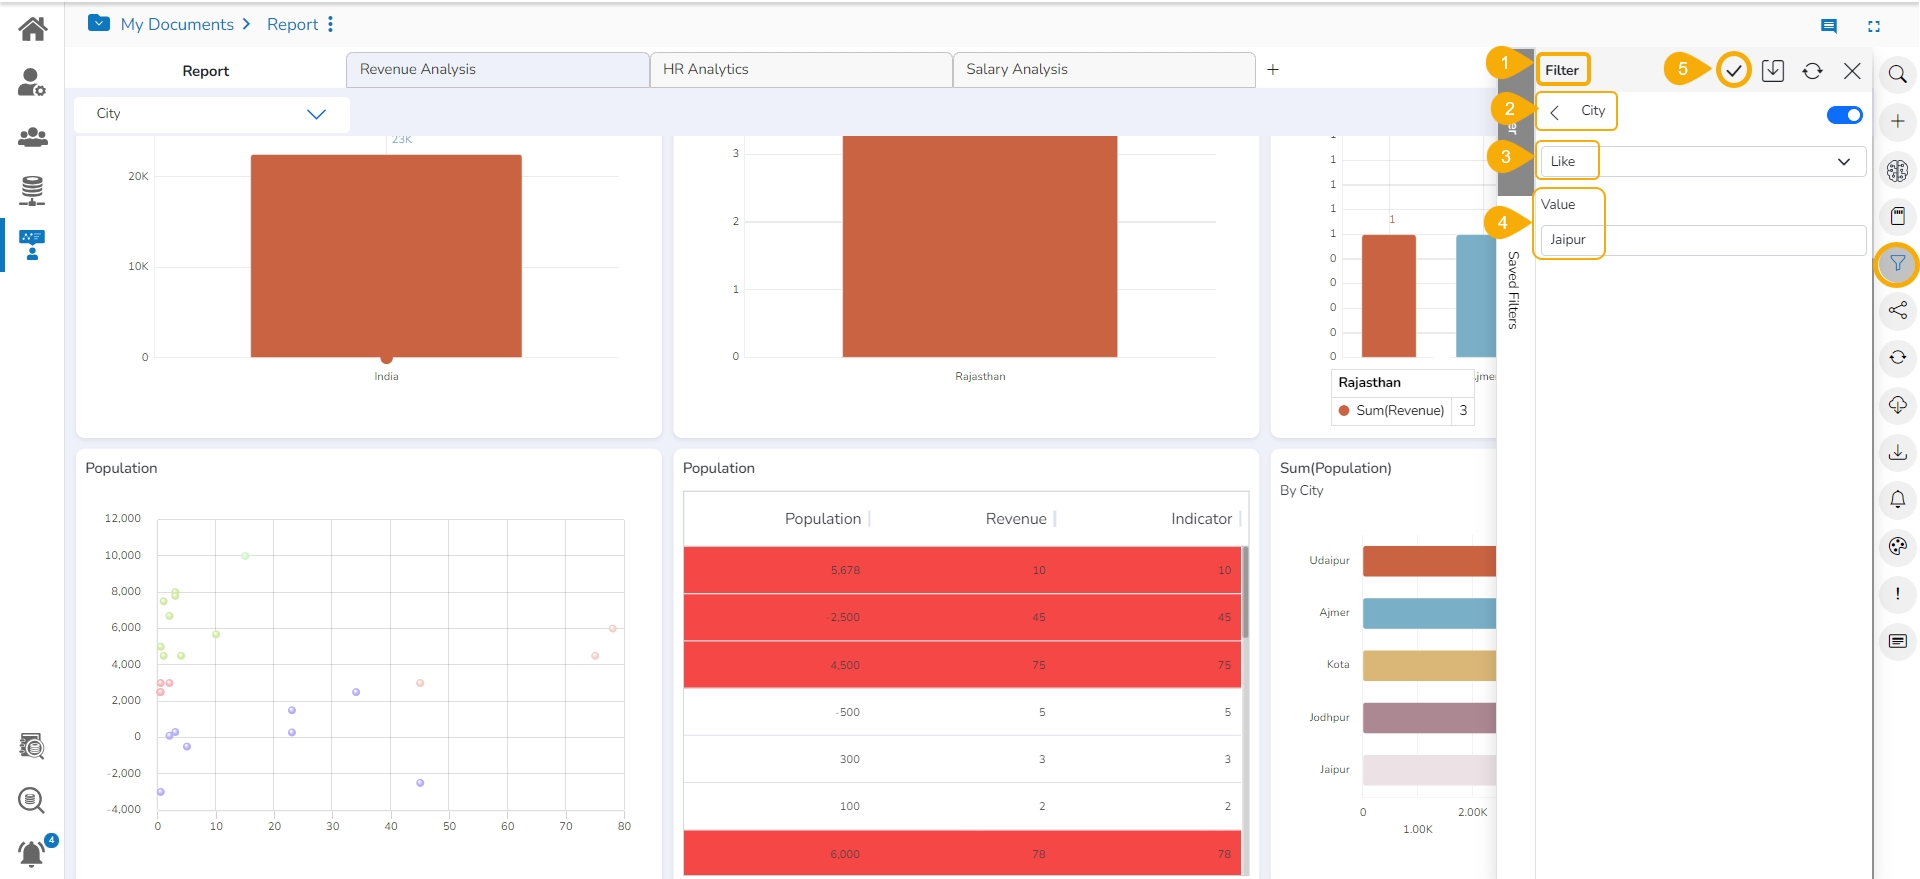
Open the Global Filter panel.
Select a dimension value.
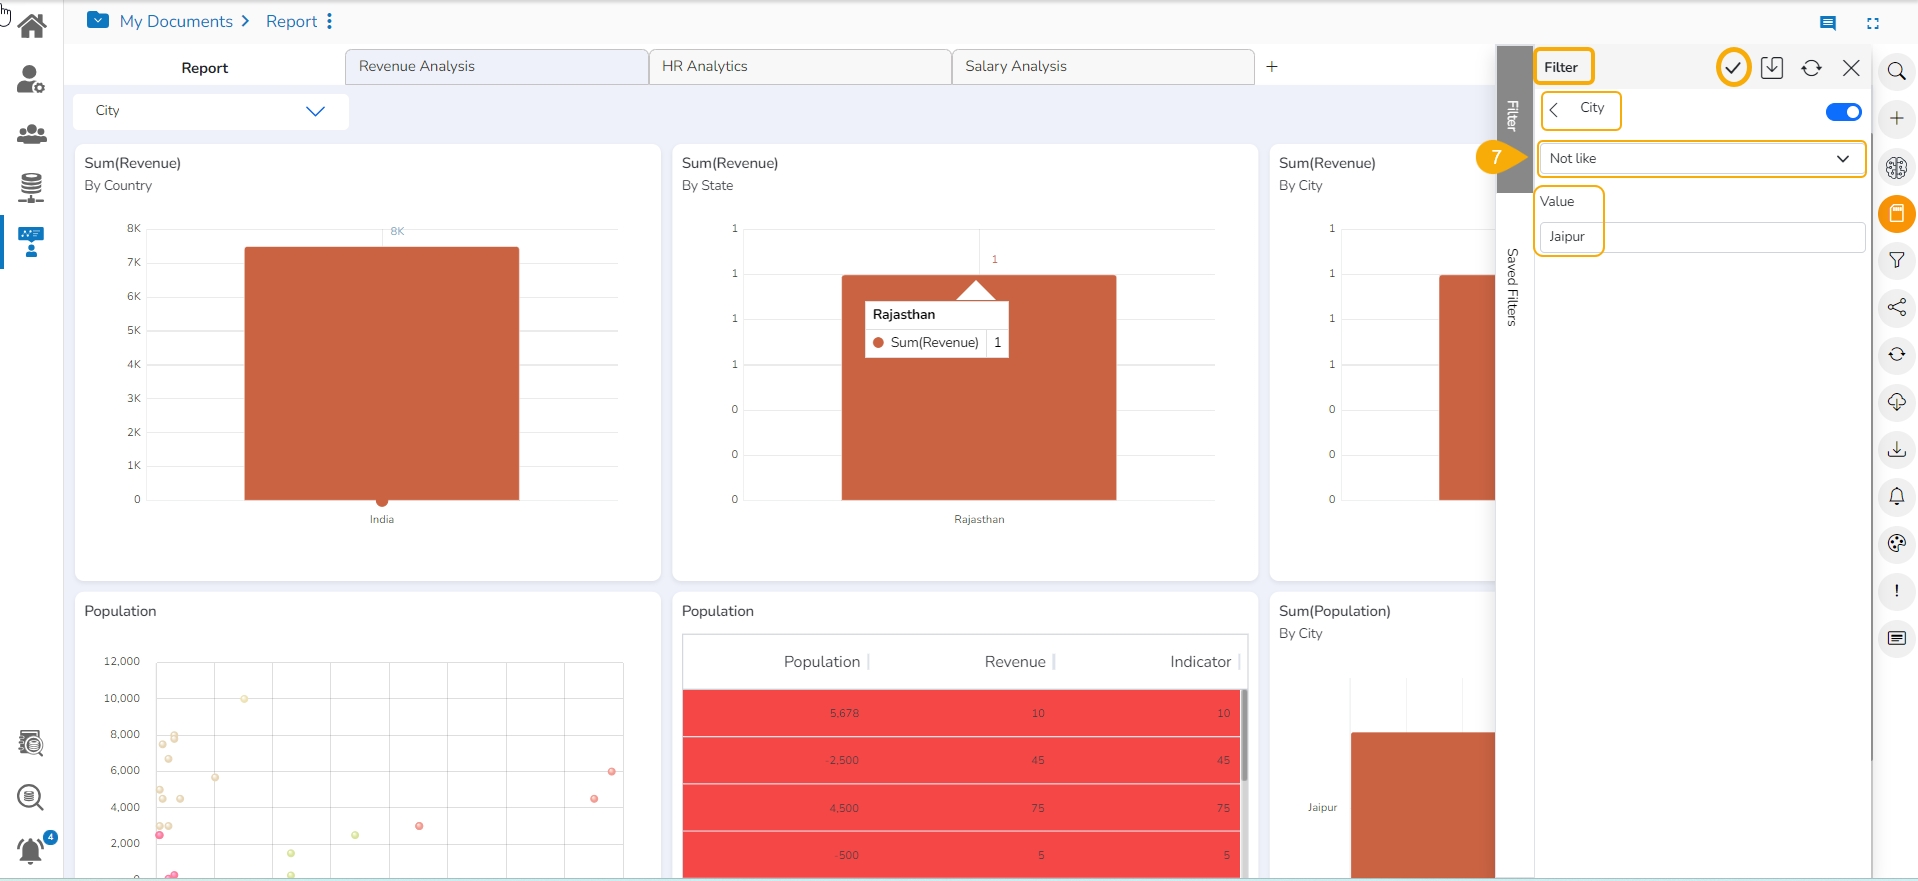
Select an option out of Like or Not Like choices (E.g., Like option has been selected in this case).
Manually provide a sub-value to filter the Report (E.g., Jaipur is the selected sub-value from the City dimension).
Click the Apply icon.
The Report Views get filtered by the selected sub-value.
Select the Not Like as the filter operation for the same sub-value.
The concerned views get filtered, excluding the entered values (E.g., The Report displays filtered data with the values except the data of Jaipur city).