# Drag and Drop Charts
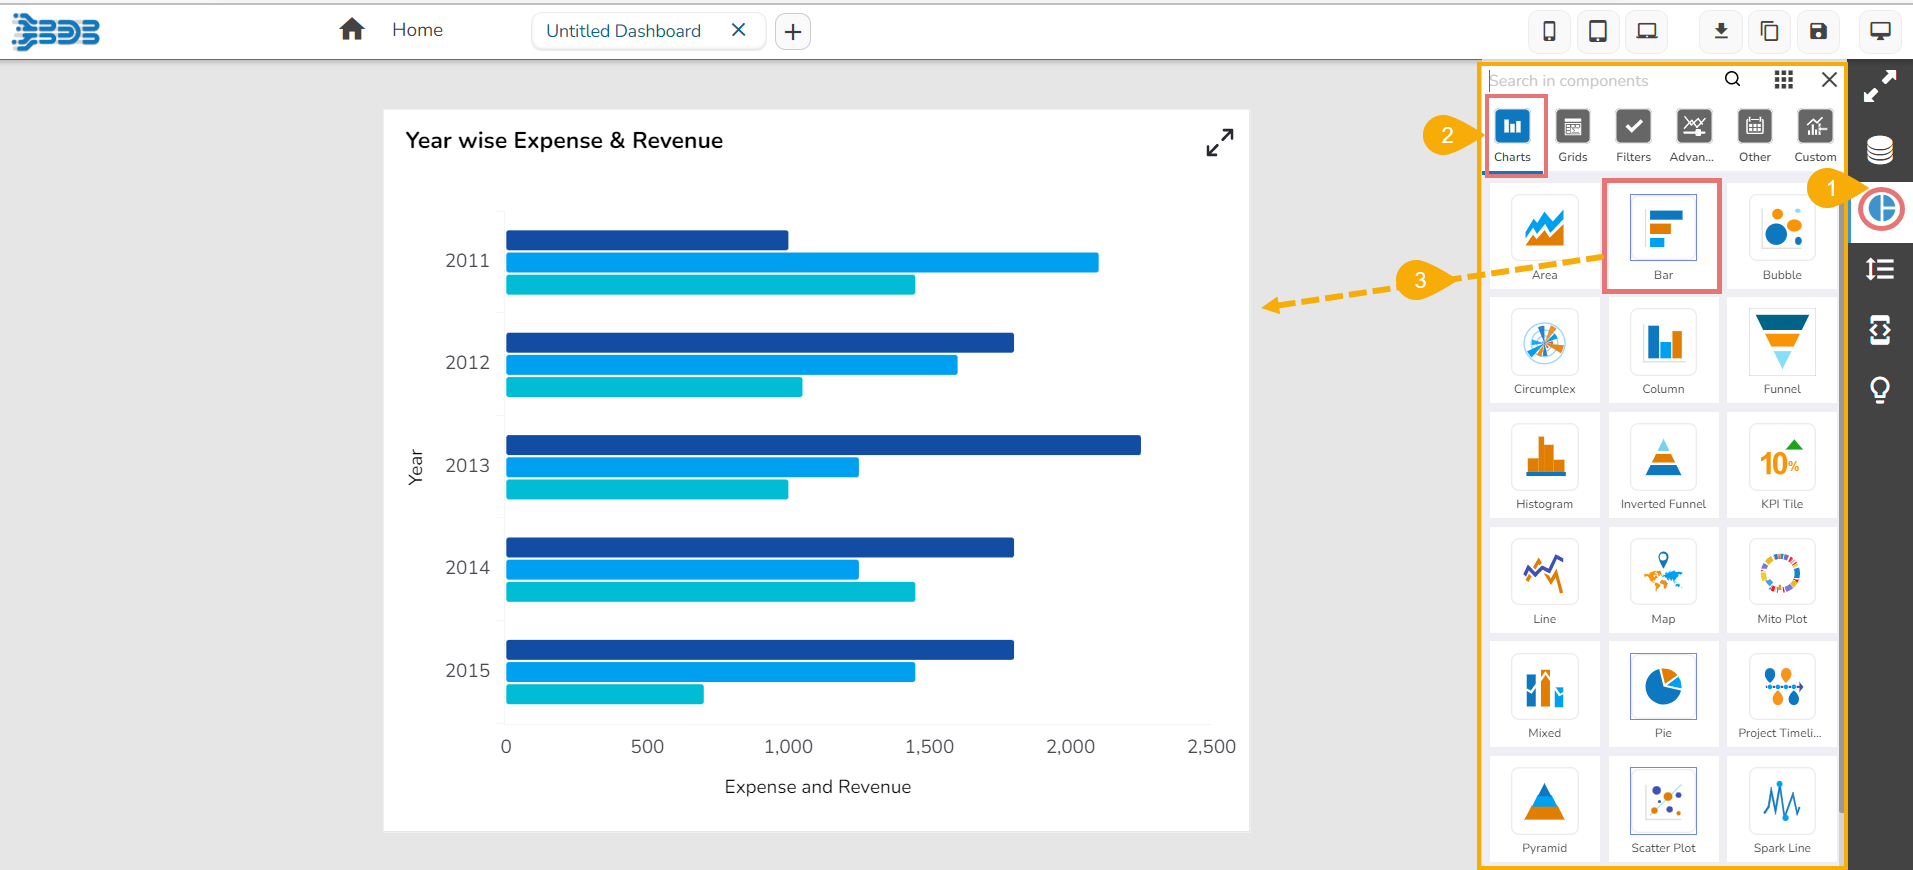
* Click the ***Component Library*** icon from the right edge of the window.
* Various categories of the available charting components get displayed (The ***Charts*** category gets selected by default).
* Select and drag a component on the canvas.
Dragging a chart to the canvas
---
# Agent Instructions: Querying This Documentation
If you need additional information that is not directly available in this page, you can query the documentation dynamically by asking a question.
Perform an HTTP GET request on the current page URL with the `ask` query parameter:
```
GET https://docs.bdb.ai/governed-dashboards-1/create-new-dashboard/drag-and-drop-charts.md?ask=
```
The question should be specific, self-contained, and written in natural language.
The response will contain a direct answer to the question and relevant excerpts and sources from the documentation.
Use this mechanism when the answer is not explicitly present in the current page, you need clarification or additional context, or you want to retrieve related documentation sections.