# Resource Utilization Graph

{% hint style="info" %}
*Check out the given illustration to understand how the resource utilization graph gets displayed for a Notebook.*
{% endhint %}

<figure><img src="https://1025450693-files.gitbook.io/~/files/v0/b/gitbook-x-prod.appspot.com/o/spaces%2Figrg2b2URgwMO5YmejDu%2Fuploads%2FCuxpUm4RXy1MAM2appya%2FResource%20utilization%20graph.gif?alt=media&#x26;token=8b055d3f-f5b7-49db-8520-d7c6375c794b" alt=""><figcaption><p>Resource Utilization graph for a Notebook</p></figcaption></figure>

{% hint style="info" %}
*<mark style="color:green;">Please Note:</mark> The graph displays requests and limits of CPU and Memory respectively. The values will be calculated and previewed in the UI after each cell execution.*
{% endhint %}

* The below-given image displays the resource utilization graph when the utilized resources are within the set limit.

<figure><img src="https://1025450693-files.gitbook.io/~/files/v0/b/gitbook-x-prod.appspot.com/o/spaces%2Figrg2b2URgwMO5YmejDu%2Fuploads%2F0UgseTHvIcKCYygKZHmf%2Fimage.png?alt=media&#x26;token=09c1b4dd-103d-4999-807e-786f3a916083" alt=""><figcaption><p>
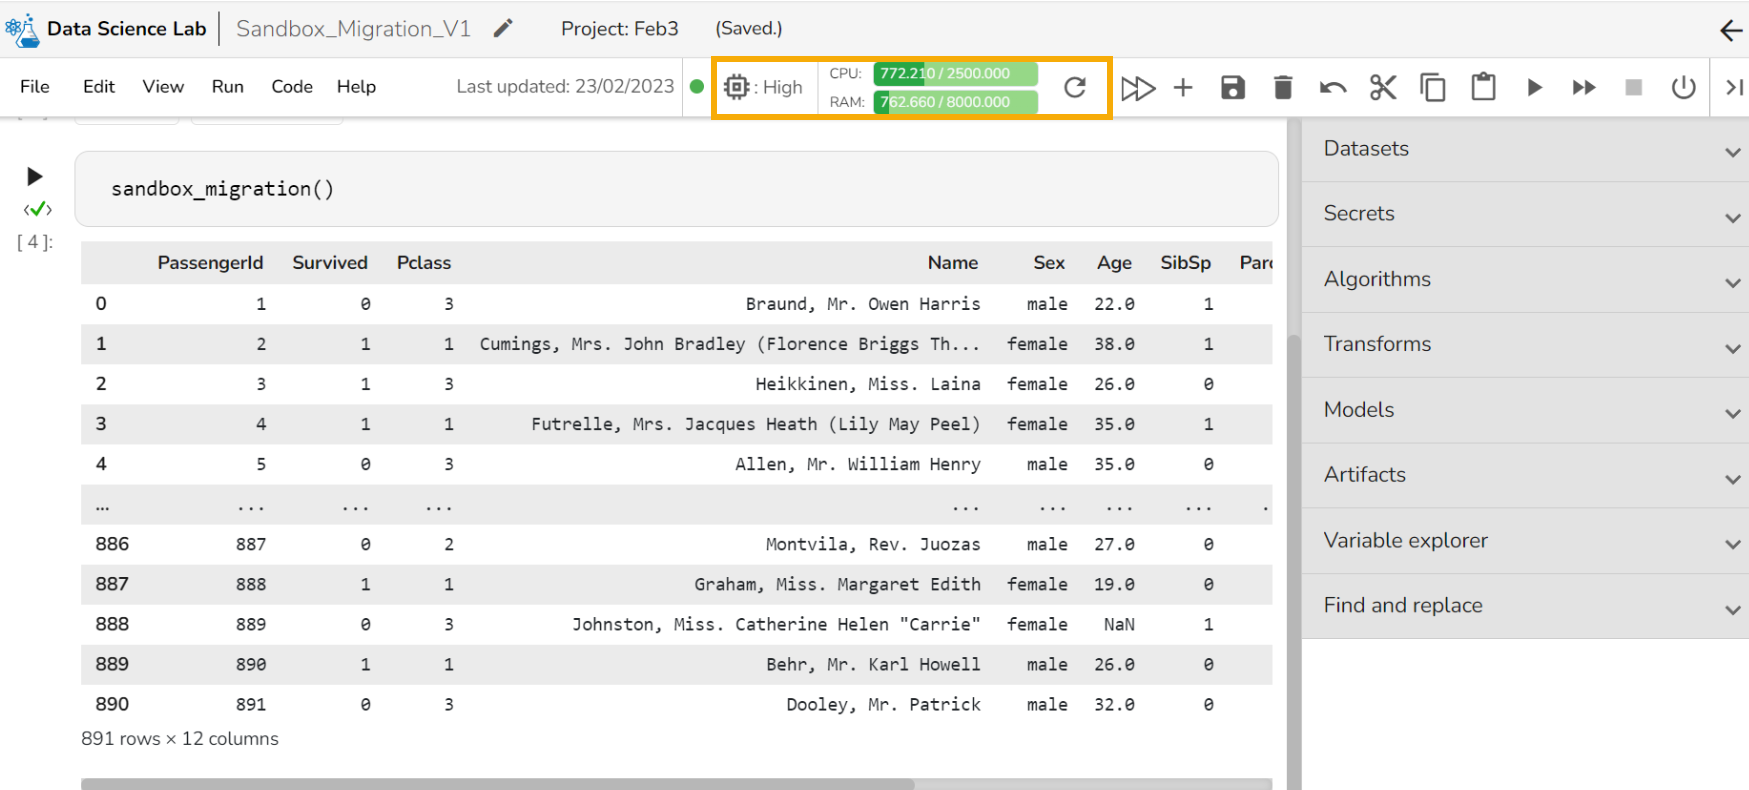
Resource Utilization Graph after consuming resources below 60% of the given limit </p></figcaption></figure>

If 60% of the given limit gets utilized the resource utilization graph turns yellow in color (as shown in the below-given image).

<figure><img src="https://1025450693-files.gitbook.io/~/files/v0/b/gitbook-x-prod.appspot.com/o/spaces%2Figrg2b2URgwMO5YmejDu%2Fuploads%2FoPb9gavMSAaUe8ZwVVtK%2FResource_Yellow.png?alt=media&#x26;token=a11e79a4-d669-405f-a38e-d630e1134297" alt=""><figcaption><p>
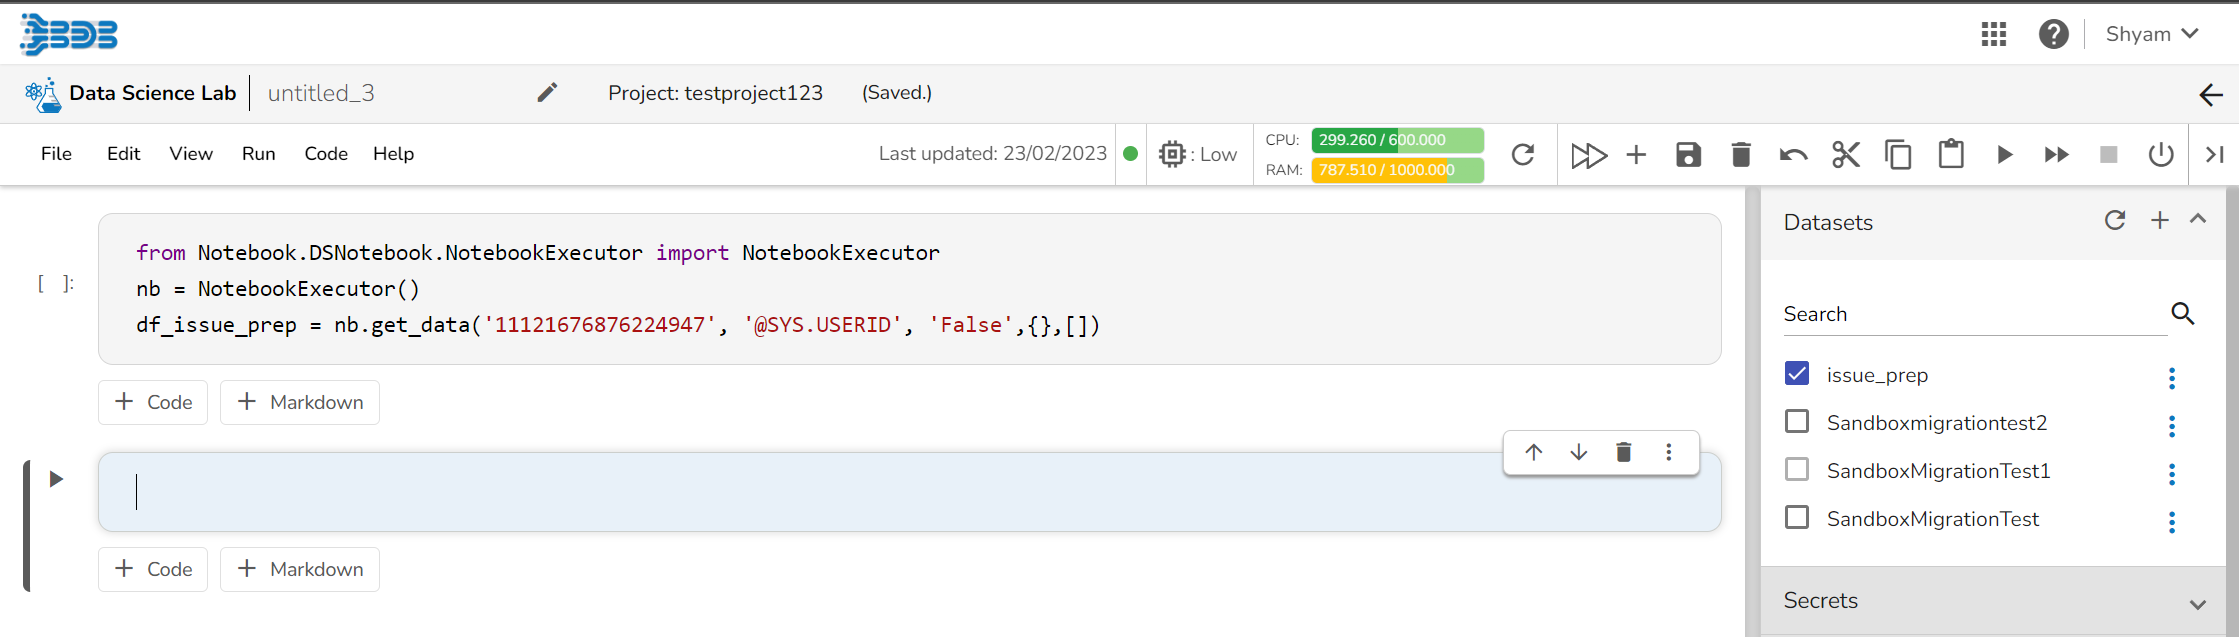
Resource Utilization Graph after consuming 60% of the given limit of the resources</p></figcaption></figure>

* If 80% of the given limit gets utilized the resource utilization graph turns red in color (as shown in the below-given image).

<figure><img src="https://1025450693-files.gitbook.io/~/files/v0/b/gitbook-x-prod.appspot.com/o/spaces%2Figrg2b2URgwMO5YmejDu%2Fuploads%2FpwgRisUa18d30szypicR%2FResource_Red.png?alt=media&#x26;token=5a6575c3-2e0c-46b8-9f20-6a9a9288252f" alt=""><figcaption><p>
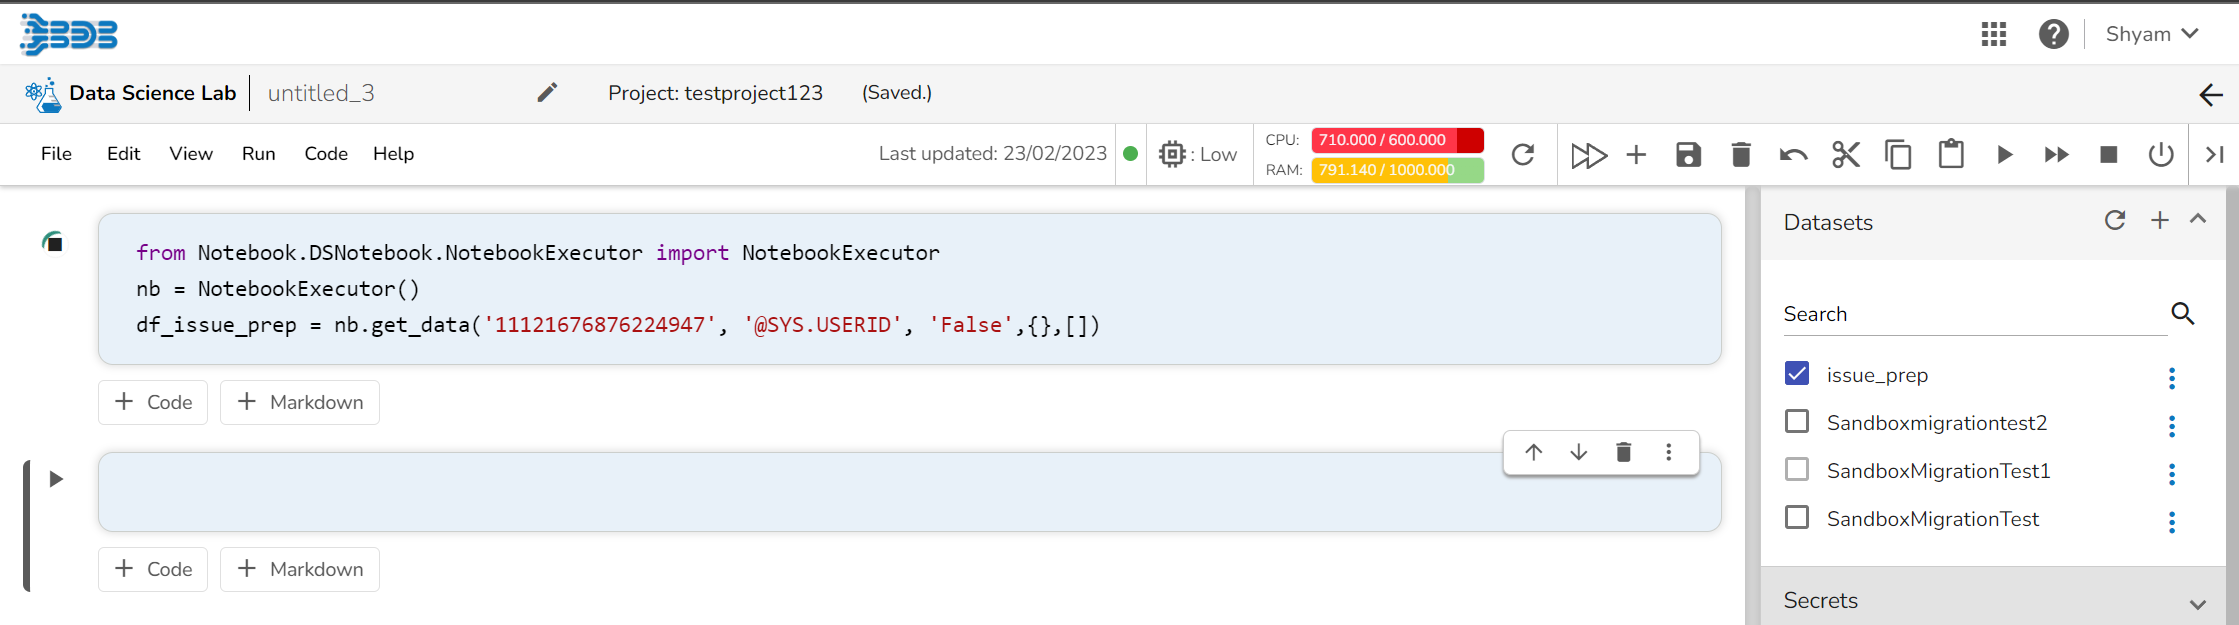
Resource Utilization Graph after consuming 80% of the given limit of the resources</p></figcaption></figure>
